164 | P a g e
TOWARDS A FOSSIL FREE ENERGY PRODUCTION USING
GIS MULTI-CRITERIA DECISION-MAKING SUPPORT
TOOL
Abstract:
Egypt’s Sustainable Development Strategy: Vision 2030 calls for renewable energy plans and the adoption of a sustainable development approach. Given the government’s gradual removal of energy subsidies for local citizens and the current energy crises, the study in hand aims to detect potential investment zones for free fossil fuel energy production. Site analysis for renewable energy allocation using GIS to identify potential capability to locate a renewable energy source was applied in the Sinai Peninsula in Egypt. The study used an accumulative co-relation matrix between different development sectors, Sinai’s geographical location and promising future investment scenarios. A set of data analysis process was developed to examine potentials and constraints. The analysis revealed that 36% of the area is suitable for the development of solar farms and a further 4% for wind farms. These findings could help decision makers to fill the gap between the country’s future energy needs and its available natural sources. Applying this methodology across the different areas offering similar potential in Egypt would help to identify more likely locations for renewable energy production. Wider replication of the method could also point to the significant contribution that different zones in Egypt, and even in other zones within the Middle East region, could make towards a more sustainable future.
Key words:
GIS, Sinai, Overlay Analysis, MCDM, Fossil Free Energy
El-Sayed, Marwa Adel ᵃ
Dabaieh, Marwaᵃᵇ
Ismaeel, Walaa S.E.ᵃ
Kenawy, Injiᶜ
ᵃThe British University in Egypt, Department of Architecture, Cairo, Egypt ᵇ Malmo University, Department of Urban Studies, Sweden.
ᶜSalford University, Department of Architecture, Manchester, England
Marwa.adel@bue.edu.eg, marwa.dabaieh@mah.se,
165 | P a g e
1. Introduction:
Using non-renewable fossil fuel for energy production has a direct negative impact on the environment as well as indirect health impacts on human beings. Renewable energy is becoming one of the more viable solutions for the majority of fuel related environmental problems faced today. In serval studies it has been proved that total emissions exponentially decrease with the setting up renewable energy systems (Khoshnevis Yazdi and Shakouri, 2018). Promoting the use of renewable energy carries several environmental, economic and social benefits. Environmental benefits are evident in the reduction of environmental pollution of air, water, etc. (Akella et al., 2009). Such actions increase self-reliance and regional/national energy independence in addition to promoting more technological developments, particularly in energy development and maintenance services. Using renewable energy is therefore linked to sustainable development (Dincer, 2000). The growing significance of sustainable development has brought with it considerable growth in renewable energy research and applications. Additional benefits include significant work opportunities, the possibility to diversify the economy, and the benefits that flow from the cost effectiveness of some renewable energy applications. This leads to money saved from reduced fuel use and electricity bills, diversification and maintaining security for supply sources of energy, and encouraging the deregulation of energy markets; also, support electrification in off grid areas particularly in developing countries (Dabaieh et al., 2016). The International Renewable Energy Agency (IRENA, 2015) has declared that the installed global renewable energy capacity had reached 1,829 GW by 2014. According to Watson and Hudson (2015), wind and solar photovoltaic (PV) are considered among the fastest growing technologies in electricity generation.
Egypt’s Sustainable Development Strategy: Vision 2030 aims to maximize the use of domestic energy resources and develop the capacity of its energy sector in both the Eastern and Western deserts of Egypt as well as in the Sinai Peninsula. This would in turn adjust domestic and international developments in the fields of energy and innovation; and promote the use of renewable energy. The fact of having almost 96% of the country as undeveloped desert makes the Peninsula an excellent potential location for the deployment of such renewable energy resources. As identified by the Egyptian Electric Utility and Consumer Protection Regulatory Agency, solar and wind generation are considered the two main sources for renewable energy in Egypt. The Agency observes that two-thirds of the geographical desert area within the country has more than 6.4 kWh/m2/day of solar energy intensity. Accordingly, Egypt could receive up to 3,000 kWh/ m2/year, which would represent one of the country’s main future development mega project goals. The potential for wind generation in many areas such as the Red Sea is also
166 | P a g e
significant as wind speed can achieve as much as 10 m/sec. This led the New and Renewable Energy Authority (NREA) to develop different wind energy projects with a total installed capacity of 550 MW in Zafarana and Hurghada in 2010. There are also current projects under construction with a capacity of 1120 MW (Egyptian Electric Utility, 2016). Additionally, some existing off grid resorts and tourist villages by the Red Sea and in the Sinai region operate using mainly Independent Power Producers (IPPs), which indicates considerable potential for wider development (Georgy & Soliman 2007).
Referring to the likelihood that sooner or later the Egyptian government will depend mainly on renewable energies if it is to benefit from clean and fossil free energy sources, this research study puts forward a pilot methodology that can be applicable throughout Egypt to locate suitable places for renewable energy production. Sinai was chosen as a pilot case for this study methodology application (see figure 1). The techniques to choose optimum locations for the generation of solar and wind energy were applied throughout to create criteria to build up a site analysis system using GIS (the Geographic Information System). These criteria were generated with the help of a matrix library of queries in GIS to locate the most efficient locations for wind and solar generation. Other spatial resources and constraints were also taken into consideration. Hence, this study will focus on the aspects of improving the decision-making process, and on the geographical management of renewable energy production, as a
part of larger scale of sustainable urban development. The results and findings for potential zones for both solar and wind energy production will be discussed together with recommendations for further and wider applications.
Figure 1: Sinai Peninsula showing the restrictions on development in Sector
(A) laid down by the Camp David Agreement in 1978.
167 | P a g e
1.1 GIS SCIENCE, SPATIAL ANALYSIS, & MULTI-CRITERIA DESCISION MAKING.
The Geographical Information System (GIS) and Multi-Criteria Decision Making (MCDM) programs are the two main tools used to resolve various geospatial problems, including the allocation of sites for wind and solar farms. A geographic information system is a computer application supplied by the ESRI (Environmental Systems Research Institute, based in California). GIS can be integrated with economic and strategic value studies for deeper types of analysis. According to ESRI, the benefits of using GIS include the following: cost savings as the result of achieving greater efficiency, a better decision-making process, improved communication activity, and better archiving, record keeping, and geographical management (ESRI, 1998). The term Multiple Criteria Decision-Making allows systematic analysis of complex, usually conflicting criteria. The development of this science increases in importance with the advance of computer technology, which has generated a huge amount of data and information (Xu, 2012). Due to the complementary nature of both tools, it has been possible to integrate them into different studies to create a key new tool in sustainable energy studies (Sánchez-Lozano et al., 2013; Pohekar and Ramachandran, 2004).
1.2. APPLICATIONS USING GIS FOR MCDM
The use of GIS for multi-criteria decision analysis can be traced back to 1900 according to Malczewski (2006). The system on its own has been used for many research purposes and applications but Meng and Malczewski (2015) have developed a GIS based Multi-Criteria Decision-Making approach which they applied to evaluate ease of access to Canada’s public parks in Calgary, Alberta using a combination of both the weighted linear method and the entropy weighting method. Temiz and Tecim (2009) used GIS and MCDM to highlight the areas capable of coping with forest fires, based on their proximity to water resources, streams and settlement areas. They used Boolean Analysis and Analytic Hierarchy Process (AHP) for the studied area, and the results were visualized on a digital map. A susceptibility analysis carried by Dragicevic, Lai and Balram (2015) was conducted to identify areas at risk of landslide in Canada’s Metro Vancouver region, British Columbia. Their study used an integration of both multi-scale analysis and fuzzy sets with GIS-based multi-criteria evaluation (MCE).
168 | P a g e
More specifically to the focus of this research, Watson and Hudson (2015) discussed renewable energy mainly solar and wind as a key to minimizing the adverse environmental impact of development in England using GIS and MCDM and incorporating an analytical hierarchy process (AHP) involving expert stakeholders. Their study included an assessment of the proposed suitability model through a sensitivity analysis. Nguyen et al. (2015) developed the land suitability analysis using GIS-based multi-criteria subdivided into four different stages. Their analysis began with the selection of land characteristics, followed by a design of criteria to evaluate and score their selection. These criteria form partial performance indices for their feasibility analysis of a location’s agro-ecological suitability, environmental impact and socio-economic aspects. The Nguyen et al. study concludes by determining the overall land suitability class of the proposed land use according to the classification of the performance indices of the land’s aptitude, impact, and feasibility. A number of research papers have used the GIS-based MCDA approach for site selection and a suitability assessment of renewable energy production.
For solar energy production, Sánchez-Lozano et al. (2013) based their study on the combination of GIS and MCDM methods to evaluate the optimal location and placing of photovoltaic solar power plants in the area of Cartagena, Spain. Wanderer and Herle (2015) carried out a similar study using a web-based Spatial Decision Support System based on MCDA. These locations were used as input data to set the development scenario for a subsequent study using integrated Environmental Impact Assessment. The criteria identified in GIS-based MCDA involved technical aspects, including direct normal irradiation (DNI), slope, and population density as well as economic aspects including proximity to a street network, the electric grid, and land cover. In the Karapinar region of Konya, in Turkey, Uyan, (2013) used GIS and the analytic hierarchy process (AHP) for the site selection of solar farms.
The GIS-based MCDA approach has also been used to assess the suitability of sites for wind farms (Atici et al. 2015). Grassi et al. (2014) performed a GIS based assessment of the wake effect of onshore wind farms on energy production. Sliz-Szkliniarz and Vogt (2011) presented a GIS-based approach to evaluate the potential for wind energy in a study area in Poland. Ramachandra and Shruthi (2005) discussed GIS mapping for wind energy potential in Karnataka in India. Other studies used the same method for hybrid forms of renewable energy production (Watson & Hudson 2015). Yeo and Yee (2014) used an integration of an environment and energy geographical information system (E-GIS) database (DB) and an Artificial Neural Network (ANN) to propose a site location-planning model applicable to environmentally friendly urban energy supply plants. Aydin et
169 | P a g e al. (2013) have also used a research methodology based on using GIS-based site selection for hybrid renewable energy production systems. Their study assessed the environmental and economic aspects of viable locations through a fuzzy decision-making procedure using an algorithm based on ordered weighted averaging for multiple objectives. Moreover, Yue and Yang (2007) integrated cost and returns on investments analyses, as well as legal incentives for potential evaluation to develop a decision support system with the aid of a geographic information system (GIS). The research carried by Greene et al. (2010) targeted investing in MCDA to provide background for GIS users, analysts and researchers to allow for more accessibility to decision makers.
This review of earlier studies indicates that the current research arena for using a GIS system in the urban development field is by integrating it with various types of multi-criteria decision-making analysis such as the Analytic Hierarchy Process (AHP) and fuzzy logic. The research methods adopted in these research studies start by defining the study area and use data input in the form of renewable energy potentials and constraints with a predefined ordered weighted average. Some studies take into consideration the weighted average of an environmental qualification of alternative inputs; others include economically feasible locations as well. Thereafter, the data output from overlay analysis are standardized using fuzzy logic or analysed using the AHP process. This allows for multi criteria analysis using the GIS system to determine optimum spatial locations for feasible renewable energy production.
1.3. THE USE OF GIS IN THE MIDDLE EAST& NORTH AFRICA
There has been valuable research in the Middle East and North Africa. Broesamle et al. (2001) discussed the assessment of the production of solar electricity in North Africa based on the integration of satellite data and GIS. In 2010, a research project for wind farm analysis integrated with GIS site selection support in Egypt was funded by the STDF (STDF, 2011). Zoghi et al. (2015) used the fuzzy logic model and weighted linear combination method to optimize the solar site selection process in arid and semi-arid regions, illustrated by a case study of Isfahan, in Iran. Tsikalakiset al. (2011) reviewed the best examples of the application of solar electricity resources in particular counties in the Middle East and North Africa (MENA) region. Mustafa and Mohamed (2012) analysed the integration of photo voltaic panels on building rooftops in the Dokki District in Cairo, Egypt, using a GIS application. Effat (2013) used the SRTM and Multi Criteria Analysis to discuss the site selection of solar energy farms in the Ismailia Governorate in Egypt. Later, she used an integration of both Remote Sensing and the Geographic Information System to discuss the spatial modelling of possible zones for wind farms in the Red
170 | P a g e
Sea area, Egypt (Effat 2014). Mentis et al. (2015) have used a GIS-based approach to assess the technical aspects of the potential of wind energy in Africa.
This review of the literature reveals a knowledge gap that this research attempts to fill, by exploring the potential for renewable energy in Egypt. Accordingly, this study aims to identify renewable energy sources in the Sinai Peninsula as a case application, with a view to building up a site analysis system for renewable energy allocation; it will use GIS with the help of an accumulative co-relation matrix between different development sectors and areas of potential and constraints.
2. METHODOLOGY
This research adopts a multi strategy mixed approach design, using GIS as a multi-criteria decision making tool. The selected methods comprise a set of organized categories of substantial amounts of qualitative and quantitative data. Sinai was chosen as the location for the application of the methodology used in this study. A set of data analysis processes developed after Robson (2011) in three phases was applied as follows:
1. Data reduction: where we summarized a set of quantitative (maps, statistics) and qualitative data (information on the potential and constraints in the study area) using statistical descriptive, and thematic analysis methods.
2. Data display design: where we used maps, charts, tables and matrices for regional, climate, topographic, landscape, geological, hydrological, eco-system, habitats, demographic, socio-economic, infra-structure, services, and land-use datasets, imported in a single geodatabase.
3. Data overlay: where maps were overlaid inside the geodatabase in a one
feature class to illustrate the multi criteria decision making query phase.
2.1 CASE STUDY BACKGROUND
Sinai is considered the heart of the world due to its central location between Africa, Asia, and Europe; it is distinguished by the presence of the Suez Canal, that is generally accepted as the shortest link between these continents. This is why this study has chosen Sinai as the pilot area in which to apply the research methodology. Due to political and governmental constraints, only one sector of Sinai is applicable for development: this is the triangular Peninsula of about 60,000 km2 located at 29.5000° N, 34.0000° E (figure 2). To the north, Sinai overlooks the Mediterranean;
171 | P a g e to the south, it overlooks the Red Sea. It is the only part of Egypt located in Asia. Accordingly, this gives Sinai the opportunity to be the central focal point between the three continents. Administratively Sinai Peninsula is divided into two governorates (North Sinai and South Sinai). Its total population is about 500,000 inhabitants (CAMPAS, 2016). The area is rich in natural resources, such as manganese, marble, steel, white sand, clay, etc. The average solar irradiation for the region ranges between 6 KWh/m2/day to 6.4 KWh/m2/day; the average wind speed ranges between 6-8 m/s with slope greater than 11.3 degrees. Hence, the area has great potential for renewable energy production, and particularly solar and wind, compared to other regions in Egypt.
Figure 2: Sinai map retrieved from arc info 10.1
According to Egypt’s Vision 2030 (see above), forward looking planning should henceforth adopt a sustainable development approach. The Sinai area is of significant importance nationally, regionally and internationally because of the spine of the Suez Canal bisecting the area, which is considered to be the most important linear development across Africa and Asia. It is also the shortest artificial sea-level waterway in Egypt, connecting the Mediterranean and Red seas. The existence of current national development plans for the area, such as the New Suez Canal project, is expected to create an urban flux for the whole nation. This allows this study to be considered within the Egyptian national plan because the strategic
172 | P a g e
location of Sinai offers, additionally, the potential for the export of renewable energy.
2.2 THE MULTI-STRATEGY DESIGN MIXED APPROACH
This study used ArcMap 10.1 to process and analyse the qualitative and quantitative data. The ArcMap system is capable of applying the large number of orders that are associated with MCDM. The data used for this study were categorized into potentials and constraints for renewable energy production, according to the suitability of the location. An Excel matrix was adopted to create the quires to be used in GIS to determine the land areas suitable for wind and solar farm development. This coloration matrix uses binary code values to define the suitability for renewable energy production (wind, solar) according to the contextual conditions and design specifications. The binary codes indicate the suitability of land for renewable energy production (Code=1) or not (Code=0). The matrix is designed to be flexible in order to allow the addition of various activity types and design constraints.
2.2.1. DATA ANALYSIS PROCESS
The practical part of this study began by collecting all the qualitative and quantitative data for the area of study through three consequent phases as follows:
Data reduction
The data was inserted into the Arch GIS according to the (WGS 1984 UTM Zone 36N) coordinate system. It was exported to the GIS in a single geodatabase that was systematically and logically divided into structured datasets, each containing GIS feature classes. The database was populated either by ‘Shapefile Conversion’ or ‘CAD’ into their corresponding datasets, or by vectoring the maps using Arc map editing; finally the required fields were added and the data populated.
Data display design
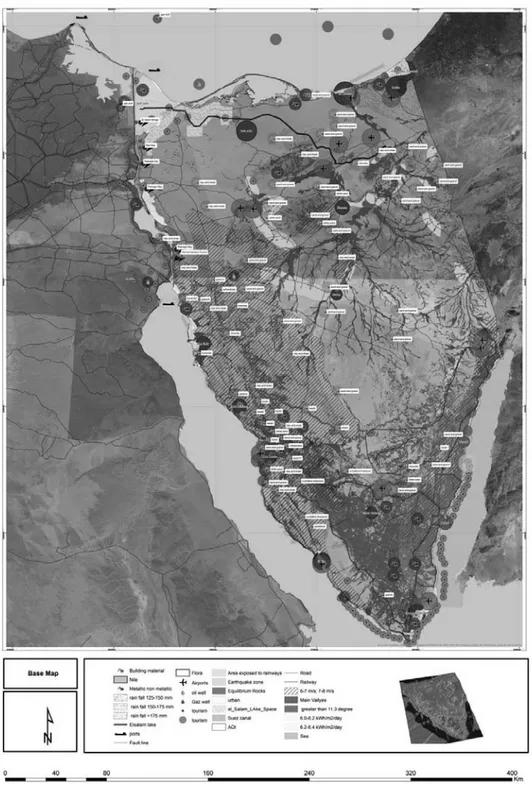
The database consists of a single Geodatabase that contains eleven feature datasets (see figure 3), which are categorized into the following categories: region, climate, topography & landscape, geology, hydrology, eco-system & habitats, demography, socio-economic, infra-structure, services, and land-use. Each dataset contains a number of feature classes that hold the same theme as the dataset.
173 | P a g e
Figure 3: Feature datasets used for creating the geodatabase
The imported feature classes in each regional dataset contain national level data such as government borders, regional roads, regional railways, Egypt’s either natural or manmade borders, and political national agreements. The rest of the feature datasets hold specific data for the Sinai region. Starting with the climatic dataset, this holds data of peak seasonal changes in the months of January and July for the following points: wind speed, direction and intensity, annual solar radiation, cloud cover, maximum and minimum temperatures, rainfall, and humidity. This is followed by the topographical and landscapes dataset that holds data for the following points: contours, robbers, railways, and slopes. For the geological dataset, the prevailing lithology, major fault lines, locations vulnerable to earthquakes, potential building materials, metallic and non-metallic materials, and ground water and rocks formation data were imported.
A different type of specific feature class was imported into each set. For example, the hydrological dataset includes surface water and ground water extraction, chemical ground water classification, dams and weirs, and areas vulnerable to flood risk. The ecosystem and habitats dataset hold data for the location of natural habitats and conservation areas. The infrastructure dataset comprises Sinai utilities e.g. roads, railways, ports, marinas, oil gas pipelines, telecommunications, and electricity high voltages lines. The current land use for Sinai imports data on existing urban development, vacant and agriculture land, educational and recreational facilities, and other services.
Two more datasets were created to represent population data. The first holds the demographic characteristics and trends dataset with feature classes for population size, and population density. The second feature class holds the socio-economic and trends datasets, which contain data concerning the allocation of the labour force and economic activities. Figure 4 shows the Sinai base map, to clarify the data just listed.
174 | P a g e
Figure 4: Sinai base map
Data overlay
In this phase, the preparation of the database required converting all the feature classes into polygon feature classes, using the buffer command in GIS which
175 | P a g e represents the range of services or vulnerable risk areas due to the presence of this feature class. Integrated analysis could be created from the overlay technique, which is used to combine common scale of different vector. Specific urban development could be identified through the overlay models. The overlay technique often requires the analysis of the different elements that represent the potential or constraints of an area of interest. For example, choosing the site for renewable energy production means assessing several factors, including land use, climate, slope, land geology and hydrogeology, etc. The map in figure 5 shows the overlay map for Sinai. Allocating different activities to its appropriate locations using the database and coloration matrix, was achieved by relating the database to the coloration matrix using attribute queries in GIS. Concluding the activities allocation alternatives according to varying priorities for each activity until the appropriate locations for each activity was finally determined.
176 | P a g e
3. Results & Discussion
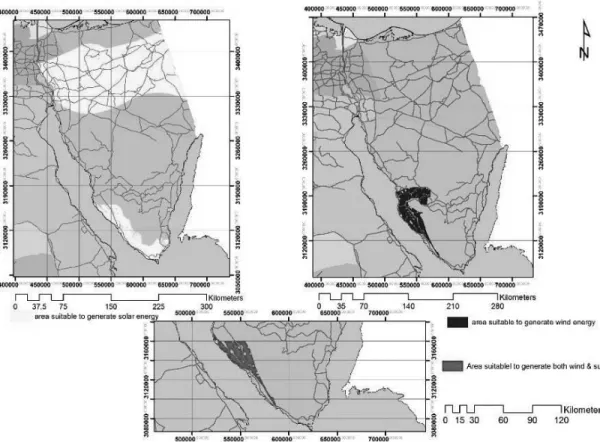
After combining both the matrix and the GIS overlay the results were retrieved from the GIS database. As shown in figure 6, the overlay of all feature classes shows that 36% (22446.2 km2) of the area is suitable for developing solar farms and only 4% (2532 km2) for wind farms; 2% (1268.1km2) of the total area has the potential to be developed for either solar or wind farms.
Figure 6 Potential locations for wind and solar energy
Sinai has the potential to fulfil the criteria for land suitable for solar energy. Starting with the annual mean for the sunshine duration in Sinai, the sun path analysis indicates that the sun rises from 10 to 11 hours daily in 53% of the total area, while it rises from 9 to 10 hours daily in the rest. The average solar radiation in summer is 20.7% over the total Sinai area; it is pronounced in the north, where it is characterized by 7.5-8 kWh/ m2 day; the solar radiation destruction for the rest of the area is 8-8.5 kWh/ m2 day. In winter, the solar radiation in 10.5 % of the total area in the north is from 2.5-3 kWh m2 day, and in the rest from 3-4 kWh m2 day. A percentage of 79.1% of the total area of Sinai has the potential for wind power generation because the annual mean hours within the wind speed ranges from 100
177 | P a g e to 500 hours. In the middle part of Sinai, which represents 18.9% of the total area, the wind speed ranges from 10 to 50 hours; in the rest of the area it ranges from 100 to 500 hours. 71% of the land the wind speed ranges from 0 to 6 m/s, and the rest of the area ranges the wind speed ranges from 6 to 8 m/s.
Constraints that excluded parts of Sinai Peninsula lands from solar and wind energy generation included land exposed to rain ways, earthquake zones, equilibrium rocks, gas well buffers, metallic buffers, building materials buffers, water well buffers, steep slopes, conservation land, and land in current use. Table 1 shows wind speeds and annual mean hours of sunshine, listed by area size. All the listed constraints are the same for both wind and solar farms other than steep slopes, which are suitable for the development of wind farms only.
Table (1) Wind speed and annual hours of sunshine
Annual mean number of
hours Wind speed (m/s) Area (km2)
10 to 100 0 -5 6478 5 -6 32878.5 6 -8 14261.2 100 to 300 0 -5 609.7 5 -6 2213.3 6 -8 2191.3 300 to 750 0 -5 51.2 5 -6 1131.6 6 -8 914.3
According to CAMPAS (2016), in 2014 the total population in Egypt was 87 million people, who used 143,585 million.kw/year. Therefore, the average energy consumption per person is 1840kw/year. Based on the findings in this study, one-meter square with average solar intensity 6.4 kWh/m2/day can produce up to
3,000 kWh m2/annum and 1.5 MW/annum for turbines with an average 660 kW
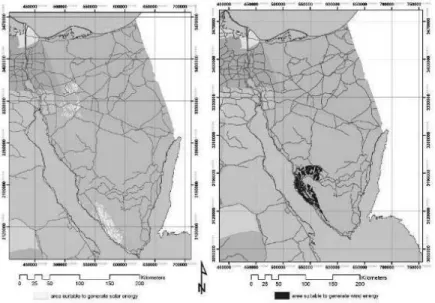
speed. Accordingly, an area of 22,446 km2 can produce up to 67.6 million MWh/year. As laid down by the Camp David Accords, there are areas in which development is prohibited, which reduces the calculated area to 10,933.6 km2 with the potential for solar energy production, which could produce up to 32 million
178 | P a g e
MWh/year. An area of 2,099.4 km2 has the potential for wind energy production capable of producing 3310.6 MW/annum, (see figure 7).
Figure 7 Areas suitable for wind or solar production, allowing for the current international political restrictions
An exercise querying the created database established that 73% of this area is suitable for other types of economic development: urban development, agriculture, industry, and the tourism and residential sectors. To summarize, the final available suitable net area for solar farms is 2,934.7 km2, which can produce up to 8.8 million MWh/year; the figure for wind farms is 158.2 km2, which can produce up to 249.4 MWh/year (see figure 8).
179 | P a g e
4. Proposed alternatives for renewable energy in Sinai
Based on annual population growth rates in Egypt of 2.4%, the population is expected to reach up to 100 million by 2020. Aligned with Vision 2030 mandates, the Egyptian government plans to increase power production from renewable energy by 20% and gradually completely remove the current subsidy on the supply of electricity. Based on the current figures, that the individual consumes 1.840 MW/year, it is expected that the need by 2020 will reach up to 1.8 million MW/year. According to Bryden et al. (2013), projected renewable energy power generation by 2020 is 8,520 MW but actual production up to 2012 is only 585 MW according to RCREEE (2013). The targeted production has a large gap to bridge, between consumer need and the government development plans. The average cost of kWh for conventional electricity production is estimated to be 55 Egyptian piasters (PT) by 2019. The current actual cost of kWh for renewable electricity production (solar and wind) is also 55 PT. With the advance in renewable technology and despite the removal of local subsidies on electricity, it is expected that the price of renewables will be lower than that of conventional fossil fuels. This possibility opens up further opportunities for investment in renewables and a greater potential for the export of clean energy to Europe in competition with the international prices.
5. Conclusion
Due to the current environmental crises, dependence on the traditional ways of generating energy cannot last much longer; there is no other way to satisfy our energy needs than to invest in renewables. In this study, we have detailed a methodological approach that serves as a decision-making support tool, using GIS as a multi-criteria decision program. This tool offers a feasible means of assisting planners and policy makers to take proper decisions related to the selection of a suitable context for the development of renewable energy. The method allows the choice of optimum locations for each type of renewable energy source, without obstructing other development plans or impinging on the suitability of the land for other activities. Moreover, the study can guide the government in setting goals or in siting renewable investments in the locations most likely to achieve maximum power production. This can smooth the way to starting other development projects based on the availability of green and clean renewable sources alongside the likely future urban densification in the Sinai Peninsula and other remote desert areas in Egypt. The methodology is sufficiently flexible to be applicable in other zones in Egypt and on a wider scale in the Middle East region.
180 | P a g e
6. References
Akella, A.K., Saini, R.P. & Sharma, M.P., 2009. Social, economical and environmental impacts of renewable energy systems. Renewable Energy, 34(2), pp.390–396.
Atici, K.B. et al., 2015. A GIS-based Multiple Criteria Decision Analysis approach for wind power plant site selection. Utilities Policy, 37, pp.86–96.
Aydin, N.Y., Kentel, E. & Sebnem Duzgun, H., 2013. GIS-based site selection methodology for hybrid renewable energy systems: A case study from western Turkey. Energy Conversion and
Management, 70, pp.90–106. Available at:
http://www.sciencedirect.com/science/article/pii/S0196890413000848 [Accessed September 17, 2015].
Broesamle, H. et al., 2001. Assessment of solar electricity potentials in North Africa based on satellite data and a geographic information system. Solar Energy, 70(1), pp.1–12.
CAPMAS, 2016. Demographic and social statistics 2016. Cent. Agency Public Mobilization Stat. URL http://www.capmas.gov.eg
Cristea, C. & Jocea, A.F., 2016. GIS Application for Wind Energy. Energy Procedia, 85(November 2015), pp.132–140.
Dabaieh, M., Makhlouf, N.N. & Hosny, O.M., 2016. Roof top PV retrofitting: A rehabilitation assessment towards nearly zero energy buildings in remote off-grid vernacular settlements in Egypt. Solar Energy, 123, pp.160–173.
Dincer, I., 2000. Renewable energy and sustainable development: a crucial review. Renewable and Sustainable Energy Reviews, 4(2), pp.157–175.
Dragićević, S., Lai, T. & Balram, S., 2015. GIS-based multicriteria evaluation with multiscale analysis to characterize urban landslide susceptibility in data-scarce environments. Habitat International, 45, pp.114–125.
Effat, H., 2014. Spatial modeling of optimum zones for wind farms using remote sensing and geographic information system, application in the Red Sea, Egypt. Journal of Geographic Information System, (6), pp.358–374.
181 | P a g e Effat, H.A., 2013. Selection of Potential Sites for Solar Energy Farms in Ismailia Governorate,
Egypt using SRTM and Multicriteria Analysis. International Journal of Advanced Remote Sensing and GIS, 2(1), pp.205–220.
Esri, A., Paper, W., 1998. ESRI Shapefile Technical Description. Comput. Stat. 16, 370–371. Georgy, R.Y. & Soliman, A.T., 2007. Mediterranean and National Strategies for Sustainable
Development Priority Field of Action 2: Energy and Climate Change Energy Efficiency and Renewable Energy Egypt - National study. Sophia Antipolis.
Grassi, S., Junghans, S. & Raubal, M., 2014. Assessment of the wake effect on the energy production of onshore wind farms using GIS. Applied Energy, 136, pp.827–837.
Greene, R. et al., 2010. An approach to GIS-based multiple criteria decision analysis that integrates exploration and evaluation phases: case study in a forest-dominated landscape. Forest Ecology and Management, 260(12), pp.2102–2114.
IRENA, 2015. IRENA Renewable Energy Capacity Statistics 2015,
Malczewski, J., 2006. GIS-Based Multicriteria Decision Analysis - A Survey of the Literature. International Journal of Geographical Information Science, 20(7), pp.703–726.
Meng, Y., Malczewski, J., 2015. A GIS-based multicriteria decision making approach for evaluating accessibility to public parks in Calgary, Alberta. J. Stud. Res. Hum. Geogr. 9, 6587.
Mentis, D. et al., 2015. Assessing the technical wind energy potential in Africa a GIS-based approach. Renewable Energy, 83, pp.110–125.
Mustafa, E.-S. & Mohamed, A., 2012. Development of a photo voltaic building rooftop integration analysis tool for GIS for Dokki District, Cairo, Egypt. LUMA-GIS.
Nguyen, T.T. et al., 2015. Design of a GIS and multi-criteria based land evaluation procedure for sustainable land-use planning at the regional level. Agriculture, Ecosystems & Environment, (200), pp.1–11.
Phuangpornpitak, N. & Katejanekarn, T., 2016. Suitability Analysis for Implementing a Renewable Energy Powered Water Purification System. Energy Procedia, 89, pp.55–68.
182 | P a g e
Pohekar, S.D. & Ramachandran, M., 2004. Application of multi-criteria decision making to sustainable energy planning - A review. Renewable and Sustainable Energy Reviews, 8(4), pp.365–381.
Ramachandra, T.V. & Shruthi, B.V., 2005. Wind energy potential mapping in Karnataka, India, using GIS. Energy Conversion and Management, 46(9-10), pp.1561–1578.
RCREEE, 2013. Annual Report 2013. RCREEE , Annual Report 2013.
Bryden, J., Riahi, L., Zissler, R., 2013. Renewables Status Report MENA 2013 MENA Renewables Status Report. Renew. Power Gener. Costs 21.
Robson, C., 2011. Real world research: a resource for Users of Social Research Methods in Applied Settings,
Sánchez-Lozano et al., 2013. Geographical Information Systems (GIS) and Multi-Criteria Decision Making (MCDM) methods for the evaluation of solar farms locations: Case study in south-eastern Spain. Renewable and Sustainable Energy Reviews, 24, pp.544–556.
Sliz-Szkliniarz, B. & Vogt, J., 2011. GIS-based approach for the evaluation of wind energy potential: A case study for the Kujawsko–Pomorskie Voivodeship. Renewable and Sustainable Energy Reviews, 15(3), pp.1696–1707.
STDF, Science and Technology Development Fund (STDF) Egyptian Wind Farm Analysis Integrated with GIS Site Selection Support. 2011.
Temiz, N. & Tecim, V., 2009. The use of GIS and multi-criteria decision-making as a decision tool in forestry. OR Insight, 22(2), pp.105–123.
Tsikalakis, A. et al., 2011. Review of best practices of solar electricity resources applications in selected Middle East and North Africa (MENA) countries. Renewable and Sustainable Energy Reviews, 15(6), pp.2838–2849.
Uyan, M., 2013. GIS-based solar farms site selection using analytic hierarchy process (AHP) in Karapinar region, Konya/Turkey. Renewable and Sustainable Energy Reviews, 28, pp.11–17. Wanderer, T. & Herle, S., 2015. Creating a spatial multi-criteria decision support system for energy related integrated environmental impact assessment. Environmental Impact Assessment Review, 52, pp.2–8.
183 | P a g e Watson, J.J.W. & Hudson, M.D., 2015. Regional Scale wind farm and solar farm suitability
assessment using GIS-assisted multi-criteria evaluation. Landscape and Urban Planning, 138, pp.20–31.
Xu, D.-L., 2012. An introduction and survey of the evidential reasoning approach for multiple criteria decision analysis. Ann. Oper. Res. 195, 163–187.
Yeo, I.A. & Yee, J.J., 2014. A proposal for a site location planning model of environmentally friendly urban energy supply plants using an environment and energy geographical information system (E-GIS) database (DB) and an artificial neural network (ANN). Applied Energy, 119, pp.99–117.
Yue, C.D. & Yang, G.G.L., 2007. Decision support system for exploiting local renewable energy sources: A case study of the Chigu area of southwestern Taiwan. Energy Policy, 35(1), pp.383–394.
Zoghi, M. et al., 2015. Optimization solar site selection by fuzzy logic model and weighted linear combination method in arid and semi-arid region: A case study Isfahan-IRAN. Renewable and Sustainable Energy Reviews, pp.1–11.