CHALMERS UNIVERSITY OF TECHNOLOGY
Gothenburg, Sweden 2018
Department of Water Environment Technology
An improvement of the water situation
at Rukole Primary School in Tanzania
How to purify water that does not exist
Bachelor thesis within drinking water engineering
EMELIE ANDERSSON
ELLEN SVÄRD
Bachelor thesis ACEX10-18-80
An improvement of the water situation at Rukole Primary
School in Tanzania
How to purify water that does not exist
Bachelor thesis within civil engineering
EMELIE ANDERSSON
ELLEN SVÄRD
EBBA ÖSTBERG
Department of Water Environment Technology
CHALMERS UNIVERSITY OF TECHNOLOGY
An improvement of the water situation at Rukole Primary School in Tanzania
How to purify water that does not exist
EMELIE ANDERSSON
ELLEN SVÄRD
EBBA ÖSTBERG
© EMELIE ANDERSSON, ELLEN SVÄRD, EBBA ÖSTBERG 2018.
Bachelor thesis ACEX10-18-80 / Department of Water Environment Technology
Chalmers University of Technology 2018
Chalmers University of Technology
SE-412 96 Gothenburg
Sweden
Telephone + 46 (0)31-772 1000
Cover: [Some of the students at Rukole Primary School]
[Chalmers reproservice/ Department of Water Environment Technology]
Gothenburg, Sweden 2018
i
Preword
This bachelor thesis comprises 15hp and is the termination of the first three years at the civil engineering program at Chalmers University of Technology. The project is a collaboration between the project group, Engineers Without Borders Sweden, Mavuno Project in Tanzania and Norconsult AB in an effort to improve the water situation in Karagwe. It is an evidence for the project grout that civil engineering can make a difference in rural areas by helping people help themselves. If nothing else is mentioned all rights to figures and tables in this report belong to the authors.
The field study wouldn’t have been possible without scholarships from SIDA, ÅFORSK and the fund of Torsten Jansson. In addition, the construction of a new rainwater tank wouldn’t have taken place if it weren’t for the sponsors JVAB, NightTech and all those who contributed through swish and baking sales. Above financial support, there are several persons which have been important in this project and deserves recognition for their work.
Marianne Grauers, volunteer at Engineers Without Borders, for your warm welcoming when arriving in Tanzania and for helping with all technicalities regarding finance as well as construction of a new tank and for following up the project when the project group had left.
Debora Falk and Emma Keskitalo- Nilsson at Norconsult who contributed with knowledge and support in water, sanitation and hygiene matters. Thank you for always answering phone calls and messages when needed and for supplying with necessary material during the field study.
Supervisor Thomas Petterson at Chalmers University of Technology. For your encouraging attitude towards the project and for your tutoring in risk assessments.
As well as that, all teachers and students at Rukole Primary School for treating the project group as dear guests t. For their endless joy, laughter and dance during the entire stay and for their assistance in trying to improve their water quality.
Gothenburg, May 2018
EMELIE ANDERSSON
ELLEN SVÄRD
ii
An improvement of the water situation at Rukole Primary School in Tanzania
How to purify water that does not exist
Bachelor thesis within civil engineering
EMELIE ANDERSSON
ELLEN SVÄRD
EBBA ÖSTBERG
Department of Water Environment Technology
Chalmers University of Technology
Abstract
Clean and safe drinking water is a necessary resource and a human right. Safety and accessibility of it is today a major problem worldwide since 1.5 billion people have low or limited access to drinking water. The lack of technical solutions and sufficient capital causes millions of people to die each year as a result water scarcity.
In this study, the water situation at the primary school in Rukole village, in Karagwe district, northern Tanzania has been studied. The installed tanks of that time, with purpose to collect water from local rooftops where old and defective. The quality of the water was poor and the quantity minimum. This is one of the reasons why over 400 students are ill every day and three students have passed away in two months. Therefore, it is important to investigate how the water situation at Rukole Primary School can be improved, both in view of the microbial quality of the water and its quality to improve their health. The purpose was to identify the worst dangers of the water system and to assign and propose the measures that improve the drinking water situation the most. In addition, the work also includes implementation of the most suitable and sustainable solutions for the school.
To identify the most urgent risks at the school, a risk assessment was made.For the quality, the worst risk identified was contamination of feces reaching the drinking water, and for the quantity, the worst risk was identified as the number of students is too high compared to the size of the water tanks. Further, a multi-criteria decision analysis was done with respect to availability, trust in the solution, cost and risk reduction, this to find the most appropriate and sustainable solutions to reduce the risks. The result of the analysis showed that the construction of a new rainwater tank and boiling were the most suitable technical solutions for the school. In addition, the analysis showed that trust in technical solutions increased in combination with education, therefore, education is an important part of the results.
The study included the construction of new rainwater tank, its financing, planning and project management before construction start. The goal of the collection was achieved thanks to donations from companies and individuals, resulting in a 90 m3 rainwater tank that could provide the school's 1500 students with drinking water. To achieve a sustainable implemented solution, the school and the students were involved in the collection of local material, to make them be aware of their property and thus take responsibility for maintenance.
The study also showed that the knowledge about water management and hygiene was insufficient among the students, and this is an issue essential for improving water quality. Therefore, education about water management and hygiene was implemented, focusing on the technical solutions, something that the multi-criteria decision analysis confirmed. The education was always carried out by the teachers at the school, to achieve a sustainable solution by continuing the education even after the project team left.
iii
En förbättring av vattensituationen på grundskolan i Rukole, Tanzania
Att rena vatten som inte finns
Kandidatuppsats inom Samhällsbyggnadsteknik
EMELIE ANDERSSON
ELLEN SVÄRD
EBBA ÖSTBERG
Institutionen för Vatten Miljö Teknik
Chalmers Tekniska Högskola
Sammanfattning
Rent och säkert dricksvattens är en nödvändig resurs och en mänsklig rättighet. Säkerheten och tillgängligheten är idag ett stort problem världen över, då 1,5 miljarder människor har låg eller begränsad tillgång till dricksvatten. Bristen på tekniska lösningar och kapital gör att miljoner
människor dör varje år som en följd av brist på rent dricksvatten. I denna studie har vattensituationen på grundskolan i Rukole, i norra Tanzania, studerats. Skolan använde två gamla defekta tankar för att samla upp regnvatten från närliggande tak, kvalitén på vattnet var låg och den lilla mängd vatten som fanns var långt ifrån tillräcklig. Detta är en av orsakerna till att över 400 elever är sjuka varje dag och att tre elever har avlidit under två månaders tid. Av dessa anledningar är det av yttersta vikt att undersöka hur skolans vattensituation kan förbättras.
I denna rapport undersöktes möjligheterna att förbättra dricksvattensituationen, både med avseende på vattnets mikrobiella kvalitet och dess kvantitet, på grundskolan för att främja elevernas hälsa. Syftet var att identifiera de värsta farorna för vattensystemet samt att utse och föreslå de åtgärder som förbättrar dricksvattensituationen mest.
För att fastställa de värsta farorna gjordes en riskbedömning på vattensystemet. Den värsta identifierade risken med avseende på kvalitet bestämdes till att fekalier når dricksvattnet, och den värsta med avseende på kvantitet bestämdes till att vattentankarnas storlek är otillräckliga jämfört med antalet elever. För att bestämma vilken åtgärd som krävdes för att eliminera dessa, gjordes en
riskhanteringsanalys med avseende på tillgänglighet, tillit till lösning, kostnad samt riskreduktion, Resultatet av analysen visade att byggnation av ny regnvattentank och kokning var de mest lämpade tekniska lösningarna för skolan. Dessutom visade analysen att tilliten till de tekniska lösningarna ökade i kombination med utbildning, därför är utbildning en viktig del av resultatet.
Studien innefattade byggnation av en ny regnvattentank samt dess finansiering, planering och projektledning innan byggstart. Insamlingens mål uppnåddes genom donationer från företag och privatpersoner och resulterade i att en 90 m3 regnvattentank kunde byggas i syfte att förse skolans 1500 elever med dricksvatten. För att uppnå en hållbar implementerad lösning involverades skolan och eleverna i insamlingen av lokalt material, i syfte att de skulle känna ansvar över sin egendom och därmed ta ansvar för underhåll.
I studien visades även att kunskapen om vattenhantering och hygien var bristfällig bland eleverna och detta är av stor vikt för att kunna förbättra vattenkvalitén. Därför implementerades utbildning om vattenhantering och hygien, med fokus på de tekniska lösningarna multikriteriebeslutsanalysen visade. Utbildningen genomfördes alltid av lärarna, i syfte att uppnå en hållbar lösning genom att utbildningen fortgår även efter projektteamet lämnat.
iv
Acronyms and abbreviations used in text
ALARP As Low As Reasonable Practicable
E.coli Escherichia Coli, family of bacteria living in the intestinal of warm
blooded animals
EHEC Enterohemorrhagic Escherichia coli
EWB Engineers Without Borders
IFRC International Federation of Red Cross and Red Crescent Societies
ISO International Standardisation Organization
LRV log10 reduction value
MCDA Multi-Criteria Decision Analysis
MPN Most Probable Number
NE Swedish National Encyclopaedia
SODIS Solar Water Disinfection
Tank 1 Rain water tank, above ground at Rukole Primary School
Tank 2 Underground tank at Rukole Primary School
TBS Tanzanian Bureau of Standards
UNA United Nations Association
v
Table of Contents
PREWORD ...
i
ABSTRACT ...
ii
SAMMANFATTNING... iii
ACRONYMS AND ABBREVATIONS USED IN TEXT
iv
CONTENT
v
1.INTRODUCTION ...
1
1.1
Background ...
1
1.1.1
Context ...
1
1.2
Aim ...
3
1.3
Limitations of the study ...
3
1.4
Research questions ...
3
2. THEORETICAL BACKGROUND ...
5
2.1 Microbial waterborne diseases in drinking water ...
5
2.1.1 Indicator organism as quality parameter in drinking water ...
5
2.1.2 Coliform bacteria and Escherichia coli as indicator organism for fecal impact ...
6
2.1.3 Enterococci ...
6
2.2
Guidelines for drinking water ...
6
2.2.1.
General guidelines ...
6
2.2.2
Swedish and Tanzanian guidelines for drinking water ...
7
2.3
Risk assessment and risk management on water systems ...
8
2.3.1
Risk analysis ...
9
2.3.2
Risk evaluation...
10
2.3.3
Risk reduction and control ...
10
2.4
Rainwater harvesting ...
11
2.5
Microbiological barriers and treatment steps ...
13
2.5.1
Sand filter ...
13
2.5.2
Ceramic filter and fabric filter ...
15
2.5.3
Chlorination ...
15
2.5.4
Solar UV-light ...
16
2.5.5
Boiling...
17
vi
3.MATERIAL AND METHOD ...
19
3.1
Water quality testing on samples from Rukole...
21
3.2
Risk assessment and risk management of the water system ...
22
3.2.1
Hazards and Hazardous events ...
22
3.2.2
Creating a risk matrix...
23
3.3
Multi-Criteria Decision Analysis ...
25
3.3.1
Risk reduction ...
26
3.3.2
Cost estimate ...
27
3.3.3
Costumer trust for the solutions ...
28
3.3.4
Availability of material for the suggested solutions ...
29
3.3.5
Ranking of the criteria’s in the MCDA ...
30
3.4
Arrangement of education ...
31
4. RESULTS ...
33
4.1
Water quality samples ...
33
4.2
Risk Assessment and risk managment ...
34
4.2.1 Hazardous events with the most urgent risk ...
34
4.2.1 Risk Reduction ...
35
4.3.2 Cost estimation, Availability and Costumer trust ...
38
4.2.2 The most appropriate and sustainable solutions ...
40
4.3 Implementation of solutions ...
40
4.3.1 Education about water, hygiene and sanitation ...
40
4.3.2 Implementation of technical solutions ...
42
5. DISCUSSION ...
43
5.1
Deviations in the field study ...
43
5.2
Difficulties with working in development regions ...
44
5.3
Discussion of risk assessment ...
44
5.3.1 Discussion of the implemented technical solution ...
45
5.4 Education ...
45
5.5 Water quality ...
46
6. CONCLUSION ...
47
6.1
Future projects ...
47
vii
Appendix 1 ...
53
Appendix 2 ...
57
Appendix 3 ...
62
1
1.Introduction
Water is the single most important provision to humans and according to United Nations Association of Sweden (2017) it is also vital in industries and agriculture. At the same time, clean water supply and sanitation is one of the greatest challenges worldwide (Svenskt Vatten, 2013). There are major differences in water use throughout the world, 83% of those who are suffering from water scarcity are living in rural areas and 40% out of these are living in sub-Saharan areas of Africa (UNA Sweden, 2017). For instance, less than 7% of the rural population in Tanzania are using safely managed drinking water services (World Bank, 2015). Karagwe district, a rural area in the northwest part of Tanzania, is one of the districts suffering greatly from water scarcity. In addition to this, the current water sources in the district are of poor quality and the sanitation possibilities are inadequate.
1.1 Background
Approximately 1,5 billion people in the world have access to basic or limited sanitation and water services. Basic services are defined as having access to an improved water source with a round trip of 30 minutes. Limited services indicate that it takes more than 30 minutes to collect water. In addition to that, 580 million people collect water from unprotected wells and springs as well as untreated surface water from lakes, ponds, rivers and streams (World Health Organization, 2017).
According to the WHO (2018), the safety and accessibility of drinking water is a great problem throughout the world and improving access to it can result in enormous health improvements for those who lack drinking water. “To ensure everybody’s access to clean water and sanitation” is number six of the 17 development goals to transform the world by United Nations (n.d.). Theoretically there is enough fresh water to achieve this but because, for example the lack of improved technical solutions and capital, millions of people die every year. Since diseases caused by inadequate water supply often affect children the most, a majority of the deceased are children. (United Nations, n.d.).
1.1.1 Context
The United Republic of Tanzania is approximately twice the size of Sweden with a land area of around 950 000 km2 and a population of 52 million people. According to World Bank (2016), approximately 68% of the population live in the rural areas of Tanzania. The official language is Swahili but beside that, English and around 120 native languages are being spoken (Sveriges Ambassad, 2017a.). The capital of Tanzania used to be Dar es Salaam, but the government recently changed it to Dodoma. The country is divided into several regions, which are subdivided into multiple smaller districts.
Tanzania is predominated by large differences in altitude, which causes a diversity in both climate and vegetation between the different parts of the country. Every year there are two raining periods. During March to May, the long rain season occur, while the short rain season come about during November until December. During these rain seasons, there are greater risks for floods which can lead to closed bridges, affected traffic situations, power outage and earth slip (Sveriges Ambassad, 2017b). Because of global warming the rain seasons are more irregular now than usual.
The most important income for Tanzania is agriculture and the economic growth is relatively high averaging 6-7% a year (Sveriges Ambassad, 2017a). Even though the poverty rate has declined, the absolute number has not decreased. About 47% of the population are currently living below the global poverty line which is 1.90 US dollar a day (World bank, 2011). In addition to that, 12 million or 23% of Tanzanians earn even less, 0.60 USD a day, which classifies as living in extreme poverty. In 2009, the UN International Fund for Agriculture Development gave a supplementary loan for 56 million USD to Tanzania in an effort to improve the financial situation and the low income for the rural farmers (Africa Research Bulletin, 2009). This is one example of how Tanzania benefits from financial aid, but aid doesn’t have to be governmental like this previous case. It can also be separate organisations financing projects or none governmental-organisations in their own interest.
2
Mavuno is one of the non-governmental organisations in Tanzania that receive financial aid and several of their projects are depending on that. The organisation was founded in 1993 by local farmers and their goal is to “Strengthen the ability of the community to identify, manage and control available resources for their sustainable development”. The main intention is to improve the quality of life for the people in Karagwe district (Mavuno, n.d.). Engineers Without Borders is a non-political and religious organization who works with projects in development areas with the same aim as Mavuno. For instance, in 2012, Engineers Without Boarders started a cooperation with Mavuno to improve the constructions of rain water tanks in Karagwe (Swedish Engineers, 2013).
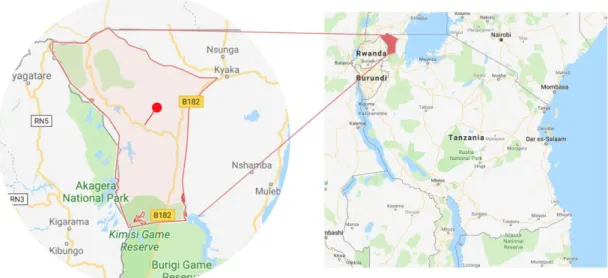
Rukole is a poor village in Karagwe district, in the northwestern parts of Tanzania, see Figure 1. The area is characterized by its topography and vegetation since it is approximately 1600m above sea level. The village is also one of the beneficiaries from Mavuno and has approximately 2000
inhabitants. Because of the topography, it is far to the nearest fresh water source for the farmers and villagers therefore, many households and schools have rain water harvesting tanks to collect drinking and household water. However, this water is not enough for the inhabitants and it is of poor quality. Rukole Primary School, with approximately 1500 students and 18 teachers is one of about 100 schools in Karagwe district in need of improved water sources. The students drink water directly collected from rain water tanks without any treatment.
Figure 1 Map over Tanzania and Karagwe region with Rukole village as a red pin. Map material collected from Google
3
1.2 Aim
The aim of this project is to investigate the possibility to improve the drinking water situation with regard to both quantity and micro-bacterial quality at Rukole Primary School by means of education and technical solutions. The best technical solutions for the school will be presented in this written report. The most appropriate and sustainable solution will be implemented at the school. The handover of the implemented solutions will be performed with the aim that the owners will take responsibility for the solutions.
1.3 Limitations of the study
Earlier projects done by Engineers Without Borders and Mavuno used material for analyzing three types of bacteria, Escherichia Coli, Coliform bacteria along with Enterococci. Since there were already instruments on site purchased for these different bacteria this field study is focusing on the same three. However, there are other bacteria that affect the quality of drinking water that have not been analyzed.
1.4 Research questions
Research questions that are the foundation for the investigation of the on the drinking water situation at Rukole Primary School, both with regard to the microbial quality and quantity:
- Which hazards result in the most emergent risk?
- Which solutions are the most appropriate and sustainable as well as improves the drinking water situation the most?
- Which of the suggested solutions is the most urgent and is in need of implementation during this project?
- How will the transmission of the implemented solutions be formed for the school to feel ownership and will take responsibility of the solution?
5
2. Theoretical background
Prior to the field study a literature study was made in order to be well prepared and informed in the subject of drinking water. This information was combined with knowledge from other projects in developing regions where the aim is water purification as well as quantification. The purpose of the study is also to learn about which bacteria are dangerous to individuals and how they affect the body as well as local and international guidelines for drinking water to avoid negative health aspects.
2.1 Microbial waterborne diseases in drinking water
There are several different microorganisms existing in the human body in a natural way but not all these organisms are harmful, some are necessary (Modin, 2017). Those organisms which causes diseases in some way are called pathogens. Many pathogens are spread through water and people can get exposed to these by drinking contaminated water or swim in it (Moseley, 2014). As well as that, the bacteria can be spread through food which has been irrigated by contaminated water
(Folkhälsomyndigheten, 2016). When it comes to these so-called pathogens, which cause a number of different waterborne diseases, they affect the gastrointestinal tract the most. Even though the
symptoms vary depending on the disease, the most common symptoms are diarrhea, stomach pain, vomiting, nausea and headache (Folkhälsomyndigheten, 2016). Even though diarrhea can be a symptom of other diseases it alone can also be classified as a disease. It is the most widely known disease connected to water and the disease alone takes approximately 842 000 lives every year which could be avoided if the sustainable development goals would be achieved (WHO, 2017). Above that, both the diseases typhoid and cholera are spread as a result of poor or inappropriately managed water and sanitation services, these waterborne diseases can be avoided if a good biological quality has been established (WHO, 2011).
There are great variations in how people react towards different pathogens, in general, if a person is exposed to a certain pathogen for a long time he or she becomes immune (WHO, 2011). However, young, elderly, pregnant women and people with low immune capacity are more vulnerable to pathogens and can therefore be more affected by them.
In order to make an assessment of the microbiological quality of the water different types of bacteria can be analysed. They are called indicator organisms and can indicate fecal impact of the water, however, these indicators are not entirely reliable and should therefore be complemented with risk assessments and continuous evaluation (Svenskt Vatten, 2018). Coliform bacteria and E. coli are both used as indicators. Above this, the bacteria Enterococci are used for the same reason, to indicate fecal impact of the water (Livsmedelsverket, 2017a).
2.1.1 Indicator organism as quality parameter in drinking water
To demonstrate inadequate purification, suspected contamination or other issues regarding drinking water, indicator organisms are used (Svenskt Vatten, 2017). These organisms can indicate, for instance, fecal impact. Both Escherichia coli and Coliforms are what you call indicators, E-coli indicates solemnly fecal contamination while coliforms are more general and can indicate both fecal as well as other contaminations. These parameters recounts something about the biological quality of the water (Modin, 2017). To analyze the indicator organisms, E-coli and coliforms there is one ISO- method that is suitable for all types of water, even if it contains high amount of suspended matter and high background counts heterotrophic bacteria. This standard method is called SS-EN ISO 9308-2:2014 (colilert). The method is based on growth of target organisms, or bacteria, in a liquid medium. After the growth a calculation of the Most Probable Number of organism by reference to specific MPN-tables is carried out (Svenska institutionsstyrelsen 2014).
6
2.1.2 Coliform bacteria and Escherichia coli as indicator organism for fecal impact
Coliform bacteria are a collection name for several different bacteria (Oxfam, 2001) which are
specific for intestinal canals of the human body and in warm blooded animals. They are almost always present in feces and are therefore a good indication that the drinking water is contaminated and that the need for improved purification is necessary. Oxfam (2001) states that 99% or more of the coliform bacteria are E.coli, so a majority of the coliforms are usually E.coli.
E.Coli is a collection name for several strains of gram-negative rod-shaped organisms that normally are found in the lower parts of the intestinalis in all warm blooded species. Most of these are harmless but there are a few pathogens among them (Moseley, 2016) Enterohemorrhagic Escherichia coli is one of the pathogenic sub-groups of E.coli, it manifests itself through abdominal pain and bloody diarrhoea, above this approximately 10% of the cases lead to renal failure as a result of haemolytic-uremic syndrome which can be fatal. Small children and elderly are especially vulnerable for this disease. The characteristics of the Ehec-bacteria is how it binds closely of the cells inside the intestine and produces toxins, so called Shiga Toxins. These toxins survive in acidic environments which protects the bacteria while passing through the gastric secretion. Following strains are also classified as pathogens (Moseley, 2016):
• EIEC- Enteroinvasive Escherichia coli • EPEC- Enteropathogenic Escherichia coli • ETEC- Enterotoxigenic Escherichia coli
2.1.3 Enterococci
Enterococci, like the other two indicator organisms presented above exists naturally in the intestinal of humans and animals (Livsmedelsverket, 2017b). In addition, the bacteria can be found in plants, insects and soil. Enterococci are not as good fecal indicator as total coliforms or e-coli since they can grow far away from contamination sources (Modin, 2017). However, there is evidence that the bacteria can carry specific genes that codes for different diseases. For instance, the specie Enterococcus faecalis can cause urinary infection, bacterial sepsis and cardiac inflammation
(Nationalencyklopedin, n.d). Even though Enterococci can indicate fecal impact on drinking water it is more common to find them within health care, which is one additional reason to why it is not as god as coliforms and E.coli. These bacteria are also more resistant to heat, cold, low pH values salt and dehydration compared to e-coli according to the Livsmedelsverket (2017b), above this they are also resistant to some antibiotics (NE, n.d).
2.2 Guidelines for drinking water
In order to protect public health, national governments and international organisations have created guidelines for drinking water regarding both quality and quantity. The Swedish and Tanzanian guidelines as well as more general guidelines are presented in the following section. These guidelines are recommended since following them, they will reduce hazardous risks to drinking water.
2.2.1. General guidelines
According to WHO (2011) there are no international standards for drinking water quality, however, the organisation establish scientific facts about water on which governments can base their on national standards. This is because the water situation varies throughout the world and that gives each country an opportunity to adapt standards that suits them as well as their current situation. Even though WHO doesn’t create any international standards or regulations, the organisation advocate governments to adapt the national standards according
to minimum requirements. This is to ensure safe water for
all.
7
Table 1 Water intake for ages 4 and older
Svenskt Vatten (2017) says that water is clean and safe if it doesn’t contain any microorganism, parasites or substances in amount or content which can be harmful to a person health. For the bacteria E.coli and Coliforms in all types of drinking water, both treated and untreated, there should be no bacteria at all detected in a sample of 100ml WHO (2011).
As for guidelines regarding quantity of water, a minimum of 15 litres per person and day should be available in emergencies, however, a higher value of 20 litres per person and day is desirable. (WHO, n.d). The amount of solemnly drinking water can vary widely depending on climate, workload and individual but it is normally between 2-16 litres per day. Table 1 shows how the water intake can vary depending on age and gender. The value includes both drinking water, water content of beverages and in food (Food and Nutrition Board, 2004).
According to Oxfam (2001) it is important to consider both quantity and quality when choosing water source. For instance, it is sometimes better to have a larger amount of water with lower quality than having little water of great quality. Moreover, having a larger storage of bad quality water can be better than a lot of small good quality sources when maintaining the system (Oxfam, 2001).
2.2.2 Swedish and Tanzanian guidelines for drinking water
Since drinking water shouldn’t contain any microorganism, parasites or substances in amount or content which can be harmful to a person health there are some guidelines to facilitate the process of achieving this. If there is one single E.coli bacteria or Enterococci found in a sample of 100ml, the water going into distribution is unserviceable. However, if the water is packed, it is considered unserviceable if it is one bacteria in a sample of 250ml. When it comes to Coliform bacteria the tolerable number of bacteria is the same in both samples of 100 and 250ml, 10 bacteria or more and the water is considered unserviceable to people (LIVSFS 2017:2). This information is summarized in Table 2.
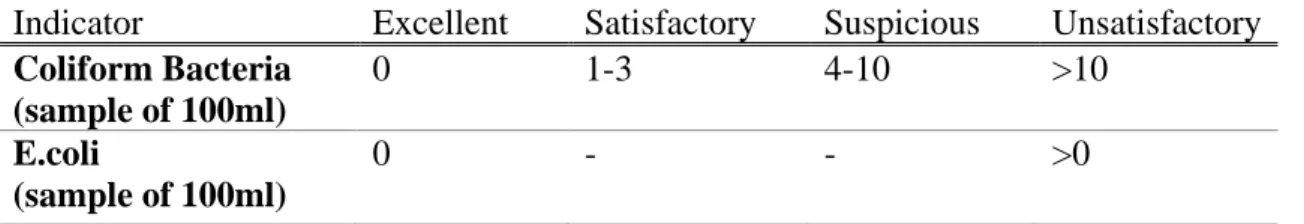
The Tanzanian Bureau of Standards (TZS 789:2003 5.4.2)has agreed on four different categories to define the microbiological quality of water with regard to E.coli and Coliform bacteria. To be classified as excellent the water must be completely free from any coliform bacteria and E.coli. If there are 1-3 Coliform bacteria in the sample of 100ml the water is classified as satisfactory, while it is suspicious if there are 4-10 bacteria. A completely unsatisfactory value for coliforms are more than ten bacteria in a sample of 100ml while it is also unsatisfactory if there are more than zero E.coli bacteria in an equal size sample (TZS 789:2003 5.4.2.). This information is summarized in Table 3.
Gender Age [years] Amount [L/day]
Boys 4-8 1,7 Girls 4-8 1,7 Boys 9-13 2,4 Girls 9-13 2,1 Boys 14-18 3,3 Girls 14-18 2,3 Men 19-70+ 3,7 Women 19-70+ 2,7
8
Table 2 Swedish guidelines for tolerable amounts of coliform bacteria, E.coli and Enterococci in drinking water
Indicator
Drinking water in
distribution
Bottled water
E.coli
Found (in 100ml)
Found (in 250ml)
Intestinal Enterococci
Found (in 100ml)
Found (in 250ml)
Coliform Bacteria
10 (number/250ml)
10 number/250ml)
Table 3 Tanzanian guidelines for amounts of coliform bacteria and E-coli in drinking water
Indicator
Excellent
Satisfactory
Suspicious
Unsatisfactory
Coliform Bacteria
(sample of 100ml)
0
1-3
4-10
>10
E.coli
(sample of 100ml)
0
-
-
>0
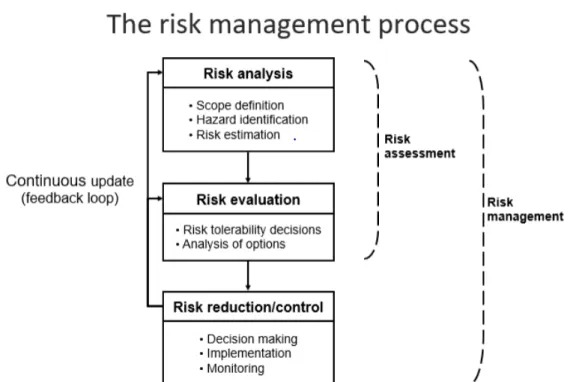
2.3 Risk assessment and risk management on water systems
To make sure that the guidelines are followed, a risk assessment and management can be done according to
Figure
2. This is to identify the risks for one specific water system, as well as find appropriate solutions to eliminate the risk. There are several separate risks or hazards towards a water system which can affect it. According to WHO (2009) a hazard is physical, biological, chemical or radiological agents that can cause harm to public health, while a hazardous event is an event that introduces hazards to, or fails to remove them from the water supply. WHO (2009) gives an example to clear it out “Heavy rainfall (hazardous event) may promote the introduction of microbial pathogens (hazards) into source water”. In order to get a complete picture of the system and how these hazards affect each other one can carry out a risk assessment and create a so-called Risk Matrix (Techneau, 2008). It will help creating a cost-efficient solution to ensure a safe and stable water system. However, it is important to describe the water system as clear as possible first, which will support the process, from the catchment stage to the distribution to the consumer. This should be done on-site in order to have the most lifelike system (WHO, 2009).It is also crucial that the weaknesses of the system are being identified, which hazardous events and hazards are most important in order to take actions towards it (WHO, 2009). When creating a risk assessment, it is necessary to be able to separate hazards from hazardous events and be sure what they mean.
Other information that should be collected before the assessment is relevant water quality standards in the current system as well as if there are any known changes in the quality due to weather and other conditions (WHO, 2009). In addition to this, what source of water is used, documentations of the storage, treatment of water and distribution should be included in the preparation work. In addition, the numbers of users of the water system is also necessary to be able to perform a good risk
assessment (WHO, 2009).
The risk assessment is according to Techneau (2008) divided in to four parts and the fourth part is something that’s going on during the entire process, from risk analysis to risk reduction. This involves getting new information and update during the entire assessment. Moreover, one should analyse sensitivities, develop supporting programmes, document and assure quality along the way. Lastly, the creator should report and communicate, review, approve and audit the assessment in the end. This part is important because during the process things can change, hazards that were important in the
beginning might not be as important in the end or vice versa. The risk assessment must be a living document from the start until the end (Techneau, 2008).
9
Figure 2 Risk assessment and managment illustrated by Techneau (2008). Published with permission.
2.3.1 Risk analysis
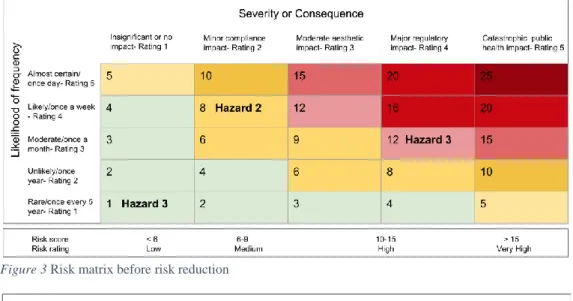
Techneau (2008) says that the first step is the risk analyse, where hazards are being identified and the risks are estimated. These hazards can be identified both on-site and by visual inspection, during desk-studies as well as historic events (WHO, 2009). To describe as many relevant hazards as possible it’s desirable to combine all these methods. It is crucial to define the scope of the matrix as soon as possible in order to limit the risk assessment and only focus on the aim, which is to improve the water system (Techneau, 2008). These hazards can be towards both the quality as well as the quantity of the water. WHO (2009) explains that every risk is connected to one or several hazards and are described with two things. One thing is the possibility for a certain event to occur, for instance it can be a scale from every day to ever year, or one to five times. This is up to the creator of the risk assessment. The second thing is the consequence if the hazard would occur. Also, this grading is up to the creator but according to WHO (2009) usual values are, insignificant, major or catastrophic. However, the most important thing is the potential impact on public health even though there are other factors as well, for instance the climate. The reason for working in this way is because it is easy to decide which hazards are significant and which are not. To do this in a systemically way, it is recommended to draw a table, or a grid, which will be the risk matrix, with possibility on the y-axis and consequence on the x-axis. Moreover, the description of the probability and consequence should be converted to significant figures on either a linear or exponential scale (WHO, 2009). It is a good thing to define the risk matrix-score which will indicate if the risk is significant or not before drawing it. The risk matrix is divided in to three regions where the first, and lowest one is green, which indicate that the risk that occurs in that region is acceptable, the second region means that the risks in that region is, “As Low As Reasonable Practice” (ALARP), and is illustrated with yellow in the risk matrix (Falk and Ohlin, 2015). Risks that are in the yellow region are acceptable if the risk reduction option that will reduce the risk is to expensive. The last and highest region is red and the risk that occurs in that region is unacceptable. The risk matrix is illustrated in Figure 3.
10
2.3.2 Risk evaluation
The second part is the risk evaluation, during this part all risk reductions options are analysed and graded (Techneau, 2008). There is a possibility to perform an Multi Criteria Decision Analyse, in order to include more aspects, for example, cost- estimation, customer trust, environmental effect etc. in the evaluation process. These options are graded among each other based on what the person carrying out the risk assessment believes is the most important. The reason for doing this is according to Techneau (2008) because even if a risk reduction option has great reduction potential it can be too expensive or have a negative effect to the environment. This might result in a risk reduction option or solution which is not suitable for the specific water system in the scope.
2.3.3 Risk reduction and control
The third part is the reduction/control where all final decisions regarding which hazards are the most important to eliminate or reduce. As well as that, it involves deciding which risk reduction option to use to fulfil the aim of improving the water system. The risk matrix value for each risk will hopefully become lower and change position in the matrix like follows in Figure 3 and Figure 4, when
evaluating the reduction (Techneau, 2008). Another important aspect of this final part is the
monitoring, after the risk reduction option has been implemented one need to monitor it to see if it is working as planned.
Figure 3 Risk matrix before risk reduction
11
2.4 Rainwater harvesting
Rainwater harvesting is a common method for collecting drinking and household water when there is water scarcity and lack of other fresh water sources. There are two type of rain water tanks to collect and store water, they are either built above or beneath ground level. Mavuno have built rain water tanks in Karagwe since 1990 (Swedish Engineers, 2013). In the beginning, they only built
underground tanks because they are relatively cheap and easy to construct, seeFigure 6. Later they started to build over ground tank, like Figure 5, but they are harder and more expensive to build. However, because of the pressure from the water it is easy to install a tap in the bottom of the tank. This improves the water quality and the design is safe for children. All the tanks are made of concrete and masonry, some have roof of steel and other have concrete roof, the sizes of the tanks vary
between 20-100m3 (Baraka, 2018-03-20; personal communication).
The catchment area is the area which is used for collecting the water and leading the water into the pipes, normally it is a roof or similar. The size of the needed catchment area can also be calculated with equation based on the Equation 1, where the collected water is calculated through multiply the catchment area with the rain depth in the specific area (Thomas & Martinson, 2007). In tropical areas about 85% of the rain is collected.
𝐶𝑜𝑙𝑙𝑒𝑐𝑡𝑒𝑑 𝑊𝑎𝑡𝑒𝑟 [𝑚3] = 𝐶𝑎𝑡𝑐ℎ𝑚𝑒𝑛𝑡 𝑎𝑟𝑒𝑎 [𝑚2] 𝑥 𝑅𝑎𝑖𝑛 𝑑𝑒𝑝ℎ𝑡 [𝑚] 𝑥 0,85
Equation 1. How to calculate collected water based on rain depth and catchment are
Figure 6 Under ground tank Figure 5 Overground tank
12
(a) (b)
Rain water is relatively free from contaminants except if it has adsorbed contaminations from animals or particles from the surrounding atmosphere or when it has run of hard surfaces, such as roofs etc. WHO (2011). Therefore, the quality of the rainwater can vary a lot during harvesting, storage and household use. Eventual hazards are avoided by keeping catchment areas clean, storage tanks covered, using a treatment method if necessary and proper hygiene at point of use. Moreover, the highest microbial concentrations are found in the first flush of rainwater, thereafter the concentrations decrease. Hence it is recommended that the first flush of the water should be removed before reaching the storage (WHO, 2011). Even though the first flush of water isn’t suitable for drinking it can be used for other purposes. How much water that needs to be flushed away depends partly on the size of the catchment area.
Principles of first flush involves filling a separate container or first flush cistern, and when it is full the water with less impurities can flow to the tank. However, the cistern or tank need to be cleared and emptied before every rain season. In Karagwe district there are two different first flush systems, one is constructed in concrete at the same time as the tank. The second one is made of pipes and can be implemented on existing tanks.
Figure 7
shows the first type, it consists of a cistern with two pipes which are cut and disconnected to each other. The cistern is connected to the tank with these pipes. When the rain starts, the cistern will start to be filled and once completely full, the pipes will rise and connect to each other because of the pressure from the water. When they are connected, the rest of the rain water with less impurities can flow though the pipes and into the storage tank instead of being collected in the first flush-cistern.The second one was built according to
Figure 8
, water flows in to the container trough pipes and when the cistern is full a ball rises to the surface and block the pipe to the cistern. This results in water flowing straight to the storage tank instead. In the bottom of the cistern there is a tap from which the dirty water can be collected and emptied before the newt rain period. Since the system requires some maintenance, there is a risk that it won’t be cared for which will mean that the first water won’t be flushed away and the solution will not be long- term sustainable. However, one positive aspect is that this first flush is cheap variant available for household (Lovell, L, Bjersing, F, Burgren, M,
Börjesson, T, 2017)
13
Figure 8 A first flush system with extern cistern and a floating ball designed by Lovell, Bjersing, Burggren and Börjesson
(2017). Published with permission.
2.5 Microbiological barriers and treatment steps
To ensure that the quality of the water meet standard and regulations Svenskt Vatten (2017) explains that it is desirable to have many microbial barriers since the purpose of water treatment is to reduce the number of microorganism. Moreover, there are different recommendations for barriers depending on the quality of water, if it is surface water or ground water. The principles of microbiological barriers are either to inactivate or separate the microorganisms from the water. Livsmedelsverket advocate that all cleaning facilities for water should have at least one of each type. To decide how many barriers that are necessary, a Microbial Analysis can be done. In Sweden, there are five barriers which have been approved by the Livsmedelsverket (Svenskt Vatten, 2017).
1. Short, artificial infiltration of surface water (> 14 days) 2. Chemical flocculation and coagulation followed by filtration 3. Slow filtration
4. Primary disinfection, for example chlorination and UV-light 5. Membrane filtration (pores smaller than 0.1 micrometres)
2.5.1 Sand filter
There are different types of sand filtration categorized as slow or fast sand filtration. Only the slow filtration is an approved barrier according to Livsmedelsverket (Svenskt Vatten, 2017). Fast sand filter is an easy pre-treatment step that reduce the number of particles and help make the disinfection more effective (International Federation of Red Cross and Red Crescent Societies, 2008). The procedure is to pour water through a container of sand and gravel with an outlet on the bottom, where all the water that comes out have been processed through the different materials. Positives aspect is that the process is fast, effective to remove big particles, insects and germs that cause disease. In addition, a fast sand filter is a cheap alternative comparing to other treatment steps. Negative aspect is that it must be combined with other treatment steps that remove the micro-biological bacteria and improve the water quality better (IFRC, 2008).
14
Slow sand filter is a single treatment step to improve the water quality in a micro-biological, chemical and physical way. Furthermore, a slow sand filter can remove 99% or more of the E.coli population, if it is combined right (Oxfam, 2001), expressed in log10 reduction value, that is 2-6LRV (WHO, 2011). To get a slow sand filter to work properly it need to mature for a period of a few weeks before the slam cover and the micro-biological action is effective. Slow sand filter often is an open-topped box filled with some kind of clean sand and a layer of stones or gravel, which is showed in
Figure 9
. Raw water is put on the top and then sink by gravity, the purification takes place while the water passes the materials. A sand filter produces an active micro-biological layer, which help the purification and the filter can run for several weeks or more without cleaning. However, a slow sand filter needs regular maintenance and follow up and in addition, it takes a long time to treat the water (Oxfam, 2001). In 2016 Gjerstad- Lindgren and Olivecrona performed a field study to help Mavuno choose a treatment method for drinking water, which could be implemented on their tanks. An investigation was made to see the possibilities of water purification on the rain water tanks at a school through a biosand filter. The biosand filter was a smaller version of a conventional slow sand filter and was adapted for household usage (Gjerstad-Lindgren & Olivecrona, 2016).However, the result of the study was not representative for the whole water source because of the great variation in bacteria levels since the tank was often left open and dust was identified on the surface. Buckets used to collect drinking water with were also used for other purposes. Gjerstad-Lindgren and Olivecrona suggested that close hatches on the rainwater tanks, install pump systems and perform education about water, hygiene and sanitation could improve the performance of the biosand filter and the quality of drinking water.
Figure 9 shows how the water gets treated through the layers of sand, which always is covered with water. Contaminated water is poured out on the diffuser plate on the top and continue down through the bio layer, sand of different fractions and lastly through the gravel. Because of the water level in the container the pressure fills up the pipe and the treated water is pushed to the outlet.
15
2.5.2 Ceramic filter and fabric filter
Both ceramic- and fabric filter works according to the same principle, there are pores which the water passes by with physical straining in the material and the particles get stuck in the pores (WHO, 2011). There can be both single and multiple porous surfaces. Pores that are too large, which might be the case with fabric filter, can be a problem because dangerous bacteria can be much smaller and will therefor pass by the fabric and contaminate the water. However, it is a good complement for further treatment steps to remove larger particles and suspended material (WHO, 2011). It is significant to clean the fabric between using it to remove the material (IRC, 2008). Cotton fabric is the most suitable and it should not be transparent in any way.
A ceramic filter works as a container with a hatch. Contaminated water is poured in at the top and collected in the ceramic pot. The water squeezes trough the ceramic pot and the filtered water reach a container with tap which works as an outlet. Different types of filter were analysed as household treatment devices in a survey in South Africa (Mwabi et al., 2011), ceramic filter was one of them. The silver-impregnated porous pot filter was displayed as the best both in reduction of chemical as well as microbial contaminant. The efficiency was as high as 99-100%. Depending on the size of the pores, a ceramic filter can be classified as a microbiological barrier, however the pores need to be smaller than 0.1 micrometre. For a porous ceramic filter the LRV can vary from 2-6 depending on the different properties of the filter while for fabric it is as low as from 1-2, both with regard to bacteria (WHO, 2011). Even though porous filter can be a good treatment step for drinking water one issue is the volume of water that can be treated. In addition, the flow rate decreases over time although the filter is cleaned (Soppe, Heijman, Gensburger, Shantz, van Halem, Kroesbergen, … Smeets,, 2015).
2.5.3 Chlorination
During ultimate conditions chlorine will inactivate all types of bacteria in drinking water, Oxfam (2001) suggests that this is because when chloride is added to water it creates certain compounds which will disturb the chemical processes bacteria need for survival. It is only the so called “Free Available” chloride who kills the bacteria (Oxfam, 2001). After adding the chemical to water it needs time to work, IFRC (2008), explains that it will take at least 30 minutes before the water is drinkable. Furthermore, if the water is very dirty, the water might need to be filtered and twice as much chlorine added to reach the same quality. These 30 minutes are called “contact time” and even though 30 minutes is recommended it can vary depending on other factors, such as pH and heat (Oxfam, 2001). If the water has a higher temperature, the chlorine will have shorter contact time. Furthermore, pH increases, the water becomes more basic and the disinfectant capacity of chlorine will decrease. There are several different forms of chlorine one can use, for instance there are liquids and tablets (WHO, 2011). In addition, even household bleach can be suitable for disinfection if it contains high enough values of hypochlorous acid. Water containing more suspended and organic material will need more chlorine to reach acceptable quality (Oxfam, 2001). However, Falk (2018; personal communication) explains that the combination of organic materials and chlorine can create substances which are carcinogenic. Therefore, it is recommended by WHO to have a turbidity less than one nephelometric turbidity unit (Oxfam, 2001). Furthermore, too much chlorine will make the water taste and smell bad which can lead to people not wanting to drink it. It is important that where chlorine is used as a disinfectant, everyone who uses it is well understood with the risk of handling the chemical and can to handle it safely (IFRC, 2008). Despite these disadvantages, chlorine is a good method to ensure high quality drinking water since it reduces the number of bacteria between 3-6 LRV (WHO 2011).
16
2.5.4 Solar UV-light
Solar Water Disinfection (SODIS), is a method to disinfect drinking water through sunlight. One clear plastic or glass bottle is filled with water and placed in direct sunlight (IFCR, 2008). The principles of it is to combine UV-radiation, oxygen activity together with dissolved oxygen as well as heat (WHO, 2011). Oxfam (2001) explains that to enhance the effect of SODIS half of the bottle can be painted black, the black part will be placed downwards for approximately five hours. However, if the sky is cloudy, IFCR (2008) says that the exposure time need to be the double. Moreover, it is a good thing to centre the exposure to midday in tropical climates because of the suns position during that time. This method will destroy 95 % of the pathogens that can exist in the water (Oxfam, 2001). According to WHO (2011) SODIS has minimum value of 3 LRV and a maximum LRV value of 5+. If the bottle is filled to three-quarters and shaken, the process will go on much faster, after this the rest of the bottle should be filled up and place it in the sun (IFRC, 2008). In addition to this, if the bottle is shaken several times during the exposure, the effect will be even more enhanced.
Figure 10
shows a plastic bottled placed on a reflective corrugated iron sheet, in direct sunlight. The UV Radiation from the sun treats the water inside the bottle.Figure 10 How solar water disinfection works. (National Academy of Science Associate, n.d.). Published with permission.
17
2.5.5 Boiling
A simple and effective way to kill pathogens and improve the microbial quality of drinking water is to boil it (IFRC, 2008). However, it must be a rolling, bubbling boil for at least one minut, but this is only in flat areas with low topography. At higher altitude the boiling will have to last for at least three minutes because of the difference in temperature and boiling point (IFRC, 2008). According to Falk (2018; Personal communication), there is a problem in areas high up in the mountains because the water will boil at lower temperature and it is crucial to reach 100
°C
to inactivate and kill the pathogens. However, Oxfam (2001) encourage people to boil for 20 minutes to be completely sure that all pathogens have been inactivated. But on the other hand, boiling the water for five minutes will kill cholera and Shigella. Moreover, it is recommended to letting the water cool over night before drinking it because of the taste. According to WHO (2008) boiling the water will reduce bacteria’s value between 6-9+ LRV. Even though boiling is an easy and good method, IFRC (2008) explains that in areas where wood is scarce it is not suitable since one kilogram of wood work is needed for boiling one litre of water. Another negative aspect can be that the taste of the water will be changed.2.6 Health Promotion to increase peoples control over their own health
Health Promotion is a generic term with the purpose to increase peoples control over their own health (WHO, 2016). Karolinska Institutet (n.d) states that health promotion often includes campaigns with information and explanations to promote and optimize health potentials, both physical and
psychosocial. Health promotion programs are formed to be preventing and to encourage different behaviors (Karolinska Institutet, n.d). According to WHO (n.d), one of the three key elements in Health Promotion is Health literacy. It means that people need to have the necessary knowledge, information and skills to make healthy choices, and the chance to improve their behaviors in a healthy direction. However, there is a complexity when some people don’t have the opportunity to make those choices (WHO, 2016). According to Nutbeam (2000), health promotion programs focus should be promoting education and communication in the subject and to prevent diseases together with improvements in contemporary health education strategies.
An important part of a successful health promotion program is to identify different aspects of the culture and traditions in the land where it is being carried out (IFRC, 2008). In addition, it is crucial to combine technical treatments with education about how hygiene and sanitation affects water. To achieve a successful health promotion, it is important that the people taking part of it understands all information otherwise they will not be able to continue the work themselves. To improve the health in areas where health promotion is needed, one must change behaviour. It can be a hard and long
procedure to change peoples mind but if the people would have the knowledge in how their health are being affected, IFRC (2008) says that they would be more eager to change. On the other hand, knowledge is not always enough, it is important to encourage people in safe hygiene practice. IFRC (2008) has created a four-step guide on how to ensure a successful health promotion.
1. Conduct assessment that focuses in water, sanitation and hygiene 2. Select target group
3. Develop hygiene messages 4. Select communication methods
One lecture or opportunity is not enough to ensure good enough health. There need to be some sort of following up on the education, the follow up should support the program material and strategy, and therefore make a larger impact and improve the situation (IFRC, 2008).
19
3. Material and Method
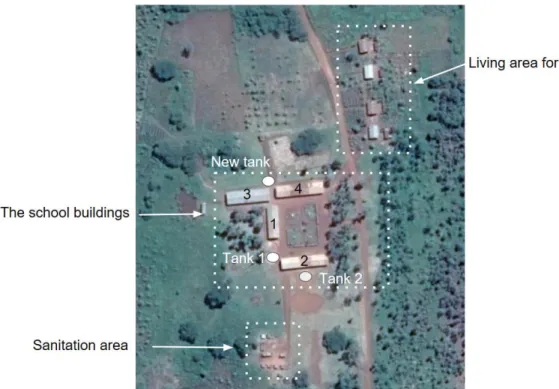
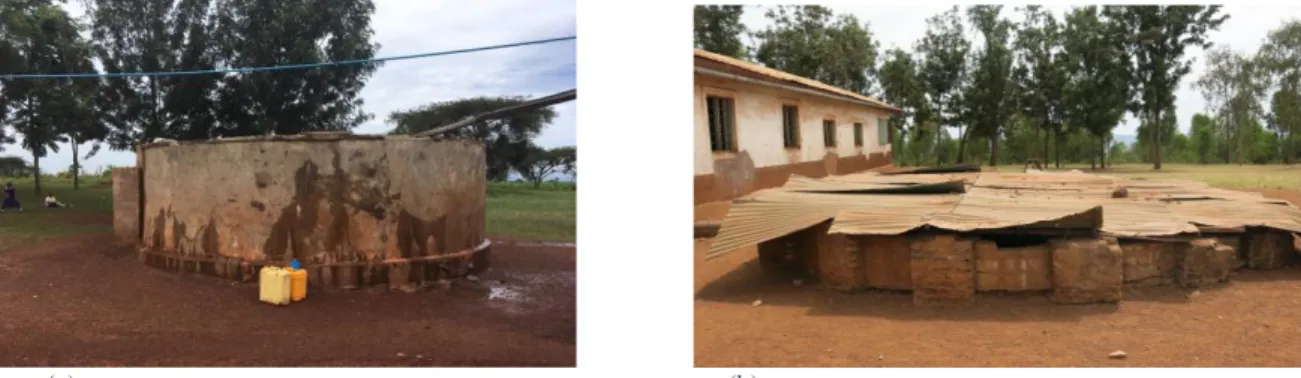
The students at Rukole Primary School are in the ages between 5–14. The school has seven classrooms and there are often more than 100 students in each room, it is open for the students 260 days per year. The water system at Rukole Primary school consists of two rainwater tanks that are located on their property, see Figure 11. Tank 1 is approximately 46 m3 but broke in an earthquake 2016 and as a result of this the tank was leaking during the study. Tank 2 is approximately 50 m3 and about 40 years old, this means that it is almost completely worn out, see Figure 12 (b). Both tanks are provided with water which is collected from the roofs of nearby buildings and lead through pipes to the tanks. For Tank 1, the catchment areas are roof 1 and 2 and the total area is 350 m2 and for Tank 2, the catchment area is roof 2 with a total area of 175 m2. These two tanks are supposed to supply the students and the teachers with drinking water every day. The students in total got 5-10 buckets, containing 10 litres each daily during the field study. Meaning that every student then got between 0.4dl and 0.8dl water a day. Since both tanks are locked for distribution there were no possibility for the students to fetch more water when the buckets were emptied. Because of the topography in the district the closest fresh water source was more than 10km away.
In addition, the teachers could collect water from the school to their homes (Twagirayesu, 2018). Four of them lived at the school property, see
Figure 11
, and used the tanks at the school as their only water resource. The teachers boiled the water before drinking it, but because there were not enough time or money the teachers didn’t boil the water for the students. Therefore, the students drink the water directly from the tanks without any treatment or barriers. The toilets are dry toilets with a hole in the ground, seeFigure 11
for location. Next to the toilets there were a few hanging buckets to wash hands, but because of water scarcity they were empty and there was no opportunity for the students to wash their hands.According to the teacher Twagirayesu (2018-02-12; personal communication), there were about 400 students missing every day because of unknown reasons and during the field study, three students passed away.
20
(a) (b)
Figure 13 Building 1, with one of the roofs working as catchment areas for the rain water tank
Figure 12 Tank 1 (a), Rain water tank above ground at Rukole Primary School. Tank 2 (b), under ground rain water
21
3.1 Water quality testing on samples from Rukole
To establish the current biological quality of the water at Rukole Primary School test were taken to see the amount of indicator organism in it. The microorganisms in focus were E.coli, total Coliforms and Enterococci because they all indicate that feces can be found in the water.
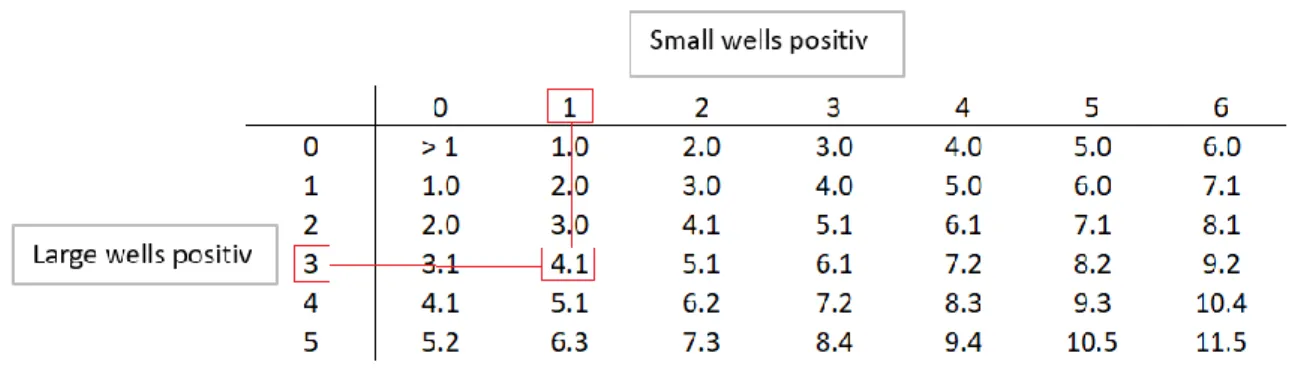
The tests for E.coli and Coliforms were taken according to the ISO 9308-2:2014 standard. Water was collected in sterile containers of 100 ml each. First reagent, Colilert-18, was added to the water sample and the container was shaken to let the reagent blend with the water. After this the mix was poured into a Quanti-Tray/2000 by IDEXX laboratories, which counts the amount of bacteria from 1- 2419. The tray is divided into two parts, one with 48 small wells and another with 49 larger wells. All these should be filled with water before they are incubated at 35
°C
during 18 hours. When the 18 hours had passed, the results could be read and calculated. To see how much Coliforms that existed in the sample all yellow wells were calculated and together with the IDEXX Quanti-Tray Most Probable Number -referens table a total number of Coliforms in one 100ml sample could be decided. The same procedure was used to calculate the amount of E.coli but instead of solemnly calculating the yellow wells, the tray was placed under a UV-lamp to see both yellow and fluorescence ones. The same MPN-table was thereafter used to determine the amount of E.coli in the sample.To calculate the number of Enterococci in the water, the reagent Enterolert*-E, was used instead of Colilert-18. Otherwise the procedure followed the same pattern as for E.coli but with the difference that the test was incubated for 24 hours at a temperature of 41 degrees Celsius. When reading and calculating the results for Enterococci the number of blue fluorescence wells indicated if the test was positive for Enterococci or not. Visible blue fluorescence wells meant that the test was positive for Enterococci. The amount of small as well as large fluorescence wells were counted and compared to the MPN-table as before.
Figure 14
shows the principle of how the number of bacteria are read based on the number of large and small wells according to IDEXX Quanti-Tray MPN -referens table. In this examplee, there is one small well and three large ones which means that there is a total of 4.1 bacteria in one sample of 100ml.22
3.2 Risk assessment and risk management of the water system
In order to get a complete picture of the water system and how the hazards affected it, a risk assessment was done, and a so-called Risk Matrix was created. When the most urgent risks were identified, the next step was a Multi-Criteria Decision Analysis, MCDA, was done to investigate the risk reduction of different solutions as well as consider other aspects such as customer trust, cost and availability. This, to find which solutions that were most appropriate for the school to reduce the most urgent risks in a sustainable way.
3.2.1 Hazards and Hazardous events
First, the water system was divided in to three zones according to Figure 15. The catchment area includes the roof and pipes that lead to the tanks, zone A. The available water storages are the two tanks and they are therefore in zone B. The buckets that are used for distribution of water were in zone C. For every zone, there were hazards, that either contaminated the water or affected the quantity of it, identified. These hazards are presented in Table 4. Furthermore, there were
hazardous events connected to every hazard and they were investigated both on-site by visual inspection and during preparation work. Everything from likely to unlikely events were considered during this part of the process. The hazardous events that were identified were very specific to make it easier to decide the probability and consequence of them. In total, there were 23 hazardous events identified, these are presented in Appendix 1, Table a – Table d. The events are named with a letter, A, B or C, depending on which zone it appears in, and a number to get a clear structure of the risk matrixes. The hazardous events that appeared on the water system never affected both quantity and quality. Therefore, one specific risk matrix was done for the quality and one for the quantity.
Figure 15, The water system at Rukole Primary school, based on WHO's (2011) system division
Table 4. Hazards for every zone of the water system.
Zone Description of hazard
A. The water gets contaminated by the catchment area, or isn’t enough to collect water B. The water in the storage get contaminated, or isn’t enough to collect water
23
Two of the 22 hazardous events were, the catchment isn’t enough, and the tanks are too small for the
number of students. To find out if there were any risk regarding these two some calculations were
made. The catchment areas for the two different tanks were measured and the rain water data in the region was retrieved from world weather online (2017), to calculate how much water that theoretically could be collected
Equation 1
was used (Thomas & Martinson, 2007). The collected rain data was from 2015-2017 and the average value was used. In tropical areas about 85% of the rain water reaches the tank (Thomas & Martinson, 2007) and therefore, the rain depth is multiplied by 0,85. Thecalculations were made both for each rain season as well as for one entire year. The result was used to estimate the possibility for the hazardous event regarding enough catchment area.
Equation 1 How to calculate total volume collected water depending on catchment area and rain depth
𝐶𝑜𝑙𝑙𝑒𝑐𝑡𝑒𝑑 𝑊𝑎𝑡𝑒𝑟 [𝑚3] = 𝐶𝑎𝑡𝑐ℎ𝑚𝑒𝑛𝑡 𝑎𝑟𝑒𝑎 [𝑚2] 𝑥 𝑅𝑎𝑖𝑛 𝑑𝑒𝑝ℎ𝑡 [𝑚] 𝑥 0,85
To find out the risk if the amount of stored water is too small, calculations of the volume water
needed were made according to Equation 2. This result was compared how much water that the school collected for one year as well as the size of the tanks. It was also compared to the amount of
distributed water at the school during the field study, see chapter 3.
Equation 2 Total volume of water for one year
𝑊𝑎𝑡𝑒𝑟 [ 𝑙 𝑦𝑒𝑎𝑟] = (𝑁𝑜. 𝑜𝑓 𝑠𝑡𝑢𝑑𝑒𝑛𝑡𝑠 ∗ 𝐷𝑖𝑠𝑡𝑟𝑖𝑏𝑢𝑡𝑒𝑑 𝑤𝑎𝑡𝑒𝑟 𝑙 𝑑𝑎𝑦+ 𝑁𝑜. 𝑜𝑓 𝑡𝑒𝑎𝑐ℎ𝑒𝑟𝑠 ∗ 20 𝑙 𝑑𝑎𝑦) ∗ 𝑁𝑜. 𝑜𝑓 𝑠𝑐ℎ𝑜𝑜𝑙 𝑑𝑎𝑦𝑠
The teacher at the school use the water for household as well, but the children only use it for drinking and for hygiene. The specific volume needed for the students and the teachers is based on guidelines who are presented in chapter 2.2. The volume that is distributed today is based on the information in chapter 3.
3.2.2 Creating a risk matrix
A risk matrix was made to identify the greatest hazardous events and organize them mathematically to find the greatest risk to the water system. Every event was evaluated and got a specific number, describing the probability for the event to occur. To decide the probability for all hazardous events, observations on site were done. Furthermore, the consequence of each event and how it would affect the school was estimated and graded. The grading and its description were based on the number of students that were sick every day, see chapter 3, and the result from the water quality analysis, see chapter 4.1. In Appendix 1, the numbers and their descriptions are listed. By multiplying the probability for a certain hazardous event with the consequence of the same event a total risk value could be established. For this specific system, it was noticed that the consequence would have a bigger effect on the risk than the probability. For example, if the roof gets contaminated by feces from animals it would contaminate the water that flows to every tank on the school. Even if the probability for the hazard would be reduced and the feces would decrease, it would still reach the tanks, and the affect would be large because of the bacteria’s ability to grow in water. Therefore, the risk would still affect the whole school majorly. This is shown in Table 5wherethe grading has an exponential scale were the consequence increases more than possibility.
In which zone, A, B or C, of the water system the hazardous event appeared were important to decide the consequence. If the hazardous event appeared in zone A or B, where the storage tanks got affected the consequence was high. However, if the hazardous event only appeared in zone C, where the distribution got affected the consequence was not as high since less people would be involved. For example, if some of the students used their own bottles for getting water they were not affected by dirty buckets used for distribution.