Waste diagnostic
A caste study of a company’s waste management
Author: Samuel af Ugglas, samuelau@kth.se
Degree project in chemical engineering, KE200X, 30 credits Royal Institute of Technology
Examiner: Henrik Kusar, hkusar@kth.se
Abstract
This case study of the waste management at a pharmaceutical company investigates the current situation and possible improvements for future work in terms of amount of waste generated, treatment methods and economy. The scope of the project was to assess all current waste streams from the everyday activities and find potential areas for improvement. Chemical/solvent waste have not been investigated thoroughly because of the complexity to make changes within the manufacturing processes. Waste generated during demolition and construction by external contractors have been excluded since it is not a part of the business as usual.
The company has set the goal to decrease greenhouse gas emissions by 20% and waste generated by 15% and to achieve these goals the waste diagnostic project have been initiated. Waste reports and guided tours at each department have been compiled to assess and map out all waste streams at the site. The waste management hierarchy has been used as a tool together with performance measurements to evaluate current situation and with examples from literature, other sites and industries recommendations have been made. The waste management hierarchy is a tool used to prioritize waste management to reach a circular economy, with landfill at the bottom and reduction/reuse at the top of the hierarchy the current status of a company can be assessed and also what areas that have to be improved in order to climb the hierarchy. The company shows a good environmental performance today and comply with internal standards, the waste metric scoring calculation results in a value of, 𝑆𝑇, 464 which corresponds to energy recovery level of the waste management hierarchy.
An ISO certificate ensures customers that a product or service meet the standards the customer have. There are ISO standards within many different areas and ISO 14001 applies to environmental management which the company is not certified with. The company comply with the internal standards but an ISO certificate would result in extra credibility. Some of the recommendations to the site includes a waste management communication program to engage employees, reuse of disposable pallets, drying of wastewater sludge and installation of paper shredder to reduce costs related to classified documents.
Sammanfattning
Denna fallstudie om avfallshanteringen på ett läkemedelsföretag undersöker den nuvarande situationen och potentiella förbättringsmöjligheter för framtida arbete beträffande mängd avfall som genereras, behandlingsmetoder och ekonomi. Projektets mål var att utvärdera alla avfallsströmmar från de dagliga aktiviteterna och identifiera potentiella områden för förbättring. Kemiskt/lösningsmedelavfall har inte undersökts på djupet på grund av komplexiteten att göra ändringar inom tillverkningsprocesserna. Projektavfall som genererats under rivning och byggande av externa entreprenörer har uteslutits eftersom det inte är en del av den dagliga verksamheten.
Företaget har satt som mål att minska utsläppen av växthusgaser med 20% och avfall genererat med 15% och för att uppnå dessa mål har ”waste diagnostic” projektet inletts. Avfallsrapporter och guidade turer vid varje avdelning har sammanställts för att utvärdera och kartlägga alla avfallsströmmar på siten. Avfallshierarkin har använts som ett verktyg tillsammans med prestandamätningar för att utvärdera den aktuella situationen och med exempel från litteratur, andra siter och branscher har rekommendationer gjorts. Avfallshanteringshierarkin är ett verktyg som används för att prioritera avfallshantering för att uppnå en cirkulär ekonomi, med deponering i botten och minskning / återanvändning högst upp i hierarkin kan den aktuella statusen för ett företag bedömas och även vilka områden som måste förbättras för att nå högre upp i avfallshierarkin. Siten visar på en bra miljöprestanda idag och uppfyller de interna standarder som fastställts. Beräkningen av ”waste metric scoring” resulterar i ett värde, 𝑆𝑇, på 464 vilket motsvarar nivån för energiåtervinning i avfallshanteringshierarkin.
Ett ISO-certifikat garanterar kunder att en produkt eller tjänst uppfyller de standarder kunden har. Det finns ISO-standarder inom många olika områden och ISO 14001 är certifikatet för miljöledning som siten inte är certifierad med. Företaget följer de interna standarder som har satts men ett ISO-certifikat skulle resultera i ökad trovärdighet. Några av de identifierade rekommendationerna till företaget inkluderar ett kommunikationsprogram för avfallshantering för att engagera och utbilda anställda, återanvändning av engångspallar, torkning av slam och installation av dokumentförstörare för att minska kostnaderna kring sekretessbelagda dokument.
List of abbreviations
API Active pharmaceutical ingredient BAU Business as usual
CGMP Current good manufacturing practice
D Disposal
FDA Food and drug administration GMP Good manufacturing process HP Hazardous properties
ISO International organisation of standardisation KPI Key performance indicators
MPA Swedish medical protection agency
Table of Contents
Abstract ... 2 Sammanfattning ... 3 List of abbreviations ... 4 List of tables ... 8 List of figures ... 8 1 Introduction ... 91.1 Waste management hierarchy ... 9
1.2 Waste ... 11
1.2.1 Environmental Savings ... 13
1.3 Swedish regulations ... 13
1.4 International standards ... 14
1.5 Food and drug administration ... 15
1.6 The company ... 15
1.7 Waste management company ... 16
1.8 Scope of the project ... 16
1.9 Limitations ... 17
2 Methods ... 18
3 Waste assessment ... 19
3.1 Waste generating sources on site ... 19
3.2 Supply chain ... 19 3.3 Manufacturing processes ... 20 3.3.1 Production 1 ... 20 3.3.2 Production 2 ... 20 3.3.3 Production 3 ... 21 3.3.4 Production 4 ... 21 3.4 Laboratories ... 21 3.4.1 Laboratory 1 ... 21 3.5 Automation ... 21 3.6 Utilities ... 22 3.7 Maintenance ... 22
3.8 Wastewater treatment plant ... 22
3.9 Project waste ... 23
4 Analysis ... 24
4.1 Current situation ... 24
4.1.1 Ten largest waste streams ... 26
4.1.2 Costs ... 27
4.2 Landfill ... 30
4.3 Incineration or other treatments ... 30
4.4 Energy recovery ... 31
4.5 Recycling ... 33
4.6 Reuse ... 34
5 Optimisation and recommendations ... 35
5.1 Supply chain ... 35 5.2 Manufacturing processes ... 37 5.3 Laboratories ... 37 5.4 Automation ... 39 5.5 Utilities ... 39 5.6 Maintenance ... 39
5.7 Wastewater treatment plant ... 39
5.8 Chemical waste and solvents ... 40
5.9 General discussion ... 41
5.9.1 Project waste ... 41
5.9.2 Waste management hierarchy ... 42
5.9.3 ISO certificate 14001 ... 42
5.9.4 Future work ... 42
6 Conclusion ... 44
List of tables
HAZARDOUS PROPERTIES GIVEN BY THE EUROPEAN UNION ... 11
DISPOSAL OPERATIONS WITH CORRESPONDING CODE GIVEN BY THE EUROPEAN UNION ... 12
RECOVERY OPERATIONS WITH CORRESPONDING CODE GIVEN BY THE EUROPEAN UNION ... 12
ENVIRONMENTAL SAVINGS FROM MATERIAL RECYCLING GIVEN BY IVL SWEDISH ENVIRONMENTAL RESEARCH INSTITUTE ... 13
APPROXIMATED VALUES FOR WASTE STREAMS PRESENTED IN FIGURE 3 ... 25
COST FOR EACH TREATMENT METHOD PER KG OF WASTE INCLUDING HANDLING AND TRANSPORTATION ... 28
REVENUE AS OF 2019 ... 29
KEY PERFORMANCE INDICATORS ... 29
VALUES FOR WASTE SCORING ... 29
VALUES FOR WASTE SCORING NEGLECTING CHEMICAL WASTE AND WASTEWATER SLUDGE ... 30
WASTE FRACTIONS FOR INCINERATION OR OTHER TREATMENTS ... 31
WASTE FRACTIONS FOR ENERGY RECOVERY ... 31
WASTE FRACTIONS FOR RECYCLING ... 33
List of figures
WASTE MANAGEMENT HIERARCHY ... 10WASTE SCORING CALCULATIONS ... 10
FLOWCHART OF MAJOR WASTE STREAMS ... 24
EFFLUENT PER BATCH GIVEN IN CUBIC METRES (SLUDGE IS DEWATERED) ... 25
WASTE GENERATED FROM JANUARY 2019 TO DECEMBER 2019 ... 26
TEN LARGEST FRACTIONS AS OF 2019 COMPARED WITH THE YEARS 2017 AND 2018 ... 27
1 Introduction
During the last decades there have been a close relation between economic growth and increase of waste generated. To counteract this situation, waste generation must be decoupled from economic growth. [1] Due to this and other reasons there is a growing demand on proper waste management globally, both in the households and within the industries. The pharmaceutical manufacturing companies are no exception, but the other way around because of the potentially harmful materials generated from raw material to end product. The production of pharmaceuticals and the disposal of unused pharmaceuticals is the second largest contributor to pharmaceutical pollution to the environment. [2] Apart from the greenhouse gas emissions and waste including paper, scrap metal, plastic, old equipment etcetera, the pharmaceutical industry produces materials that can affect the ecosystems (e.g. drugs administrated by living organisms). Globally, the focus have been on excreted drugs, probably strengthened by cases like feminization of fish due to excretion of oestrogen and reasoning that pharmaceuticals would not be released into the environment during production due to its economic value for the companies. Today, with more attention targeted to the manufacturing of pharmaceuticals it has been concluded that the release of active pharmaceutical ingredients (API) occur globally during production in countries such as China, India, Germany, Switzerland and the United States, among others. Another reason to highlight the importance of proper waste management systems within the industry is the problem with bacterial antibiotic resistance. [3]
The pharmaceutical companies follows good manufacturing practice (GMP) which is a regulatory framework that ensures the security of the patient by controlling everything from purity of raw material to education/training of personnel meets the required standards. [4] The Swedish Medical Products Agency (MPA) have submitted a proposal to the European Union where GMP should include regulations to reduce the impact on the environment. Today there is no regulation controlling the release of API to the environment during production as there is for solvent and chemicals which however, only applies within the European Union. Swedish medical protection agency believes that this will contribute to the global goals for sustainable development. [5]
1.1 Waste management hierarchy
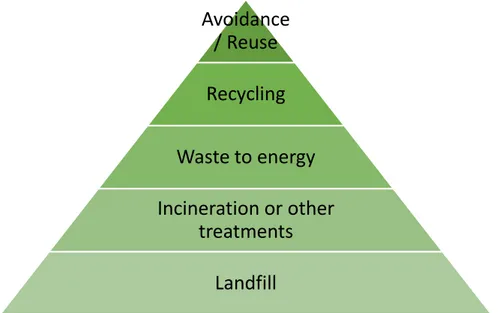
The waste management hierarchy can be used to prioritize waste management actions with avoidance/reduction at the top and disposal/landfill at the bottom. Landfill is the last and worst option because of the risks associated with it. Methane can be produced and released into the atmosphere as well as substances as heavy metals may be released into the environment e.g. through leachate. Energy recovery is the next option where waste either can be used directly as fuel in some processes or for incineration where energy can be produced in the form of electricity, steam and heat. However if the combustion is not complete it might result in releasing materials and gases harmful to humans and the environment.
Recycling is the third option. The waste might not be available for reuse in the current process or upcycling, however through recycling it can be broken down and formed into new products and by that it can get new value and serve a purpose in another context. Reuse means repeated use of the product/component for the same application over and over again even
though it sometimes requires some preparation. At the top of the hierarchy is avoidance which focuses more on design of manufacturing process, basically if no waste is produced, there is no waste to dispose. [6] However, one thing to keep in mind is that just because a material or product is recyclable, it does not mean that it is always better from an environmental perspective compared to other available treatments or disposal. The recycled material is also in competition with the virgin material on the market which needs to be considered. [7] A visual representation of the waste management hierarchy is given in Figure 1.
Figure 1 Waste management hierarchy
The waste management hierarchy can be used for benchmarking where each level of the hierarchy corresponds to a scoring value as seen in Figure 2 where the goal is to reach a value as low as possible.
Avoidance
/ Reuse
Recycling
Waste to energy
Incineration or other
treatments
Landfill
𝑆𝐴 = 𝐹𝐴∗ 0 𝑆𝑅 = 𝐹𝑅 ∗ 3 𝑆𝑊𝐸 = 𝐹𝑊𝐸∗ 4 𝑆𝐼 = 𝐹𝐼∗ 8 𝑆𝐿 = 𝐹𝐿 ∗ 10The corresponding waste metrics are calculated as the product of the scoring value and the weight quotient from the appurtenant level. The values from each level are then summed to give the final result where a scoring of 1000 is the worst (100 % landfill) and a scoring of 0 (100 % reuse) is the best possible performance value. Explanation of calculations and scoring values are given in equation ( 1 ) and ( 2 ) where 𝐹𝑖 is the weight fraction in percentage of mass fraction 𝑀𝑖 divided by the total mass 𝑀𝑇 and 𝑆𝑖 is the calculated scoring from each fraction given in The total scoring value 𝑆𝑇 is calculated as the sum of 𝑆𝑖 times 100. [8, 9]
𝐹𝑖 = 𝑀𝑖
𝑀𝑇 ( 1 )
𝑆𝑇 = (𝑆𝐴+ 𝑆𝑅+ 𝑆𝑊𝐸+ 𝑆𝐼+ 𝑆𝐿) ∗ 100 ( 2 )
1.2 Waste
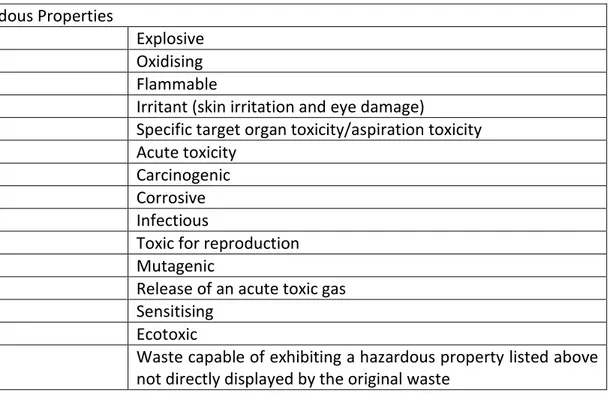
Waste is defined as “any substance or object which the holder discards or intends to discard”. [7] Waste can be classified either non-hazardous or hazardous and the European commission (regulation No 1357/2014) states 15 hazardous properties, HP1 to HP15, presented in Table 1. If a substance contains one or more of these properties, above the threshold limit, it is classified as hazardous material. [9]
Table 1 Hazardous properties given by the European Union
Hazardous Properties
HP1 Explosive
HP2 Oxidising
HP3 Flammable
HP4 Irritant (skin irritation and eye damage)
HP5 Specific target organ toxicity/aspiration toxicity
HP6 Acute toxicity
HP7 Carcinogenic
HP8 Corrosive
HP9 Infectious
HP10 Toxic for reproduction
HP11 Mutagenic
HP12 Release of an acute toxic gas
HP13 Sensitising
HP14 Ecotoxic
HP15 Waste capable of exhibiting a hazardous property listed above not directly displayed by the original waste
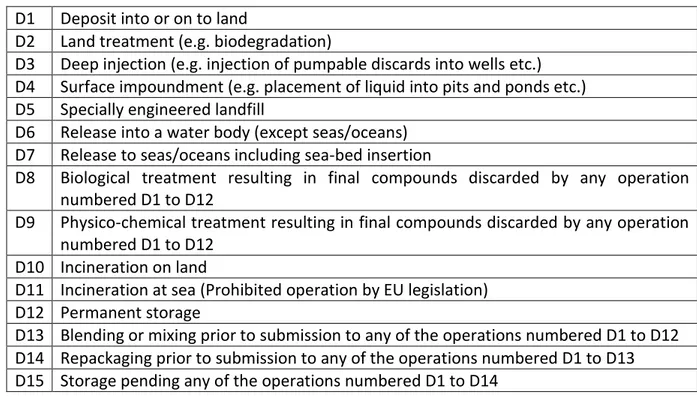
Apart from the hazardous classification system they have also published a classification system for waste treatment activities in European Union framework directive 2008/98. The operation can be either disposal (D) or recovery (R) and are presented in Table 2 and Table 3 respectively. [10]
Table 2 Disposal operations with corresponding code given by the European Union
D1 Deposit into or on to land
D2 Land treatment (e.g. biodegradation)
D3 Deep injection (e.g. injection of pumpable discards into wells etc.) D4 Surface impoundment (e.g. placement of liquid into pits and ponds etc.) D5 Specially engineered landfill
D6 Release into a water body (except seas/oceans) D7 Release to seas/oceans including sea-bed insertion
D8 Biological treatment resulting in final compounds discarded by any operation numbered D1 to D12
D9 Physico-chemical treatment resulting in final compounds discarded by any operation numbered D1 to D12
D10 Incineration on land
D11 Incineration at sea (Prohibited operation by EU legislation) D12 Permanent storage
D13 Blending or mixing prior to submission to any of the operations numbered D1 to D12 D14 Repackaging prior to submission to any of the operations numbered D1 to D13 D15 Storage pending any of the operations numbered D1 to D14
Table 3 Recovery operations with corresponding code given by the European Union
R1 Use principally as a fuel or other means to generate energy R2 Solvent reclamation/regeneration
R3 Recycling/reclamation of organic substances which are not used as solvents R4 Recycling/reclamation of metals and metal compounds
R5 Recycling/reclamation of other inorganic materials R6 Regeneration of acids or bases
R7 Recovery of components used for pollution abatement R8 Recovery of components from catalysts
R9 Oil re-refining or other reuses of oil
R10 Land treatment resulting in benefit to agriculture or ecological improvement R11 Use of waste obtained from any of the operations numbered R1 to R10
R12 Exchange of waste for submission to any of the operations numbered R1 to R11 R13 Storage of waste pending any of the operations numbered R1 to R12
1.2.1 Environmental Savings
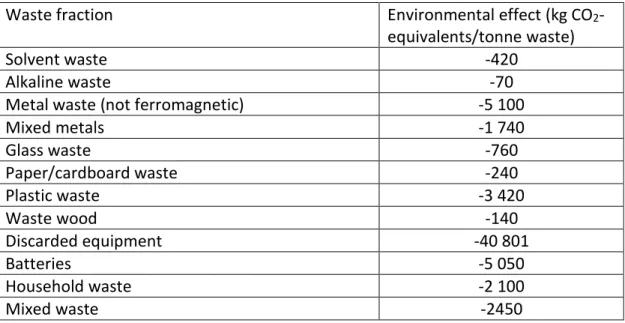
IVL Swedish Environmental Research Institute have made estimations for potential savings of carbon dioxide emissions for recycled materials compared with virgin materials. Some of these values are presented in Table 4 and can be used as a rough estimation on environmental savings that an action might generate. [11]
Table 4 Environmental savings from material recycling given by IVL Swedish Environmental Research Institute
Waste fraction Environmental effect (kg
CO2-equivalents/tonne waste)
Solvent waste -420
Alkaline waste -70
Metal waste (not ferromagnetic) -5 100
Mixed metals -1 740 Glass waste -760 Paper/cardboard waste -240 Plastic waste -3 420 Waste wood -140 Discarded equipment -40 801 Batteries -5 050 Household waste -2 100 Mixed waste -2450
1.3 Swedish regulations
By Swedish law it is prohibited to deposit liquid waste, any other waste that is explosive, corrosive, oxidising, flammable, infectious medical waste, unidentified chemical compounds from teaching or research, combustible waste and organic waste at landfill. Also it is only allowed to deposit waste at landfill if it has been treated by physical, thermal, chemical or biological means. [12] Combustible waste is defined as waste that burns without addition of energy after the incineration has started and organic waste includes biological waste, plastic waste, any other waste that contains organic carbon and food waste. [13]
Incineration of waste and landfilling is also regulated by taxes. As of 2020 there is a taxation for incineration of 75 SEK per tonne waste and it will increase to 125 SEK by 2022. [14] A tax of 500 SEK per tonne waste applies for landfilling since 2018. [15] In Sweden there is a regulation called “Producer responsibility” which applies producers within eight different areas today. The purpose of this regulation is to promote products that are resource effective, easy to recycle and does not contain hazardous substances. The eight different areas included today are producers of: [16]
Batteries Cars Tires
Electrical equipment Packaging
Waste paper Pharmaceuticals Radioactive products
As of January 2021 new changes take effect and the goal is to facilitate waste sorting for companies and to reach higher up in the waste management hierarchy. A collecting system for packaging should be available for companies either free of charge or a collector for a possible fee. The collector should provide information about the obligation to sort out packaging waste, how to sort, available system and available treatment methods. It is also recommended that the collector help the companies to promote material recycling. The regulation also includes a reporting system that is under development at the moment. [17] Producer, as of January 2021, is defined as any company that:
Import a packaged item to Sweden Produce a packaging material in Sweden Import a packaging material to Sweden
Fills or in any other way uses a packaging that is not a service packaging that serve a purpose to protect, present or facilitate handling of an item
End user is not covered by the definition of producer. The end user can for example be a company that purchase a packaged item and uses it within the firm, such as raw material. [18]
1.4 International standards
The International Organisation for Standardisation (ISO) is an independent organisation that develops and sets standards based on market need in different areas. Some of the most used includes standards for quality management, information security management and country codes. ISO certificates basically means that consumers can be assured that the product or service they buy is safe, reliable and of high quality. ISO 14001:2015 (environmental management systems) can be used by companies to improve their environmental performance. ISO 14001:2015 contributes to the sustainable development goals set by the United Nations (UN) and the intended results are improvement of environmental performance, fulfilment of compliance obligations and accomplishment of environmental goals. [19] The requirements of ISO 14001:2015 covers the areas presented below [20] [21]:
Organisation
o Requirement of an overview of the entire companies environmental performance to see whom different actions affect and by that enabling improvements.
Leadership
o Requirement for management to show leadership and commitment to the environmental management system and identification of roles, responsibilities and authorities involved. It also requires a policy which will act as the company goal.
o Requirement of a plan to handle risks and opportunities, identification of how the company interacts with the environment, set of objectives and how to reach them.
Support
o Requirement of competence, training and awareness. Also documentation and communication pertinent to the environmental systems management.
Operation
o Requirement of a plan on how to control the company operations and prepare for emergency environmental situations.
Performance evaluation
o Requirement of a plan on how to monitor, measure, analyse and evaluate environmental performance. It also requires management to review the environmental systems management to ensure its function and improvement. Improvement
o Requirement of a plan on how to handle noncompliance and how to correct these.
If a company have an ISO certificate it does not necessarily mean that they are better compared to another company which do not have one but it ensures customers and stakeholders a certain level of quality and thus gives a competitive advantage.
1.5 Food and drug administration
To ensure the quality of pharmaceuticals many countries have established pharmaceutical regulations and authorities to control the market. [22] Food and drug administration (FDA) regulates the quality of pharmaceutical in the US mainly by determining if a manufacturer comply with current good manufacturing practice (CGMP). CGMP assures the quality of a drug through control of manufacturing operations which includes everything from testing of raw material to quality control of finished product. After a drug is approved it can be manufactured and sold, however, if the manufacturer want to make any changes in the process it must be reported to the FDA and evaluated to ensure that CGMP is still complied with. These changes include among others, change in process, quality controls, responsible personnel or supplier. [23] [24] But submission to FDA only grants clearance within the US so changes like these must be submitted to multiple countries which means multiple reviews and pre-approval inspections. This whole process is time consuming and involves risks like product shortage, major changes can take a few months for approval in some countries and in other, more than 18 months. [25] As a result of this, changes in pharmaceutical manufacturing is a very complex process and is not an easy task.
1.6 The company
In the internal standards they define the waste management hierarchy in seven different levels:
1. Avoidance 2. Reduce 3. Reuse 4. Recycling
5. Energy Recovery 6. Treatment 7. Disposal
The hierarchy is used as a tool for waste minimization during impact assessment. This is a part of achieving the company goals covering environmental sustainability and to be the leading company in environmental performance. [27] In the standards expectations are stated along with classification of waste streams. All waste streams should be documented and characterized as hazardous or non-hazardous and thereafter the waste management hierarchy should be applied. This standard applies to all waste produced by the company’s operations including waste from remediation and demolition activities regardless the producer.
The company have set goals for 2020 to reduce GHG emissions by 20% and reduce waste disposal by 15% and in order to meet these goals and comply with set standards a waste assessment should be conducted at all sites. [27] The site is, today, not certified within ISO 14001 but comply with internal standards set and is continuously audited by external and internal parties.
1.7 Waste management company
The waste management company is responsible for the collection and treatment of all waste generated at the site and provides the ability to handle all different fractions that arises during the year. Their mission is to offer innovative and effective solutions to turn waste into resources and they are promoting research and development within the area to attain a circular economy. The waste management company is today accredited with ISO 9001 (quality), ISO 14001 (environment), ISO 45001 (occupational health and safety) and are eligible to transport, store and treat all sorts of waste with permits in 49 cities and some covering all of Sweden. [9]
1.8 Scope of the project
The main objective of this study was to assess all the waste streams at the company’s site to make an inventory and map out the source. Based on the waste management hierarchy and focus on major waste streams and largest contributors to the scoring, waste streams were prioritized and optimised in the purpose of climbing the waste management hierarchy.
1.9 Limitations
This study is limited to non-chemical waste and waste coming from projects will be excluded. Project waste is all waste produced by external contractors during demolition and construction at the site and is not considered a part of business as usual (BAU). Project waste is included in the waste reports but since this work focuses on the daily activities and the performance of the production and the associated departments these fractions will be excluded to get a more accurate result in terms of waste generated in relation to production. However, the amounts of chemical waste will still be presented with recommendations for future investigation since the fractions are too large to be neglected but they will not be studied in depth, hence no judgement will be made whether they are feasible or not.
2 Methods
The methods used in this project to assess the existing problems and obtain the results includes literature reviews, interviews/guided tours and compiling of waste statistics. A literature review was carried out to obtain background knowledge within the subject and also to gain information about national and international legislation. Waste reports have been analysed together with qualitative interviews/guided tours to map out the waste streams. The largest contributors in terms of waste scoring was determined (non-chemical waste) and with the goal to move up the waste management hierarchy and examples from literature, other sites and industries, conclusions have been reached.
3 Waste assessment
3.1 Waste generating sources on site
In the following section the guided tours will be presented together with the most common and largest waste fractions generated at each department where future possibilities for improvements might exist. To create a better overview of the waste generating sources, the work has been divided in the different departments as follows:
Supply chain Manufacturing processes o Production 1 o Production 2 o Production 3 o Production 4 Laboratories o Laboratory 1 Automation Utilities Maintenance
Wastewater treatment plant
The different departments have both similar waste e.g. packaging and activity specific e.g. chemicals used in a manufacturing process. Due to other current projects the chemical waste from manufacturing is not the main focus but an overall picture of the waste streams are still given since the fractions cannot be ignored.
3.2 Supply chain
This department is responsible for all deliveries and shipments at the site. All goods come in large quantities which are unpacked and stored here. Majority of the waste streams are waste wood from disposable pallets (Euro pallets are reused) packaging material as cardboard and plastics. The department is situated near the recycling centre located within the site and all fractions can therefore be sorted at the source. Small amounts of batteries and hazardous waste is generated. A large amount of the goods stored have an expiration date which is checked monthly. If the products expires the subsequent month it gets disposed. The amount varies with time, can be 5 kg one month and a few hundred of kg the following month. The greater part are sent to its respective department as delivered but sometimes waste is generated when products are sent from one department to another. For example raw material 1 is delivered to supply chain where it gets unpacked. Then it is weighed up in several smaller bags and sent for the production of product 1. These specific bags have a maximum volume of 10 kg by agreement at the site. This occur partly because of the mass needed at production does not match the delivered one and the weight tolerance from supplier is not always adequate. [29]
3.3 Manufacturing processes
The raw material used in the production is fed through pipelines and therefore no raw material has to be handled at its respective department and no waste is created in relation to raw material handling (except from source). After new directives from the Swedish medical protection agency, the clothing used in production is packed in plastic bags with pants and sweaters separated outside of the personnel-lock.
3.3.1 Production 1
The production of product 1 is running full time 24 hours per day during 200-250 days per year including a stop in production during summer and winter. Producing one batch of product 1 per day which are sent to another site for preparation before reaching its patients. The waste produced during the manufacturing of product 1 includes a small amount disposables such as cable ties and gloves, packaging for clothes and delivered goods, chemical waste, non-approved batches and some office waste. Salt used to clean the equipment is delivered through a material-lock where the goods are supposed to be unpacked (secondary packaging) but due to weight and bulkiness the bags are instead sterilised. For example 25 bags containing 25 kg salt is delivered each day, every bag is double packaged and they are sterilised, thus the secondary packaging is unnecessary. Plastic bags containing raw material 1 are sorted as hazardous waste and at supply chain the same type bag is sorted as soft plastic (non-hazardous). Approximately 45 litres of chemical waste is produced in excess during each batch. After the batch is done the product is separated, dried and weighed up in two double packed bags for refining. Batches that are not approved are saved to be used in testing and are reused in that sense. [30]
3.3.2 Production 2
This department makes buffers for further use in production 3 and production 4. The solutions made are mostly salt and sugar solutions. No hazardous chemicals is handled at the department. Waste is mostly generated through deliveries where the fractions are plastics and glass. The packaging varies, salt bags are double packed in plastic, alkaline solutions comes single packed in plastic bottles and acetic acid in glass bottles. All goods arriving to the department gets sterilised in the material-lock and no packaging is removed. Worth to be noted is that some goods are delivered in multiple smaller packs e.g. citric acid is delivered in 15 packages instead of one large. Disposables are also consumed such as buffer solutions, centrifuge tubes, gloves and ethanol. At the department fractions are sorted as combustible waste or hard plastic and in the personnel-lock there is a separate bin for soft plastic for clothing. Whenever other fractions such as glass or metal needs to be disposed they are brought separately to the recycling centre. Four filters are used for each batch and are disposed as combustible waste. [31]
3.3.3 Production 3
At this department microorganisms are grown and extracted for further use. Material concerning the products are mainly transferred through pipes. Waste generated includes different types of filters, nitrile gloves, pipettes, cuvettes, plastic and glass containers, metal and packaging waste. The different sorting vessels are combustible waste, hard plastic, metal, glass, hazardous waste, biobags containing acetic acid, filters. At the personnel-lock soft plastic can be sorted however not in the production area and by that a lot of soft plastic are disposed together with combustible waste. Deliveries comes in large containers covered with plastic film, they are sterilised and then brought into the production. Some goods are packed once while others have up to three different packaging, where all is removed at once. For example some filters are packed in double plastic bags and one layer of plastic foam. Daily 12 sets of clothes are used during weekdays and 9 sets during weekends however at this department the packaging for clothes are sorted. If test tubes are contaminated they can be washed and sterilised and then sorted as plastics otherwise it is disposed as hazardous waste. [32]
3.3.4 Production 4
This is the final stage of the manufacturing processes where the product gets ready for delivery. The major waste streams are hard and soft plastics related to deliveries of containers, filters and disposables. A small amount of hazardous waste is generated as disposed test tubes and septum hoses. Glass and metal is sorted but almost none is generated, only at occasions where something breaks. Filters used in the process are sorted separately and collected by WWTP. 15 sets of sweaters and pants are used daily together with beard-/haircap. [33]
3.4 Laboratories
3.4.1 Laboratory 1
At the department analysis is conducted on all products produced and the raw material delivered to the site. All material that gets contaminated is sorted separately as hazardous waste. There is a lot of combustible waste and hard plastics generated. Some articles are disposed before use due to large packages. Aluminium foil, glass and metal is sorted separately. It is experienced that more reagent material is disposed nowadays than before and that suppliers take more time for deliveries (up to one month). Due to expiry date a lot of the material has to be disposed before use this is believed to be related to bulky orders and also change in production. It should be noted that the possibilities for sorting waste exist but is not handled accordingly, for instance paper is disposed among plastics, plastics and combustibles are mixed and uncoloured glass is disposed in the container for coloured glass and so on. [34]
3.5 Automation
Automation is the department providing support for software and systems at the site. By that there is no specific waste other than office waste generated on a daily basis. However sometimes obsolete equipment has to be disposed including monitors, computers, cables, diskettes and CD’s which is sorted as electronics and cables separated. This can be substantial amounts especially during “5 S” processes. As for the daily waste only paper is sorted and the
rest as combustible, separate bin for PET-bottles have been removed and no other bins exist at the department. CD’s and diskettes contains confidential information, therefore they must be handled accordingly. Previously they were sent for destruction and now different alternatives are investigated to develop a routine. [35]
3.6 Utilities
This department is responsible for changing the filters for ventilation and water at the site. Ventilation filters are changed once every year, accounting to about 750 in total, the filters consists of a frame in aluminium with connected filter bags 60 x 60 cm. There are three water facilities with the need to change water filters every third month together with tank breather filters twice every year accounting for 12 filters in total. When the filters are changed they are placed in a bag to prevent dust spreading to protect equipment and employees. They are disposed in a separate container handled by the waste management company and later sent for energy recovery. [36]
3.7 Maintenance
The work done by this department includes maintenance of the site, measurement and calibration of equipment and includes mechanics and electricians. The most common waste streams that arise every year includes fluorescent lamps, electrical enclosure, construction fittings, stainless steel from demolition work (500 – 1000 kg/year) and oil spills from maintenance of pumps and mixers (30-40 litres/year). All fractions are sorted but some are disposed at landfill (plastic and stainless steel pipes and is assumed to be less than one tonne per year). Disposables used includes gloves (ca 100 pairs/year) and paper cups. Small amounts of unused products are discarded e.g. dried silicone or glue tubes. [37]
3.8 Wastewater treatment plant
Water from all processes is treated and then released into a lake situated near the site. Analyses of the water released are made automatically every day using a biotector and twice every week manual analysis are made to make sure that the water, to be released, meets the standards. Apart from the sludge produced, most of the waste is packaging and combustible waste such as gloves, wiping cloths and paper. All fractions of waste can be sorted at the department as hard or soft plastics, aluminium, metal, glass, paper, cardboard and combustible waste. The technique used today is aerobic digestion using a moving bed biofilm reactor with plastic carriers mixed in the tank by the existing aeriation system and future plans includes a denitrification step to reduce the amount on nitrogen in the water. The wastewater sludge is collected by the local reciever and then sent for incineration to recover energy and no nutrients are recovered during the process. [38]
3.9 Project waste
Project waste is generated through demolition and construction at the site and does not belong to the waste generated in BAU since it is considered to be a temporary waste stream which occurs only once. Fractions related to project waste might include waste wood, scrap metal, concrete and so on. Problems associated with the waste coming from projects is that it generates errors in the statistics. Demolition and construction is performed by external contractors who are supposed to sort their waste separately and report to a different account so that waste from BAU and projects does not get mixed. Contractors have the responsibility but today there are no incentives, thus it relies on the personal involvement within the subject. Because of this, fractions are sometimes reported incorrectly resulting in false statistics which in turn lower the credibility of environmental performance measurements. Fractions belonging to both BAU and projects in 2019 includes aluminium, mixed waste, scrap metal, combustible waste, landfill, metal packaging, plastic packaging, stainless steel and wood waste. Since some fractions belong to both BAU and project it will not only be time consuming to distinguish what comes from where but sometimes even impossible.
4 Analysis
In this section a summary of the monthly waste reports, provided by the waste management company, will be presented. First, a visualisation of the waste streams from each department is given together with the ten biggest waste streams (excluding chemicals and sludge), a comparison of the years 2017 – 2019, the waste metric calculation and the costs involved to state the current situation. Then all levels of the waste management hierarchy are divided into separate sections to give a more detailed overview of the fractions in each level.
4.1 Current situation
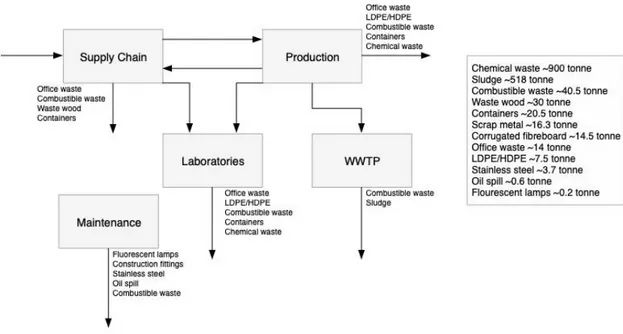
A flowchart of the major waste streams at supply chain, production, laboratories, wastewater treatment plant and maintenance are presented in Figure 3 with the corresponding values in tonnes presented in Table 5.
Figure 3 Flowchart of major waste streams
The largest waste streams, chemical waste and wastewater sludge comes from the production and the wastewater treatment plant and some more specific fractions comes from maintenance. Apart from that, the remaining fractions are generated at almost all departments meaning that some recommendations will be general for the entire site. Combustible waste, waste wood, containers, plastics and corrugated fibreboard are generated from all the deliveries coming in to the site and some actions will apply to the department of procurement. These fractions are also of specific interest where probably most improvements exist for climbing the waste management hierarchy in terms of recycling, reduction and reuse.
Table 5 Approximated values for waste streams presented in figure 3 Waste fraction Amount (tonne)
Chemical waste 900
Sludge 518
Combustible waste 40.5
Waste wood 30
Containers (plastic, glass and metal) 20.5
Scrap metal 16.3 Corrugated fibreboard 14.5 Office waste 14 LDPE/HDPE 7.5 Stainless steel 3.7 Oil spill 0.6 Fluorescent lamps 0.2
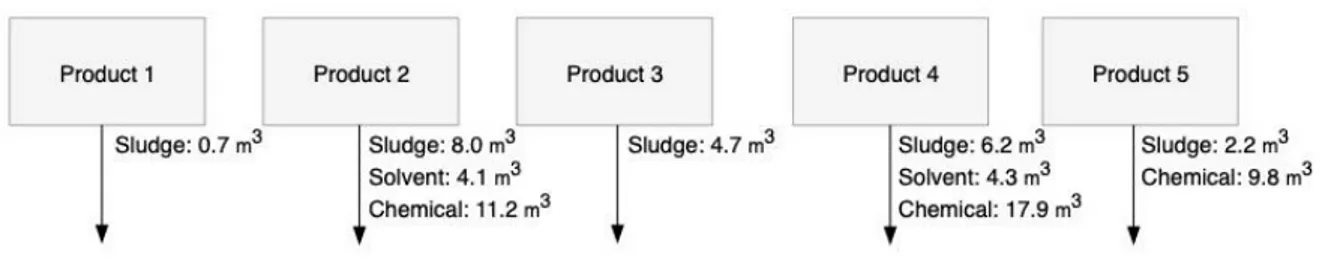
The effluents from each different batch produced are given in Figure 4. The amount of waste generated per batch for a certain period depends on which batch that is produce during that time.
Figure 4 Effluent per batch given in cubic metres (sludge is dewatered)
The company have provided the opportunity for every day sorting of waste together with the waste management company. However the involvement and knowledge among the personnel varies which in turn affects the handling and treatment of waste and also possibilities for future improvements. With the goal of improving the environmental performance, using the waste management hierarchy, opportunities exist in many areas as education, supplier take-back programs, reusage, minimize disposables and challenge suppliers. What needs to be taken into consideration and what makes the waste management more complicated is, all the material that gets contaminated with product or other substances are classified as hazardous waste and need special handling and the requirements for sterile equipment and virgin raw material to meet the GMP standards limits the possibility for reuse options.
The possibilities to sort the waste generated varies throughout the site. Hard plastic, office paper and combustible waste are the three fractions available for sorting at each department and three out of four personnel-locks have separate bin for soft plastic intended for the packaging of clothes.
In comparison with the sites in country 1 and country 2 the major difference is the quotient chemical waste. In this case, the chemical waste is by far the largest contributor both in volume and scoring, for example with only one fraction (alkaline solution containing organic compounds) representing 32 % of the total waste generated. At the other sites solid waste adds up to the largest fractions but to be noted is that they are larger biotech sites with a different production.
4.1.1 Ten largest waste streams
The ten biggest waste streams (excluding sludge and chemical waste) are combustible waste, waste wood, plastic packaging, scrap metal, corrugated fibreboard, office paper, sorted waste to landfill, electronics, LDPE film and blasting sand. All present waste streams as of the year 2019, excluding chemical waste and sludge are presented in Figure 5. Due to poor handling of waste there is no clear distinction between waste from BAU and projects. Looking at the ten biggest waste streams 50 % corresponds to recycling, 43 % to energy recovery and 7 % to landfill. 0 5000 10000 15000 20000 25000 30000 35000 40000 45000
Non-chemical waste
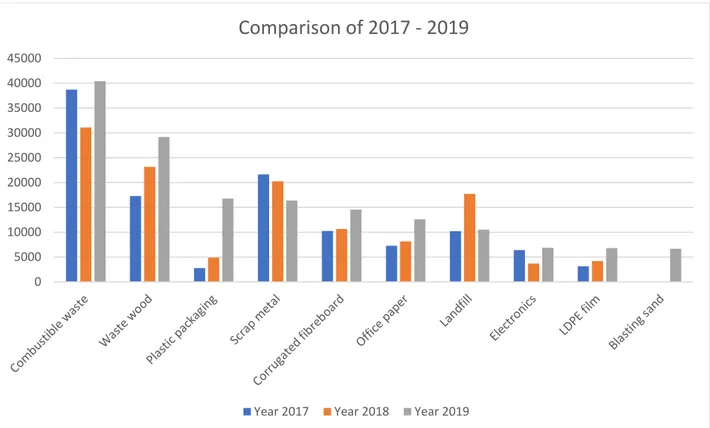
A comparison with year 2017 and 2018 for the then largest fractions are presented in Figure 6 and no relation between number of batches produced and waste generated can be seen.
Figure 6 Ten largest fractions as of 2019 compared with the years 2017 and 2018
4.1.2 Costs
Volume and cost for each disposal method are presented in Figure 7. Incineration or other treatments is the most expensive fraction in total followed by energy recovery, recycling and landfill. To lower these costs actions such as new treatment methods, reusage or reduction need to be implemented. Fractions applicable for new treatment methods might be incineration or other treatments, energy recovery and landfill. Reuse or reduction opportunities might exist for energy recovery and recycling.
0 5000 10000 15000 20000 25000 30000 35000 40000 45000
Comparison of 2017 - 2019
Figure 7 Cost and volume for each disposal method
Table 6 gives an estimation of cost in SEK per kg waste and treatment method with landfill giving the largest quotient of 2.49 SEK/kg waste. It can be seen from the numbers in the table that climbing the hierarchy does not only improve the environmental performance but it also decreases the expenses of the waste management.
Table 6 Cost for each treatment method per kg of waste including handling and transportation Treatment Method Cost (SEK/kg)
Landfill 2.49
Incineration or other treatments 2.31
Energy recovery 1.25
Recycling 1.04
Reuse 0
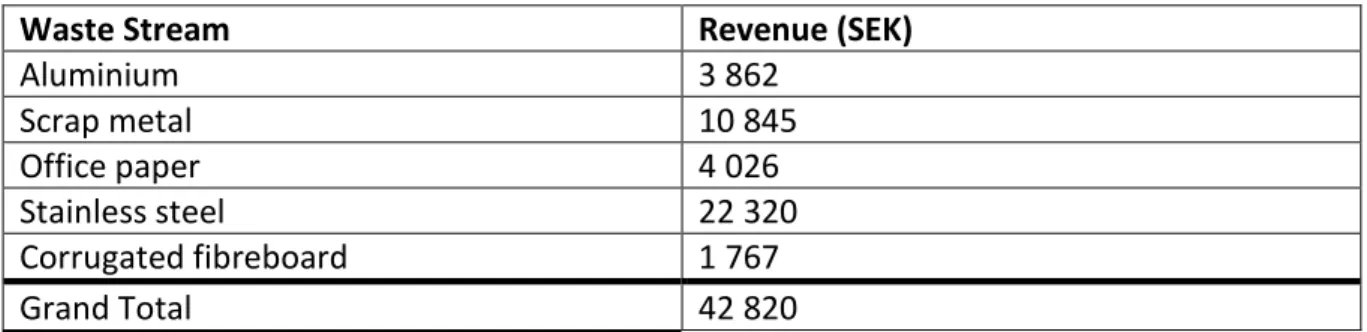
Five waste streams generate a revenue because of its value on the market. In 2019 the total revenue from these waste streams amounted to 42 820 SEK, all values are presented in Table 7. Other costs incurred in the waste management such as a chemist sorting different fractions, rent of equipment and other personnel costs adds up to 673 289 SEK, resulting in a total cost of 3 975 766 SEK including the revenues from the fractions presented in Table 7.
0 500000 1000000 1500000 2000000
Energy recovery Landfill Recycling Reuse Incineration or other treatments
Annual cost and volume vs disposal method
Volume (kg) Annual Cost (sek)
Table 7 Revenue as of 2019
Waste Stream Revenue (SEK)
Aluminium 3 862 Scrap metal 10 845 Office paper 4 026 Stainless steel 22 320 Corrugated fibreboard 1 767 Grand Total 42 820
4.1.3 Key performance indicators and waste metric scoring
The key performance indicators sorting degree (waste sorted divided by total non-chemical waste) and waste per produced unit (total non-chemical waste divided by number of batches produced) are presented in Table 8 for the years 2017 to 2019 and the number of batches produced each year is 295, 146 and 236. Fractions classified as non-sorted are combustible waste, mixed solid waste, mixed scrap metal, landfill, contaminated combustible waste and contaminated laboratory waste. [41]
Table 8 Key performance indicators
KPI 2017 2018 2019
Sorting degree (%) 52.5 51.9 60.5
Non-chemical waste per produced unit (kg/total number of batches)
546 1008 755
Applying the waste management hierarchy metric system and using the equations presented in section 1.1 Waste management hierarchy, results in a scoring value, 𝑆𝑇, of 464, all values are presented in Table 9.
Table 9 Values for waste scoring
Treatment Method Volume (kg) Fraction (𝐹𝑖) Metrics Scoring (𝑆𝑖)
Landfill 10 500 0.004 10 4
Incineration or other treatments 860 863 0.364 8 291
Energy Recovery 733 765 0.310 4 124
Recycling 350 748 0.148 3 45
Reuse 409 268 0.173 0 0
Grand Total 1 846 739 0.999 464
The three largest contributors to the scoring are incineration or other treatments followed by energy recovery and recycling. Incineration and other treatments is the largest contributor because of the amount chemical waste produced during the year and energy is the second largest due to the amount of sludge produced.
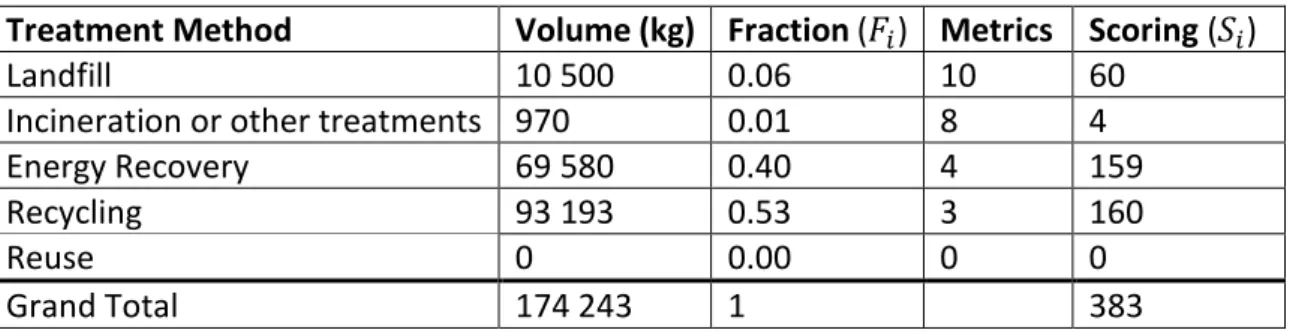
Neglecting the chemical waste and wastewater sludge from the waste metric calculation result in the values given in Table 10 and a scoring value, 𝑆𝑇, of 383. In both cases the scoring value is closest to energy recovery (value of 400) which is in the middle of the waste management hierarchy. The goal is to climb the waste management hierarchy and the next step would be to reach a scoring closer to 300 which would be recycling of the majority of all waste streams.
Table 10 Values for waste scoring neglecting chemical waste and wastewater sludge
Treatment Method Volume (kg) Fraction (𝐹𝑖) Metrics Scoring (𝑆𝑖)
Landfill 10 500 0.06 10 60
Incineration or other treatments 970 0.01 8 4
Energy Recovery 69 580 0.40 4 159
Recycling 93 193 0.53 3 160
Reuse 0 0.00 0 0
Grand Total 174 243 1 383
4.2 Landfill
Applying the waste management hierarchy and the volition to move upwards makes landfill a priority for the company to become a zero landfill site. The amount disposed at landfill was 10 500 kg, only 0.44 % of the total waste. UL Environment have created three different performance tiers, landfill waste diversion (20 % or less to landfill), virtually zero waste to landfill (2 % or less to landfill) and zero waste to landfill (landfill waste diversion of 100 %). [42] According to this classification, the site belongs to the second tier but with further improvements the top tier might be possible to reach.
During a pick analysis (waste composition control) of the landfill fraction in June 4th 2019, the waste management concluded that 87 % belonged to landfill, 7.3 % to combustible waste and the remainder to packaging, household waste and corrugated fibreboard, which shows that by improving sorting, a reduction of the amount disposed at landfill would decrease. The most frequent fraction disposed at landfill is drums for raw material 1, a non-hazardous compound [41] and the drums are made out of cardboard and metal.
4.3 Incineration or other treatments
Incineration or other treatments consists mostly of chemical waste and as stated earlier, other parallel projects are ongoing and therefore this fraction will not be of focus even though it represents 63 % of the waste scoring. The corresponding fractions are presented in Table 11 and 14 out of 15 fractions are classified as chemical waste. Mixed waste and solid laboratory waste may be available for other treatment methods.
Table 11 Waste fractions for incineration or other treatments
Incineration or other treatments R/D code Volume (kg)
Alkali, inorganic D9 105
Alkali, inorganic, tank D9 24 600
Alkali, organic, tank D9 754 160
Mixed waste - 970
Chemicals, sorted D10 1 144
Chemical residues, liquid D10 110
Chemical residues, solid D10 2 199
Laboratory waste, solid, contaminated D10 459
Pharmaceutical residues D10 2 593
Organic chemicals D10 4 920
Chemicals, (< 5 kg/l per package) D10 3 723
Infectious waste D10 1 534
Acid, inorganic D9 129
Acid, organic D9 417
Acid, organic, tank D9 63 800
Grand total 860 863
4.4 Energy recovery
At the next level of the hierarchy there is energy recovery and the belonging fractions are presented in Table 12. During the same pick analysis in June 2019 by the waste management company a sample of combustible waste was made as well. From this fraction only 10 % belonged to combustible waste, 80.8 % to waste wood, and the remainder to corrugated fibreboard. From waste assessment the major fractions are single use products (latex gloves, pipette tips etc.), packaging waste, wiping cloths and filters used for in equipment and facilities.
Table 12 Waste fractions for energy recovery
Energy recovery R/D code Volume (kg)
Combustible waste R1 40 400
Low calorie, heating value <20 MJ/kg R1 8 130
Low calorie, heating value <20 MJ/kg R1 510
Low calorie, heating value <20 MJ/kg, tank R1 9 280
Solvents R1 687
Oily sludge R9 7 840
Oil spill R9 613
Waste wood R1 29 180
Water containing solved inorganic compounds R5 118 720
Sludge R1 518 405
An estimation done by supply chain department shows that the consumption of latex and neoprene gloves are 8 800 every month (4 400 pairs) and the consumption of other safety garments (bouffant cap, beard cap etc.) account for 4 230 articles each month, this sums up to 156 660 single use garments per year.
Low calorie compounds are chemical waste such as solvents with heating value less than 20 MJ/kg. According to the waste management company, the waste oil should be collected for regeneration in order to be used as lubricating oil and by that saving carbon dioxide emissions and reduce the extraction of crude oil. However in this case it is used for energy recovery. [42] Sludge contaminated with oil is also used for energy recovery while it is stated by the waste management company that the oil should be separated and regenerated. [43] Water containing dissolved inorganic compounds is used for energy recovery but is classified as R5 i.e. recycling or reclamation of inorganic compounds.
The sludge is collected by the local receiver and is used in theirs combined heat and power plant to generate electricity. Substances that contributes to the ecotoxicity of the sludge includes arsenic, cadmium, zinc, copper, phenols and polycyclic aromatic hydrocarbons of which all of them are below the threshold to be classified as hazardous, thus the sludge is classified as non-hazardous waste. The ash produced during combustion can be divided into fly ash and bottom ash. The sludge is mixed with waste wood that sometimes contains plastics, painted details and metals which forms hazardous compounds during combustion and therefore the fly ash is classified as hazardous waste. The bottom ash however, is tested every month to ensure that it meets the requirements (non-hazardous) for less sensitive land use i.e. final coverage of landfills and is reused in that sense. No future plans exist for the ash when the coverage of the landfill is completed. According to the local receiver the sludge have 15 % total solids (85 % moisture content), phosphorous content of 38.8 g/kg total solids, 93.8 g aluminium/kg total solids and 19.3 g sodium/kg total solids. [44]
4.5 Recycling
15 % of all waste produced during the year of 2019 was recycled, fractions belonging to recycling are presented in Table 13. All fractions are classified with code R2, R3, R4 or R5 which includes recycling or reclamation of solvents, organic substances, metals and
inorganic substances. However cooling equipment is classified with D12 which is permanent storage (type of landfilling) but still is registered as recycling.
Table 13 Waste fractions for recycling
Recycling R/D code Volume (kg)
Aluminium R4 880
Batteries R4 230
Scrap metal R4 16 369
Blasting sand R5 6 660
Electronics R4 6 866
Packaging, not cleaned R4 214
Glass, coloured R5 1 045.9
Glass, uncoloured R5 1 577.3
Glycol residues R2 982
Glycol residues, packaged R2 103
HDPE R3 517
Inert demolition masses R5 780
Cooling equipment D12 1 150
LDPE film, coloured R3 6 798.5
Fluorescent lamp R4 273
Metal packaging R4 1 022.8
Office paper R3 12 618
Paper, classified R3 1 117
Plastic packaging (hard plastic) R3 16 760
Stainless steel R4 3 760
Sludge with organic compounds R5 256 470
Corrugated fibreboard R3 14 555
Grand total 350 748.5
Recycling is the second highest level of the waste management hierarchy after reuse. From here the only alternative is to reuse or reduce which can make these fractions more complicated to reroute compared with landfill for example which have four other routes (each level of the waste management hierarchy).
4.6 Reuse
Today the only waste stream at the top level of the hierarchy reduce/reuse is ethanol which is used as a solvent in the production of product 1. After it has been used it gets regenerated and then reused, not at the site however because of the requirements of virgin raw material. In 2019 the consumption of ethanol was 409 268 kg. The long-term goal is to reach as high up in the waste management hierarchy as possible and that would be reuse, as of today this level have been reached with one fraction, ethanol and in the future more fractions might be available at this level.
5 Optimisation and recommendations
Opportunities have been identified at all levels of the waste management hierarchy. Potential improvement common for all departments is to increase the personal involvement of the employees to ensure that every fraction is sorted correct. Incentives should also be created so that contractors also sort their waste correctly which simplifies future work and improve the quality of the waste diagnostic work.
The consumption of paper is also something that pertains to the entire site. The amount of paper disposed (not consumed) during 2019 adds up to 13 735 kg, both office paper and classified documents. Assuming a weight of 5 gram per paper this results in 2 747 000 papers for one year or more than 9 100 paper per employee which is just below the average of an office in the US with a consumption of 10 000 papers per employee. Statistics has shown that 30 % of print jobs are never picked up and 45 % is thrown away by the end of the day. [47] [48] If this is the case at the site big improvements can be made. Classified documents are recycled but includes a very high cost compared with regular office paper. The cost for transportation and handling of classified documents was 37 000 SEK for 1 117 kg and the total cost for regular office paper was 3100 SEK for 12 618 kg which results in a cost of 33 SEK/kg and 0.24 SEK/kg respectively. There is possibilities to reduce the paper consumption by promoting less printing and also to reduce the costs substantially by investing in a paper shredder. A collaboration should also be started between the site and the Swedish company Essity who owns the brand Tork. They have started a program called Tork PaperCircle where all paper towels used at a company can be collected for recycling into new soft paper products, reducing carbon dioxide emissions caused by paper towels with up to 40 %. [49]
Recommendations:
Improve sorting at source (engage and educate employees)
Create incentives to make external contractors sort their waste separately Encourage “paperless” office (reduction of waste)
Invest in paper shredders (reduction of costs)
Tork PaperCircle program (energy recovery recycle)
5.1 Supply chain
During the assessment it could be concluded that the combustible waste fraction consists mostly of disposables and plastic packaging. Also from the pick analysis the sorting appears to be poor since at the time, 80 % consisted of waste wood. These fractions are available for another route and thus another treatment method.
In Sweden only 26 % of the plastic waste is recycled and 58 % is used for energy recovery, the remainder is used as fuel in the cement industry or ends up at landfill. Goals set by the European Commission includes by 2030 all plastics placed on the market should be available for reuse or recycling and more than half of the plastic waste is recycled. However, to reach this not only degree of sorting must be improved but also material design and recycling technology. [50] [51] The company’s possibilities includes improvement of sorting and to challenge supplier to use packaging designed for recycling and to remove excess packaging.
Some packaging material might be available to send back to its source. A lot of packaging materials arrives to the site throughout the year and the possibility to send back any containers or supply chain totes would be a good option to reduce waste generated and this might be possible by agreement with supplier.
During 2019 almost 30 tonne of wood waste was generated, mainly from supply chain in form of wooden pallets. Today the waste wood is used for production of energy but an alternative route would be to reuse them. Norrlandspall is a Swedish company that trades and repairs pallets all over the country, handling over 3 million pallets every year. [52] Another company, Uppsala Vatten, launched a new collection program for wood pallets in April 2019. The collected types includes full pallet, half pallet, disposable pallets and pallet collars. [53] Disposable pallets can be reused but it is not always recommended. [54] Due to this further investigations must be conducted to conclude whether the disposable pallets are in good enough condition to be reused or not. If it would not be possible, standard Euro pallet can be used instead thus creating the opportunity of reuse. A life cycle assessment carried out at Chalmers University has shown that the reuse of Euro pallet has advantages over the disposable pallet (used once) in terms of both economic and environmental perspectives. [55] Either way the site can choose to reuse pallets instead of energy recovery resulting in a better environmental impact, a scoring value of zero instead of four and a reduction of the costs associated with this waste fraction. It should also be noted that if waste wood ends up every now and then in the container for combustible waste, as the case during the pick analysis, even greater performance can be reached by reducing the amount combustible waste and increase the amount reused. This action would result in a waste reduction of 16 % of the non-chemical waste, accounting only for disposable pallets.
The waste sent to landfill is mostly containers for raw material 1, a compound that is not classified as hazardous and therefore does not need special handling or treatment. The containers are made out of paperboard with metal frames and could be recycled instead. Resulting in a score value of 3 instead of 10 and also improves the possibility to become a zero landfill site. The reason for using landfill as method today is because it is too hard to separate the frame from the containers and if no solution is available a discussion should be considered with the supplier to change the type of packaging.
Recommendations:
Return-system for disposable pallets (energy recovery reuse) Include EUR-pallets in the reports (increased fraction of reuse) Supplier take-back program (energy recovery/recycle reuse)
Recycle or challenge supplier to change packaging for raw material 1 (landfill
5.2 Manufacturing processes
The greater part of the waste generated at the production is disposables, glass and plastics. The material-locks are used to transfer objects from a contaminated area into a cleanroom classified area and the purpose of multiple packaging is to remove the outer layer inside each gate. However at all departments where these gates are used, all goods are sterilised using ethanol and the idea of multiple packaging is of no use. So as stated earlier the company can challenge the supplier to remove all secondary packaging since only the primary packaging serve a purpose. Sometimes products have two or even up to three layers of packaging and if it is possible to remove these excess layers a great reduction can be achieved in terms of packaging waste at the different production departments. Some deliveries, citric acid for example, arrives in 15 smaller packs instead of one larger and that is also an opportunity to reduce the amount of waste by increasing the size of packages. The plastic bags used as packaging for raw material 1 should be sorted for recycling since it is a non-hazardous compound.
As mentioned the clothes used in classified zones are packed in plastic bags as of new directions from the Swedish MPA. At some departments these specific bags are sorted separately for recycling and at others as combustible waste. The clothes are collected outside the personnel-lock and by moving them inside there might be a possibility to get rid of the packaging used today.
Recommendations regarding disposables are brought up in section Error! Reference source
not found. Error! Reference source not found..
What might be worth to investigate further is the need for the excess chemicals produced for every at production 1 which accounts for 45 litres chemical waste per batch.
Recommendations:
Challenge supplier to remove excess packaging (reduction) Order larger packages instead of several small ones (reduction) Sort soft plastic separately (energy recovery recycle)
Plastic bags for raw material 1 are not classified as hazardous waste and might be
possible to recycle instead (energy recovery recycle)
Investigate the possibility to move clothing inside personnel-lock to avoid the plastic
packaging (reduction)
5.3 Laboratories
During the assessment it could be concluded that the sorting, at laboratory 1, turned out to be poor and that has to be improved. Different fractions were mixed both at the department and at the collection point and the cause of this is low personal involvement. It is important for the company to make sure that all personnel are educated and have the right competence within the area since they are a key component in the whole process.
Because of the GMP requirements and convenience a lot of disposable products are used. These products are essential for the everyday work and can therefore not be abandoned. The