ii
Mälardalen University
School of Innovation, Design and Engineering
Västerås, Sweden
Thesis for the Degree of Master of Sciences in Software Engineering
30.0 Credits
A Method and Tool for Automated
Analysis of Heavy Vehicle Requirements
Trevor Jagerfield
tjd12001@student.mdh.se
Examiner: Cristina Seceleanu
Mälardalen University, Västerås, Sweden
Supervisor: Predrag Filipovikj
Mälardalen University, Västerås, Sweden
Scania, Södertälje, Sweden
Supervisor: Guillermo Rodriguez-Navas
Mälardalen University, Västerås, Sweden
iii
Abstract
The introduction of the functional safety standard ISO 26262 was motivated by an increasing demand to ensure reliability and correctness of safety-critical systems in the automotive industry. However, the adoption of this standard in the automotive industry is hindered by a number of obstacles. Scania is an industrial partner in the VeriSpec project which studies these obstacles and proposes relevant tools and methods compliant with academic and industrial needs. This thesis is within the scope of the VeriSpec project, and aims to address one of the project’s goals, which is to provide tool support for a pattern-based requirement formalization process. The Specification Property System (SPS) proposed by Konrad and Cheng is a patterning method that provides automatic translation of system properties into temporal logics. The SPS also helps in restricting the introduction of ambiguities and inconsistencies in system specification properties. However, the adoption of the SPS in the industry is hindered due to some issues. These issues are, a long learning curve, Constrained Natural Language (CNL) ambiguities, and the lack of tool-support for real-time SPS patterns. In this thesis, a qualitative research study with a literature survey has been performed to find and select state-of-the-art supportive methods to provide feedback on the formalized requirements’ semantics. The Scania Specifier tool has been extended and modified to support a requirement formalization process using the SPS qualitative and real-time patterns. In addition, three supportive methods that resulted from the research study have been integrated into the Specifier tool to provide different feedback options for the users. Finally, the performance of the Specifier tool and the feedback of the supportive methods have been evaluated. The outcome of the study shows that the feedback of the supportive methods helped in guaranteeing the intended behavior of the requirement developers. In addition supportive methods’ feedback enhanced user-friendliness, and aided the users in shortening the SPS learning curve. Finally, an additional outcome of the study is in the form of a number of suggestions and emerged patterns with regard to the SPS usage and supportive methods’ feedback.
iv
Acknowledgments
I am deeply grateful to Predrag Filipovikj my supervisor at MDH and Scania for his valuable insights, and crucial feedback throughout the thesis process. This thesis would not have been possible without his guidance and support. I am also grateful to Dr. Guillermo Rodriguez-Navas for his support and for providing valuable feedback on my thesis.
I would like to thank Dr. Cristina Seceleanu the examiner at MDH for her correction of the thesis, and for approving this work. I would also like to thank my teachers at MDH IDT for the high quality education they provided.
I would like to express my gratitude to Dr. Mattias Nyberg at Scania for providing me with the opportunity to do this thesis, and for his support while I was at Scania. It has been a pleasure working with Engr. Anton Einarson and PhD Student Jonas Westman at Scania, and I am thankful for their guidance and help. I would also like to thank the Scania employees and thesis students who took part in the case study for providing valuable information that helped make this work a success.
Finally, I would like to thank my family and my good friend Sue Lee who supported and encouraged me all the time.
v
Table of Contents
Abstract ... ii
Acknowledgements ... iii
Table of Contents ... v
List of Figures ... viii
List of Tables ... ix
List of Abbreviations ... x
Chapter 1 Introduction ... 1
1.1. Background and Thesis Motivation ... 1
1.2. Problem Statement and Research Questions ... 2
1.3. Thesis Objectives ... 3
1.4. Overview of the Thesis Research Methodology and Implementation ... 4
1.5. Limitations and Delimitations of the Study ... 4
1.6. About Scania ... 4
1.7. Outline of the Thesis ... 5
Chapter 2 Preliminaries ... 6
2.1. Formal Verification (FV) ... 6
2.2. Specification Pattern System (SPS) ... 8
Chapter 3 Study Design and Methodology ... 12
3.1. Selecting the Study Methodology and its Approach ... 12
3.2. Data Collection Procedures ... 13
3.3. Sample Selection Procedures ... 13
3.4. Data Analysis Procedures ... 14
3.5. Validation and Evaluation Procedures ... 15
Summary ... 15
Chapter 4 Supportive Methods ... 16
4.1. Supportive Methods from the Literature Survey ... 16
4.1.1. A Graphical Property Specification Language ... 16
vi
4.1.3. Runtime Monitoring Framework for Property Specification Patterns ... 20
4.1.4. Use Case Maps Property Pattern System ... 21
4.1.5. Template Based Approach for Temporal Logic Visualizing ... 22
4.1.6. Finite State Automata Property Pattern Templates ... 25
4.2. Supportive Methods from the Preliminary Interviews Feedback ... 26
4.2.1. Modified Timing Diagram ... 26
4.3. Supportive Methods Features Comparison Table ... 27
Summary ... 27
Chapter 5 Case Study Implementation and Findings ... 29
5.1. Case Study Implementation Procedures ... 29
5.1.1. Literature Survey ... 29
5.1.2. Case Study Material Preparation ... 30
5.1.3. Preliminary Interviews ... 32
5.1.4. Case Study Interviews ... 33
5.2. Case Study Findings ... 34
5.2.1. Preliminary Interviews Results ... 34
5.2.1.1. Adding the Modified Timing Diagrams (MTD) Method ... 35
5.2.1.2. User-guidance Supportive Method ... 36
5.2.2. Case Study Interviews Results ... 36
5.2.3. Case Study Discussions, Analysis and Conclusions ... 39
5.2.3.1. Pattern I. Role of SPS experience in Supportive Methods Selections ... 39
5.2.3.2. Pattern II. Difficulties with some SPS Patterns and Temporal Operators ... 40
5.2.3.3. Pattern III. Interviewees Biased Selection Tendencies ... 41
5.2.3.4. Interviewees Suggestions and Study Observations ... 41
5.2.4. Case Study Account ... 42
Summary ... 42
Chapter 6 The Scania Specifier Tool ... 43
6.1. Specifier Modifications and Extensions ... 43
6.1.1. Pattern Information and Views Window ... 43
6.1.2. The Edit/Add Requirement Window ... 44
6.2. Evaluation of the Specifier Tool SPS Support ... 47
6.2.1. The Evaluation Events ... 47
6.2.2. Final Evaluation Results and Discussions ... 48
vii Chapter 7
Related Work ... 50
7.1. Related SPS Supportive Tools ... 50
7.1.1. Property Elucidation (PROPEL) ... 50
7.1.2. Property ASSistant (PASS) ... 50
7.1.3. Property Specification (Prospec) ... 50
7.1.4. CHARMY ... 51
7.2. SPS Supportive Tools Comparison ... 51
Summary ... 53
Chapter 8 Conclusions and Future Work ... 55
8.1. Conclusions ... 55
8.2. Future Work ... 57
References ... 58
Appendices ... 62
A. Modified LR SPS Pattern Semantics Representations... 63
B. Template Based Diagram SPS Pattern Semantics Representations ... 67
C. Modified Timing Diagram SPS Pattern Semantics Representations ... 72
D. Case Study Questionnaire ... 75
D.1. Introduction ... 75
D.2. Assignments ... 75
D.2.1. Formalizing Requirements ... 75
D.2.2. Select the Pattern that Conveys the Correct Requirement Behavior ... 76
D.3. Questions ... 76
E. Demo-Day Scenario ... 77
viii
List of Figures
Figure 2.1: Verification Overview [26]. ... 6
Figure 2.2: Model Checking Method [28]. ... 7
Figure 2.3: Qualitative Property Patterns Hierarchy. ... 8
Figure 2.4: Property System Patterns Scopes [8]. The diagram is further enhanced with text to illustrate where patterns can hold or not hold. ... 9
Figure 2.5: SPS Classification [12]. ... 10
Figure 2.6: Requirement Patterning Comparison Table [17]. ... 10
Figure 3.1: Data Collection Cycle by Creswell [33]. ... 13
Figure 3.2: Data Analysis Spiral by Creswell [33]. ... 14
Figure 4.1: Simple LR Real-Time Cause-Effect Relation [46]. ... 17
Figure 4.2: MLR Representations of the Response Pattern. This Figure shows a Textual Approach to Address CNL Ambiguities. ... 18
Figure 4.3: RTGIL Representations of a Response Pattern [50]. ... 20
Figure 4.4: Response Pattern Semantics Represented in USD [52]. ... 21
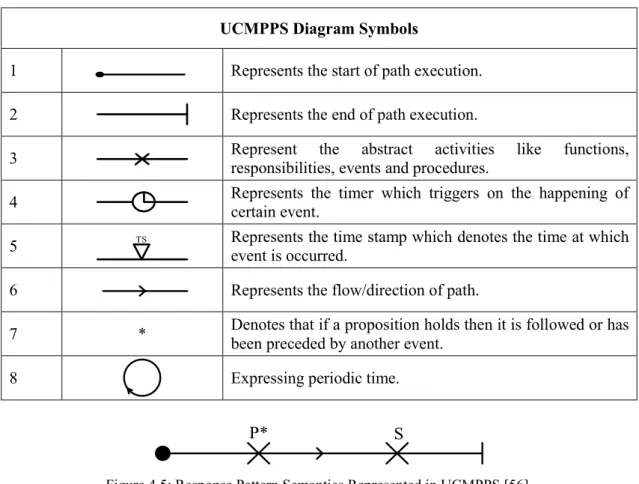
Figure 4.5: Response Pattern Semantics Represented in UCMPPS [56]. ... 22
Figure 4.6: Tracing the Response Pattern through the TBATLV Template Flow-Diagram. ... 24
Figure 4.7: FSAPPT Representation of the Response Pattern. ... 26
Figure 4.8: Example of an MTD Representations of a Response Pattern. ... 27
Figure 5.1: Case Study Design Diagram. ... 31
Figure 5.2: Preliminary Interviews Structure. The Interviews used the Interview Protocol. ... 32
Figure 5.3: Case Study Interviews Structure. The Interviews used the Interview Protocol. ... 34
Figure 5.4: Simple Example Explaining the Response Pattern. ... 35
Figure 5.5: Simple Example Explaining the Precedence Pattern. ... 36
Figure 5.6: Graphical Representation of Interviewees Final Supportive Methods’ Selections. .. 39
Figure 5.7: UCMPPS Representation of the Precedence Pattern. ... 41
Figure 6.1: Pattern Information and Views Window. Adding a Pattern to the Pattern List. ... 43
Figure 6.2: Pattern Information and Views Window. Adding Views to a New Pattern. ... 44
Figure 6.3: Requirement Patterning using the Globally Scope and the Response Pattern with Empty Proposition Fields. ... 45
Figure 6.4 : Requirement Patterning using the “Between Q and R” Scope and the Real-time Bounded Response Pattern. ... 46
Figure 6.5: Pattern User-Guidance. ... 46
Figure 6.6: Scope User-Guidance. ... 47
Figure A.1: MLR Representations of Different Patterns with Response Semantics. These Figures show a Textual Approach to Address CNL Ambiguities. ... 63
Figure A.2: MLR Representations of Different SPS Patterns with Precedence Semantics. These Figures show a Textual Approach to Address CNL Ambiguities. ... 64
Figure A.3: Occurrence Pattern Semantics Representation in MLR. ... 65
Figure A.4: Real-Time Pattern Semantics Representation in MLR. ... 66
Figure B.1: TBATLV Diagram of the Main Branch in the Flow-Diagram. ... 67
Figure B.2: TBATLV Diagram of the Real-Time Patterns Branch. ... 68
Figure B.3: TBATLV Diagram of the Qualitative Patterns Branch. ... 69
Figure B.4: TBATLV Diagram of the Order Pattern Branch. ... 70
Figure B.5: TBATLV Diagram of the Pattern Scopes. ... 71
Figure C.1: MTD Representation of the Precedence Pattern - The Cause S Precedes and Stimulates the Effects V, T and P. This Figure shows A Graphical Approach to Address CNL Ambiguities. ... 72
Figure C.2: MTD Representation of the Response Pattern with “After Q” Scope - The Pattern Always Holds After the First Occurrence of Q but Not Before it. This Figure shows A Graphical Approach to Address CNL Ambiguities. ... 73
ix
Figure C.3: MTD Representation of the Response Pattern with the “Before R” Scope - The Pattern Always Holds Before the First Occurrence of R but Never After it. This Figure shows A
Graphical Approach to Address CNL Ambiguities. ... 74
List of Tables
Table 2.1: Dwyer et al. Patterns’ Categories and Patterns’ Descriptions [8] ... 9Table 4.1: LR Graphical Notation. ... 17
Table 4.2: MLR Notation Diagram Symbols. ... 18
Table 4.3: RTGIL Method Diagram Symbols... 19
Table 4.4: UCMPPS Diagram Symbols. ... 22
Table 4.5: FSA Property Pattern Templates Graphical Notation. ... 25
Table 4.6: Supportive Methods Feature Comparison Table. ... 28
Table 5.1: Preliminary Interviews Participants List ... 32
Table 5.2: Case Study Interviews Participants List ... 33
Table 5.3: Preliminary Interviews Questionnaire Results. ... 34
Table 5.4: Interviewee Final Supportive Methods’ Selections. ... 39
Table 6.1: Specifier Tool Evaluation Results. ... 48
Table 7.1: SPS Tool Comparison Table. ... 53
Table F.1: Scania Requirements used for Specifier Tool Evaluation. These Requirement are taken from Westman and Nyberg [65]. ... 78
x
List of Abbreviations
E/E Electrical and Electronic
FV Formal Verification
VeriSpec Structured Specification and Automated Verification for Automotive Functional Safety
SPS Specification Pattern System
CNL Constrained Natural Language
PROPEL Property Elucidation
PASS Property ASSistant
Prospec Property Specification
RESA Vehicle electrical Architecture and Chassis System Software
LTL Linear Temporal Logic
CTL Computational Tree Language
TCTL Timed Computational Tree Language
LR Graphical Property Specification Language
MLR Modified Graphical Property Specification Language
RTGIL Real-time Graphical Interface Logic
GIL Graphical Interface Logic
FIL Future Interval Logic
RTFIL Real-time Future Interval Logic
RMF Runtime Monitoring Framework
UML Unified Modeling Language
USD UML 2.0 Sequence Diagram
FSA Finite State Automata
UCMPPS Use case maps property pattern system
ArTCTL Architectural Timed Computational Tree Language
TBATLV Template Based Approach for Temporal Logic Visualization
FSAPPT Finite State Automata Property Pattern Templates
MTD Modified Timing Diagrams
TD Timing Diagrams
KTH Kungliga Tekniska Högskolan
DNL Disciplined Natural Language
QT Question Tree
xi
Promela Protocol Meta Language
SPIN Simple Promela Interpreter
1
1. Introduction
The automotive industry is witnessing an increasing dependency on software systems. Software is becoming an integral part of the Electrical and Electronic (E/E) systems leading to escalating systems’ complexity and failure probability. At the same time, the software systems developed in the automotive industry are increasingly being labeled as safety-critical systems, whose failure can cause loss of life. As a result, there is a growing demand in automotive industry to ensure the reliability and correctness of safety-critical software systems [1, 2].
1.1.
Background and Thesis Motivation
The road vehicles' functional safety standard ISO 26262 [3] is a standard introduced to address concerns regarding safety-critical software systems in the automotive industry. The standard promotes applying Formal Verification (FV) techniques at every level of system abstraction in an aim to reduce the functional safety concerns to a tolerable level [4, 5]. FV exhaustively and automatically checks system correctness to ensure the exclusion of undetected failures in the system’s behavior. FV is therefore gaining an increased attention because it addresses system property ambiguities, ensures quality, and minimizes failure probabilities [5-7]. However, adopting the ISO 26262 is being hindered in the automotive industry due to a number of issues. These issues are, such as, lack of expertise in formal notation, lack of tool support and system specification ambiguities [5, 8].
Scania is a leading manufacturer of heavy-vehicles, and it allocates large resources to ensure the quality and safety of its products. Scania along with Volvo, and Mälardalen University started the Structured Specification and Automated Verification for Automotive Functional Safety (VeriSpec) project. The VeriSpec project is funded by VINNOVA, which is a Swedish government agency that manages programs aiming to strengthen Sweden’s innovativeness [9]. The VeriSpec project aims to facilitate the adoption of the ISO 26262 standard in the automotive industry by introducing FV at different levels of the development process. The VeriSpec project’s main research goals address two aspects of the ISO 26262 standard. The first goal is to define a pattern-based method for specifying safety relevant functional requirements, and providing tool support for formalizing qualitative and real-time requirements. The second goal is to provide an automated FV using model checking. The VeriSpec project studies the challenges hindering the adoption of the ISO 26262 standard and proposes solutions complaint with industrial and academic needs [10]. To formally specify system requirements by manually writing formal notations that describe requirements’ behaviors is a process which requires advanced expertise in formal notations. However, such expertise are hard to find in the industry, and are expensive to learn in terms of money and time. In addition, it is difficult to find good training material for formal specification, which is a very precise and an error-prone process [8]. One method to overcome these issues is a pattern-based approach proposed by Dwyer et al. [8] called the Specification Pattern System (SPS). The Dwyer et al. SPS consists of a set of high-level, formalism-independent abstract property patterns representing commonly recurring qualitative system property behaviors. It facilitates the formal specification process by addressing the issue of lack of expertise in formal languages in the industry. However, the Dwyer et al. SPS does not support real-time system properties and lacks a textual interface to enhance user friendliness [8, 11].
Konrad and Cheng [12] extended the Dwyer et al. SPS by the addition of real-time patterns and the Constrained Natural Language (CNL). The extended SPS1 can therefore express system properties' behaviors in both formal notations and CNL. CNL is an informal textual interface
2
mapped to relevant SPS qualitative and real-time patterns, and it facilitates the use of the SPS by hiding patterns’ formalism [13]. However, Filipovikj et al. [5] identified a number of issues that are hindering the adoption of the SPS in the industry, such as, a long learning curve, CNL ambiguities, and lack of tool support for the SPS real-time patterns. Using the SPS requires a learning curve to get efficient in using the correct SPS patterns and scopes [5, 10]. CNL ambiguities cause difficulties in understanding the correct behaviors of the requirements formalized using the SPS. As a result, requirement developers have to refer to the formal notations of the SPS patterns in order to understand their correct temporal behaviors. Lack of tool support was identified by both Filipovikj et al. and Rodriguez-Navas et al. [10] who emphasized the need for tool support to facilitate a Konrad and Cheng SPS based requirement formalization process.
1.2.
Problem Statement and Research Questions
The scope of this thesis is within one of the VeriSpec project’s main contributions, which targets the automated generation of pattern-based formal specification [10]. A number of tools such as the Property Elucidation (PROPEL) [11], Property ASSistant (PASS) [14], Property Specification (Prospec) [15], and CHARMY [16], have already been proposed by researchers to assist engineers in the process of formal specification. However, none of these tools supports the specification of time system properties. A pattern-based method which supports both qualitative and real-time patterns is the SPS proposed by Konrad and Cheng. The expressiveness of the SPS was tested on functional requirements in the automotive industry in at least two case studies with satisfactory results [5, 17]. Filipovikj et al. stated that using the SPS helps to reduce the formalized requirements’ ambiguity, improves its testability and promotes communication between stakeholders. However, Filipovikj et al. identified a number of issues hindering the acceptance of the SPS in the industry, such as, a long learning curve, CNL ambiguities, and lack of tool support for the SPS. As a solution for the first two issues, Filipovikj et al. proposed providing supportive material as feedback on the formalized requirements' semantics. With regard to the third issue, both Filipovikj et al. and Rodriguez-Navas et al. stressed the need for a user-friendly SPS-based tool to automate the requirement formalization process [5, 10].
The Specifier is a Scania specific tool developed as part of the ESPRESSO project which is a collaboration between the Kungliga Tekniska Högskolan (KTH) and Scania. ESPRESSO aims to improve the process of developing embedded systems by enhancing the development process quality, and reducing its costs [18, 19]. The goal of the Specifier tool is to provide a model-based solution for improving the efficiency of document management. The Specifier tool implements the contract structure proposed by Westman and Nyberg[20], and allows a hierarchical and traceable requirements' structure compliant with the ISO 26262. Hence, the Specifier tool is capable of supporting Safety Goals, Functional Safety Requirements, Technical Safety Requirements, and Hardware and software requirements [21, 22].
This thesis problem statement is based on the issues identified by both Filipovikj et al. and Rodriguez-Navas et al., which were mentioned earlier in this section. Addressing these issues requires first finding state-of-the-art supportive methods that provide feedback on the formalized requirements’ semantics. The next step is to evaluate users’ (engineers) preferences with regard to supportive methods' performance in representing formalized requirements’ semantics. Furthermore, the Specifier tool has to be extended to provide support for qualitative and real-time SPS formal specification. In addition, a number of supportive methods preferred by the engineers have to be integrated into the Specifier tool. Finally, the performance and user-friendliness of the modified Specifier tool have to be evaluated with regard to supporting a qualitative and real-time SPS requirement formalization process. The evaluation should also assess the effectiveness of the supportive methods’ feedback in helping to guarantee that the formalized requirements’ semantics match the intended behavior of requirement developers.
3 The main research question of this thesis is:
What is required to provide tool support for an SPS requirement formalization process aided with state-of-the-art supportive methods’ feedback on the formalized requirements’ semantics? The main research question of this thesis is further divided into five sub-questions (RQ1-RQ5):
RQ1: Based on the current state-of-the-art, which existing methods can provide relevant feedback about formalized requirements’ semantics to the requirement developers? RQ2: What state-of-the-art supportive methods are preferred by the engineers based upon the feedback provided by the supportive methods on the formalized requirements’ semantics?
RQ3: What changes should be introduced into the Specifier tool to support a user-friendly qualitative and real-time SPS requirement formalization process?
RQ4: What is the best way to provide requirement developers with supportive methods’ feedback using the Specifier tool?
RQ5: In which way should the modified Specifier tool be evaluated regarding SPS requirement formalization process, user-friendliness, and the effectiveness of the supportive method’s feedback?
1.3.
Thesis Objectives
The main objective of this thesis is to provide tool support for an SPS requirement formalization process, and to provide supportive methods’ feedback on the formalized requirements’ semantics. This objective is further divided into three sub-objectives that address the thesis problem statement sub-questions (RQ1-RQ5). The first sub-objective addresses both RQ1 and RQ2, and is concerned with finding supportive methods that can provide feedback on the formalized requirements’ semantics and selecting the supportive methods that can provide the best feedback. RQ1 is addressed by conducting a literature survey to find state-of-the-art supportive methods for providing the feedback. RQ2 is addressed by conducting a study to evaluate the feedback of the supportive methods with regard to help in guaranteeing that the formalized requirements’ semantics match the intention of the user.
The second sub-objective is to provide tool support for a requirement formalization process using the SPS qualitative and real-time patterns, and to integrate supportive methods into the Specifier tool. This sub-objective addresses both RQ3 and RQ4 of the problem statement of this thesis. RQ3 is addressed by extending and modifying the Scania Specifier tool so as to support a requirement formalization process based on the SPS qualitative and real-time patterns. RQ4 is addressed by integrating one or more supportive methods selected from the research study into the Specifier tool.
Finally, the third sub-objective addresses RQ5. The third sub-objective aims to evaluate the performance of the tool support and the feedback provided to the requirement developers in facilitating the requirement formalization process. The evaluation will be achieved by asking a number of participants for their feedback with regard to formalizing a number of Scania requirements using the Specifier tool.
4
1.4.
Overview of the Thesis Research Methodology and Implementation
An academic research approach has been followed, and practical implementation has been performed to achieve the objective of this thesis. The academic research approach consisted of a qualitative research study with a literature survey. The literature survey was conducted to find state-of-the-art supportive methods, and criteria were applied to filter the results. The resulting supportive methods were then prepared, and a qualitative research methodology was defined. The research methodology was implemented as a case study approach to explore opinions, collect observations and feedback from participants in the study.
Practical implementation involved extending and modifying the Scania Specifier tool to support a requirement formalization process using the SPS qualitative and real-time patterns. The implementation also included integrating a number of supportive methods that resulted from the case study. Finally, the modified Specifier tool was evaluated to assess the performance of the tool support, and the feedback provided to the requirement developers.
1.5.
Limitations and Delimitations of the Study
Study limitations describe the conditions that cannot be controlled by the author and therefore, restrict the scope of the study and affect its outcome [23]. The main limitation identified in this study was the limited time available to introduce the SPS and the supportive methods to the Scania interviewees. Consequently, the interviews had to be planned so as to both provide a brief introduction segment and collect the data in short interview sessions. As a result of this limitation, Scania engineers had only basic knowledge and limited exposure to the SPS and supportive methods, which influenced their supportive methods’ selections. On the other hand, this limitation provided a valuable opportunity to collect data regarding their experiences in using the SPS. Study delimitations are the boundaries set by the author to define a manageable scope for the study and constrain its result generalizability [23]. Delimitation actions were taken regarding the supportive methods that resulted from the literature survey, which did not comply with the defined filtering criteria. None of the state-of-the-art supportive methods resulting from the literature survey addressed the CNL ambiguity issues. In addition, some of the state-of-the-art supportive methods did not provide some or any of the SPS pattern representations. As a result, three delimitation actions had to be taken. In the first action, exemptions from the literature survey criteria were made in order to include these supportive methods into the study. Second, three supportive methods that would have been otherwise excluded from the study, were modified and the modifications included addressing the CNL ambiguities. The purpose of including these three supportive methods was to illustrate the CNL ambiguities to the study participants, and to get their reaction towards these attempts. The third action was to make SPS pattern representations for some of the supportive methods. These delimitation actions resulted in including more supportive methods into the study, however, implementing these actions was both time and effort consuming.
1.6.
About Scania
This master thesis was performed at the Vehicle electrical Architecture and Chassis System Software (RESA) department at the Scania Technical Centre in Södertälje, Sweden. RESA is a group within Scania responsible for the electrical/electronic systems and their architecture in trucks. Scania is a leading heavy-vehicle manufacturer founded in 1891 in Sweden with the objective of providing optimized products such as, trucks, buses and heavy engines to the customers. Scania is an international organization operating in more than 100 countries around the globe. There are over 35,500 employees working for Scania in three main departments, sales, production and research [24].
5
1.7.
Outline of the Thesis
The rest of this thesis is organized as follows:
Chapter two presents information with regard to the preliminary techniques which are important for the thesis. Chapter three defines and discusses the study methodology applied, and the procedures followed in this thesis. Chapter three presents details about the research methodology and its inquiry approach, data collection, sample selection, data analysis, and the research validation and evaluation procedures. Chapter four provides a brief introduction to seven supportive methods and explains their graphical notations with examples. Chapter five presents the case study implementation and findings. The implementation section presents the literature survey, case study material preparation, preliminary interviews, and interviews. The findings section presents the interviews’ results followed by the discussions and analysis on the findings. Chapter six briefly presents a number of existing related tools that support the Dwyer et al. SPS requirement formalization process. In addition, this chapter also provides a presentation on the implementations introduced on the Scania Specifier tool to support an SPS requirement formalization process aided with supportive methods’ feedback. The final section in Chapter six presents the advantages of the Scania Specifier tool comparing it with other related tools mentioned in this thesis. Chapter seven presents the conclusions and future work of the thesis. Finally, appendices A, B, and C contain SPS representations which the author made for three supportive methods. Appendices D, E, and F contain the case study questionnaire, demo-day scenario, and the Scania requirements used for evaluating the Specifier tool, respectively.
6
2. Preliminaries
This chapter briefly presents background information on the technologies necessary for understanding this thesis work. The presented technologies are FV, and the SPS proposed by Dwyer et al. and then further extended by Konrad and Cheng.
2.1.
Formal Verification (FV)
During the system development process, almost 75% of the total effort is allocated for the verification and debugging of the development process. The system verification process is expensive, and it even becomes more resource-exhaustive as the complexity of the system increases. Figure 2.1 shows an overview of functional verification, which consists of the following techniques: simulation, FV, and hardware emulation. Simulation is a simple and a commonly practiced technique for system verification in which output values are monitored for a given input data sequence. The simulation technique works fine for the simpler systems; however, it is not preferred for the more complex systems due to a number of drawbacks. Among these drawbacks are time and resource consumption, late application in the development process, and vulnerability to human error since it is usually performed manually [25, 26].
Another technique in system verification is FV, which identifies system issues related to property ambiguities, and inconsistencies [27]. FV has a number of important features, such as its high automation and exhaustive system state exploration. In addition, another significant feature of FV is that it can be applied at the early stages of the development process [2, 6].
Functional Verification
Simulation Hardware
Emulation Formal Methods
Arithmetic
Verification Property Checking
Equivalence Checking Symbolic Trajectory Evaluation Symbolic Model Checking Language Containment Theorem Prover
Figure 2.1: Verification Overview [26].
FV uses mathematical proof to prove or disprove the system’s functional correctness [2, 6]. The process checks the conformance of the system’s formal model against its formally specified properties [28]. There are a number of FV techniques, and they are grouped into three main categories [26]:
Arithmetic verification: It proves or disproves that an implementation is fulfilling its design purpose operation-wise.
7
Property checking: It proves or disproves that a design satisfies the intended behavior. This category can be further divided into several models, each providing its own formalism method and FV procedure. These models are: theorem proving, model checking, language containment, and symbolic trajectory evaluation.
Equivalence checking: It proves or disproves the functional equivalence of two given system designs.
A prerequisite for formalizing a system’s properties is ensuring the correctness of the system specification. In fact, the lack of an accurate system specification is one of the obstacles hindering the adoption of methods such as the SPS in the industry [5]. Lamsweerde [29] defined criteria for a correct system specification. According to these criteria, a specification has to be adequate, unambiguous, complete, internally consistent, and finally, correctly satisfied by its lower-level properties. An adequate and unambiguous specification, is a specification that correctly represents the system properties' behavior, and has no more than one interpretation. A complete specification correctly describes both the properties’ decomposition to their lower-level properties, and the properties’ composition of their higher-level sources. Finally, an internally consistent system specification means that the semantic behavior of all system properties will remain correct when combined together [29].
Real-Time System Requirements
Counter Example Yes
Requirement Specification (Desired Behavior) Verifier Model of System (Possible Behavior) Done Modelling Formalizing Check Next Modify Refine
Figure 2.2: Model Checking Method [28].
The FV technique of interest in the VeriSpec project which this thesis is part of is the model checking method [10]. This method uses a tool called the Verifier to perform model checking. The Verifier is based on a state-space search method which explores each system state and checks, whether it satisfies a desired property behavior or not. The model checker shown in Figure 2.2 takes a system’s formal model and its formal specification as inputs. The model checker afterwards determines all the potential reachable system states, including deadlock states where no further progress is possible. If the model conforms to the specification, then the Verifier returns
8
“true” otherwise, it returns “counter example”. The Counter Example provides the details of the mismatch, which are then analyzed. Based on the analysis, the causing errors can be found and corrected. The automated model checker makes it easy to re-check the modified properties against the system’s formal model [25, 28, 30].
2.2.
Specification Pattern System (SPS)
Requirements written in natural language might not capture all the necessary information required for describing the correct behavior of the system [5]. Nevertheless, requirement developers prefer using natural language to specify requirements over formalizing them with formal notations, which promote unambiguity. The reason is that natural language is easier to use in comparison to the more rigorous temporal logic used in formal specification [31]. The lack of expertise in using formal notations was one of the obstacles identified by Dwyer et al. that were hindering the use of FV in the automotive industry. Another obstacle identified by Dwyer et al. was the lack of supportive tools [8, 31].
Dwyer et al. studied a number of functional qualitative requirements written in natural language, and noticed reoccurring behaviors, and categorized them into patterns. Figure 2.3 shows the hierarchy of the qualitative patterns proposed by Dwyer et al. The patterns are classified according to their semantics, and are grouped into three main categories Occurrence, Order, and Compound. Patterns in the Occurrence category describe properties that are dependent on the occurrence of certain states or events within a defined scope. Order category contains patterns that describe a cause-effect relation between a pair of states or events within a defined scope. Compound category contains Chain Precedence and Chain Response patterns within a defined scope. Another type of Compound patterns is the Boolean pattern which combines patterns using Boolean operators. Table 2.1 presents the patterns different categories with patterns’ descriptions.
Figure 2.3: Qualitative Property Patterns Hierarchy.
The Dwyer et al. SPS patterns are high level, formalism-independent, and abstract property patterns, which can be mapped to different formal notations. Based upon these patterns, Dwyer et al. proposed the SPS where, property patterns mapped to formal notations are used to represent a requirement formally in terms of behavior and scope. Each SPS pattern consists of literal and non-literal terminals. The literal terminal is surrounded by quotation marks, describes the pattern behavior, and is not changeable, while the non-literal terminals represent Boolean propositions or time constraints. The Dwyer et al. SPS scopes are shown in Figure 2.4, and they represent the extension of the program execution where a behavior is expected to hold. Using Dwyer et al. SPS, developers can formalize requirements without the need to write formal notations. However, in order to use the Dwyer et al. SPS efficiently, it is necessary that developers receive sufficient training [8].
9
Table 2.1: Dwyer et al. Patterns’ Categories and Patterns’ Descriptions [8].
No hold No hold Hold Hold R Q Q R Q R Q R Q R Q Q R Q R Q Scopes Num Type 1 2 3 4 5 System States Globally Before R After Q Between Q and R After Q until R
Pattern can hold through out system execution.
Pattern can hold from the start of the program till R.
Pattern can hold from Q till end of the program.
Pattern can hold between an occurrence of Q and occurrence of R.
Similar to 4, but the pattern must hold even if R never occurs.
Figure 2.4: Property System Patterns Scopes [8]. The diagram is further enhanced with text to illustrate where patterns can hold or not hold.
10
Konrad and Cheng extended the work of Dwyer et al. with the introduction of real-time patterns and the informal textual interface CNL which hides the patterns’ formalism. Konrad and Cheng SPS supports both qualitative and real-time patterns, and can represent system properties' behaviors on two levels. The first level uses formal notations to formally represent system properties' behaviors, while the second level is textual using where CNL is mapped to the formal notation of each pattern [12]. Figure 2.5 shows the Konrad and Cheng SPS classification which consist of two main categories of patterns, qualitative and real-time patterns. An example of an SPS real-time pattern is the “Bounded Response” pattern, and its CNL states, “it is always the case that if P holds, then S holds after at most c time units”. P, S, and c are non-literal terminals, where P is the cause, S is the effect and c is a time constraint [32].
Figure 2.5: SPS Classification [12].
The expressibility of the extended SPS in the automotive industry has been tested in at least two case studies with satisfactory results. The first case study was performed by Post et al., who further extended the Konrad and Cheng SPS, and compared performance of different versions of the SPS on 289 functional automotive requirements at BOSCH. These SPS versions were Dwyer et al., Konrad and Cheng, and Post et al. SPS. The case study results are displayed in Figure 2.6, and the inexpressible requirements are shown in purple and red. None of the three SPS versions succeeded in patterning 100% of the requirements, but extending the Dwyer et al. SPS effectively decreased the number of inexpressible requirements [17].
11
The second case study was performed by Filipovikj et al. at Scania. The case study assessed the applicability of the Konrad and Cheng SPS on E/E systems’ functional requirements written in natural language. The results of the case study showed that 70% of all requirements and 92% of the behavioral requirements were formalized using Konrad and Cheng SPS. Another outcome of the case study showed that the SPS was effective in reducing requirement ambiguity and enhancing communication between stakeholders [5].
12
3. Study Design and Methodology
This chapter describes the methodology used, and the procedures followed in conducting the research study. The chapter is organized into a number of sections; the first section discusses selecting the research methodology and its inquiry approach. The second section is the data collection procedures, which briefly describes the different cycles of the data collection process. Afterwards, the third section presents the sample selection procedures and details about the participants who took part in the study. Finally, the data analysis, and the study validation and evaluation sections present the processes, and techniques followed to analyze the data, and validate and evaluate the study.
3.1.
Selecting the Study Methodology and its Approach
The first sub-objective of the thesis is concerned with finding state-of-the-art supportive methods that can provide feedback on the formalized requirements’ semantics. This is achieved by performing a literature survey to search academic databases for relevant literature. In addition, the first sub-objective also aims to identify the supportive methods that provide the best feedback on the formalized requirements’ semantics. This goal is achieved by performing a qualitative research study which is useful in investigating the participants’ preferences regarding the supportive methods’ feedback. An advantage of the qualitative research is that it involves exploring the human behavior and feedback providing a complex and a detailed understanding of the issue being studied. This level of detail can only be gained by directly communicating with the engineers involved in the study. Another key characteristic of the qualitative research study is its emergent design. Emergent design means that the research study cannot be tightly defined since different elements of the process may change as the process is stated and data is collected. Examples of these elements are case study questions, data collection forms and participants. The purpose of the qualitative research is to understand the problem from the interviewees and to adjust the study in order to obtain the required information [33]. The researcher is a key instrument in the qualitative research. It is the researcher’s role to find state-of-the-art material and create the case study questionnaires. Afterwards, the researcher conducts in-person interviews while taking the role of an observer, collecting data and feedback. Finally, the researcher analyzes the collected data and reports its findings [33, 34].
There are different approaches within the qualitative research to perform a study, and the approach selected for this qualitative research is the case study approach. The case study approach focuses on gathering empirical data, and on performing an in-depth and detailed exploration of the problem within a specific context [33]. The case study category is exploratory because it is exploring the opinions of one group of engineers under the same context. In addition, the case study type is defined as single [35], because it investigates a single case concerning the participants’ preferences regarding supportive methods’ feedback. Furthermore, the case study is defined as holistic because it uses perspectives from different sources such as interview questionnaire, observations and feedback. These multiple perspectives help in building a detailed understanding of the study problem. Finally, the case study is classified as instrumental [36] because the data gathered from exploring the case helps in understanding and improving the experience of using the SPS. The ideal setup for the case study is to conduct it in natural settings. Natural settings include having in-person interactions with the participants and collecting the data in the field where the participants are experiencing the problem [33]. Natural settings also mean that the case environment is not manipulated, while taking into account real-world complexity [37, 38]. At the same time, the interviewer should play the role of an observer, and have as little input as possible during the case study [38].
13
3.2.
Data Collection Procedures
Creswell [33] proposed a data collection circle that consists of a number of interrelated activities with the purpose of collecting detailed information regarding the research question. Figure 3.1 shows the activities involved in the data collection process. The first activity is locating a resource which could be a person, a website, a company or a book. The second activity is to gain access to the resource, and if individuals are involved in providing the data, then, the researcher should establish cooperation and rapport with them. The third activity involves using a sampling technique to ensure that the selected resources can provide the best information related to the research problem. The fourth and fifth activities involve collecting the data from the selected resources and documenting it respectively. The sixth activity deals with field issues related to the data collected from the resources. Resolving these issues contributes to evolve the case study design. Finally, in the seventh activity, the collected data is stored.
Figure 3.1: Data Collection Cycle by Creswell [33].
The case study preliminary interviews and interviews were in-person, open-ended, followed an interview protocol and took place at Scania where this thesis was performed. All the interviews of the case study were organized to accommodate the interviewees’ schedules and took place at the locations they suggested.
Data collection was performed during both the preliminary interviews and the interviews. Data collection followed specific strategies with regard to conducting observations, collecting feedback and documentation. The observations were taken from the point of view of an observer as hand written filed notes. The notes collected from both the preliminary interviews, and the interviews were then stored in the form of Microsoft Word files, and backup copies were made. One of the features of a qualitative interview is that it is an extended form of conversation. Consequently, the interviewees were looked upon more as partners rather than subjects of test during these qualitative interviews [39]. This partnership setup was convenient, and welcomed during the interviews. As a result, it helped in uncovering important issues with regard to the use of SPS. The feedback from the interviewees with regard to these issues and on the questionnaire was recorded as written notes.
3.3.
Sample Selection Procedures
The selected site for the case study was at RESA department in Scania Research Center where this thesis was performed. There were only three participants in the preliminary interviews, two
14
of them were fellow engineering students who also worked with the SPS, while the third was a Scania project supervisor. The author contacted a RESA manager and requested candidate participants for the case study interviews. RESA management provided a list of seven engineers having different roles in the product-development process from different departments at Scania. The sample provided by Scania fulfilled the criteria for maximum variation sampling, which aims to sample a diversity of individuals [33], and all the seven engineers took part in the case study. All the participants in the interviews were experienced engineers; however, none of them had any previous experience with the SPS, or any of the supportive methods. Three of the participants worked as embedded software developers, one was a tester; another had a managerial and a research position, and the last participant worked as a product owner. All the participants were involved in working with real-time software systems. The reason for limiting the case study to a Scania site and employees was that the thesis was conducted at that site. Furthermore, there was not enough time to visit other companies involved in the VeriSpec project and meet their employees.
3.4.
Data Analysis Procedures
Figure 3.2: Data Analysis Spiral by Creswell [33].
Creswell proposed an analytical spiral approach for the analysis of qualitative data. Figure 3.2 shows that the spiral process consists of several procedures that have to be conducted before the analyzed data is converted into an account or a narrative. The first procedure in the spiral is data management where the data collected from the interviews is arranged and prepared for analysis. The hand-written notes from the interviews were converted and processed into easy to locate text units organized as a database stored in a Microsoft Word file. The second procedure in the spiral process after organizing the data is getting a sense of the whole database transcript [33]. Agar [40] suggested reading the entire transcript several times, and adding notes and remarks while getting immersed into the details of the interviews. The third procedure consisted of classifying, interpreting the database entries, and drawing the conclusions of the study. Conclusions on the results of the study were based on the interviewees’ answers, feedback, and author’s observations made during the interviews. The conclusions were derived by applying the direct interpretation
15
analysis, and the categorical aggregation techniques. The categorical aggregation technique was applied first, and emerging patterns of behaviors were sought out through observing repetitive phenomena in the multiple instances of data. Afterwards, conclusions were drawn from individually interpreting each of the emerged patterns. The direct interpretation technique involves making sense of the emerged patterns while stepping back to form a larger meaning of the situation [33, 36, 41]. The conclusions determined the results of the study, and provided insights and recommendations. The fourth and last procedure was the presentation and visualization of results where the findings are presented in the form of a table, a graph and discussions. Finally, an account representing a generalized understanding of the case study problem was formed based on the findings that emerged from the study [42].
3.5.
Validation and Evaluation Procedures
Validation is one of the strong features of a qualitative research study because its accuracy is enhanced while the study is ongoing for a number of reasons. These reasons are, the amount of time spent on the case study, detail level of the collected data, and the close relation established with the participants. A strategy that was used to further validate the study was collecting data using the triangulation approach. In this approach, more than one data source was used to collect data with regard to the case study problem. The main purpose of triangulation approach is to inspect different dimensions of the same problem accurately rather than cross validating the data [33]. The author used the interview questionnaire, interviewee feedback, and observation as sources of data during the case study interviews.
Creswell proposed criteria for evaluating a qualitative research study which included clear identification, understanding and description of the problem being investigated. Furthermore, Creswell emphasized on the importance of correctly identifying the patterns emerging from the case analysis and the role of the researcher in the study [33]. Following Creswell's criteria, the author relied on state-of-the-art material to build an understanding of the problem statement of the thesis and for generating the material used in the case study. In addition, the author developed rapport with the study participants to enhance communications with them. This resulted in improving the quality of the collected data, which combined with reflections, and in-depth analysis contributed to successfully identify the case patterns. Finally, the author’s role in the qualitative study was that of an observer in order not the effect the opinion of participants and results of the case study.
Summary
This chapter defined the type of research methodology used as a qualitative research study and the applied approach as a case study approach. The case study characteristics are defined as a single, holistic, instrumental and exploratory case study. Thereafter, the chapter presented the different procedure followed in conducting the qualitative case study. The data collection procedure followed the Creswell data collection cycle and relied on the author’s observations, interviewees’ feedback and the interview protocol questionnaire as data sources. The one-to-one interviews used an interview protocol and were open-ended. Author’s role during the interviews was that of an observer, and observations were recorded as hand-written notes. In addition, a participant sample of seven engineers was provided by the Scania management and fulfilled the maximum variation sampling approach. The data analysis procedures applied the Creswell spiral process to analyze and interpret the collected data. The conclusions were derived from applying the categorical aggregation techniques and the direct interpretation analysis. Finally, the validation and evaluation section applied both the triangulation approach, and criteria proposed by Creswell to validate respectively evaluate the case study.
16
4. Supportive Methods
This chapter presents the supportive methods that resulted from the literature survey and the feedback from the preliminary interviews. The intended use of these supportive methods is to provide feedback on the behavior of the formalized requirements' semantics. Each supportive method is presented with a brief introduction, and a description of its graphical notation. The final section of this chapter presents a table that provides a comparison between the different features of the supportive methods.
For each supportive method in this chapter, a representation example consisting of a “Response” pattern has been provided. The SPS “Response” pattern represents a qualitative cause-effect relation between two propositions P and S. The “Response” pattern CNL states that “If P holds, then S will eventually hold” [12]. A simple requirement example that follows this pattern would be “if Signal_A = True, then Signal_B = False”, where “Signal_A = True” represents the proposition P, while “Signal_B = False” represents the proposition S. Propositions can be either simple containing a single logical relation, or compounded containing more than one logical relation connected by logical connectors. Some of the logical connectors that can be used are such as and (&), or (|), and negation (!).
4.1.
Supportive Methods from the Literature Survey
A literature survey was performed to find the state-of-the-art supportive methods and six of them were selected after applying criteria. Most of these six supportive methods were originally proposed by researchers to facilitate a requirement formalization process by using the Dwyer et al. SPS. Generally, each of the six supportive methods uses two levels to represent a specification property behavior. The first level uses formal notation to represent the patterns’ temporal behaviors. Examples of the formal notations are, such as Linear Temporal Logic (LTL) [43], Computational Tree Language (CTL) [44], and Timed Computational Tree Language (TCTL) [45]. The second level is the user level, and consists of graphical notations mapped to relevant formal notations. This study will only use the graphical level of the supportive methods to provide feedback with regard to requirement formalization semantics.
4.1.1. A Graphical Property Specification Language
Lee and Sokolsky [46] proposed a method called Graphical Property Specification Language (LR) to facilitate the formalization process of system properties. LR expresses a system property behavior on two different levels. The first level is the expert level which uses the formal notation µ-calculus which is an extension of the propositional modal logic [47]. The second level is the user level which uses an extendable graphical notation mapping the behavior of the formal notation. The user level hides the formal logical expressions, and provides a user-friendly interface for the practitioners who are not experts in formal logics.
The graphical notations of the user level in LR are presented in Table 4.1
and are
inspired by the concept of constraint graphs [48]. The LR consists of nodes sequentially placed along a progression line that resembles the process. This method allows multiple paths between the nodes which represent different elements and actors such as propositions, logical connectives, modal and temporal operators. A logical connective can be such as an “and”, “or”, or a negation “!”. A modal operator is used to express a next state input or an output event. A temporal operator represents a path property such as “Eventually”, “Next” or “Always”. Temporal operators can also be supplemented with modifiers, which can add constraints on time, path, or for path termination [46]. Figure 4.1 shows an example of an LR representation of a simple real-time cause-effect relation. This example was provided by Lee and Sokolsky.17
Lee and Sokolsky suggested constructing libraries containing LR representations of common reoccurring system properties. Users with no experience in formal languages can then formalize requirements by matching user level pattern expressions from the libraries to an intended behavior.
Table 4.1: LR Graphical Notation. LR Example Diagram Symbols
1
Path quantifier: From left to right, “along every path” and “along same path”, respectively.2
always
eventually
Temporal operators presented as keywords.3
request!
response?
Prepositions for the cause and the effect, respectively.4
within [0,5]
Time interval constraint.5 Condition applied to restrict a path.
always request!
eventually within [0,5] response?Figure 4.1: Simple LR Real-Time Cause-Effect Relation [46].
The LR method is user-friendly, and has different types of operators making it easy to represent formal expressions. However, it should be noted that the LR does not support the SPS. In addition, there was not enough information available about the LR method, for example, not all the graphical notation information was provided. Lee and Sokolsky referred to a research paper containing detailed information about the LR, but the author was not able to locate that paper. To use this supportive method in the study, the LR had to be modified to further simplify and adapt it for representing the SPS patterns. Modifications included a textual approach to address the SPS CNL ambiguities, and consisted of using textual comments. This modified graphical notation is referred to as the Modified Graphical Property Specification Language (MLR) supportive method. Table 4.2 presents the graphical notation of the MLR. The following modifications were introduced on the LR user level to enhance clarity and improve the information communicated to the user:
1. Cause-effect indicator: To express a cause-effect relation.
2. Pattern template: Pattern expressions are encapsulated in a template which is used to provide information about the pattern. This information includes pattern name, pattern description and any additional remarks, which could be difficult to visualize such as CNL ambiguities.
18
3. Elements container: Is a container for encapsulating and grouping diagram elements for the purpose of enhancing clarity.
4. Coloring: Element coloration is introduced to easily distinguish different elements. 5. Using textual temporal representations only instead of both symbolic and textual. 6. Enhancing clarity through using different geometrical shapes for different operator types.
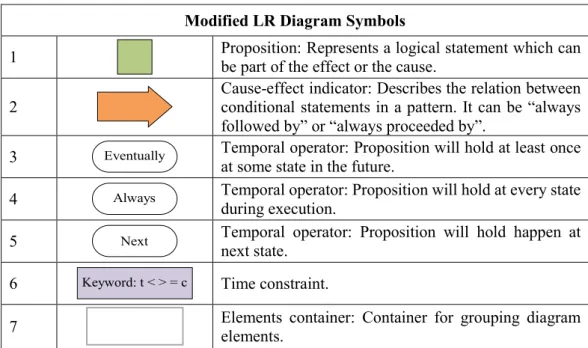
Table 4.2: MLR Notation Diagram Symbols. Modified LR Diagram Symbols
1 Proposition: Represents a logical statement which can
be part of the effect or the cause.
2
Cause-effect indicator: Describes the relation between conditional statements in a pattern. It can be “always followed by” or “always proceeded by”.
3 Eventually Temporal operator: Proposition will hold at least once at some state in the future.
4 Always Temporal operator: Proposition will hold at every state during execution.
5 Next Temporal operator: Proposition will hold happen at next state.
6 Keyword: t < > = c Time constraint.
7 Elements container: Container for grouping diagram
elements.
Figure 4.2 shows an example of the “Response” pattern semantics represented in MLR. P is the cause proposition while S is the effect proposition. The cause-effect indicator displays “Always followed by” to indicate a “Response” type relationship between the cause and effect. The effect S in Figure 4.2 is preceded by the temporal operator “Eventually” to indicate the expectation of when S holds. The pattern template in Figure 4.2 shows the pattern name and displays the behavior of the pattern. The message “The effect S can be stimulated by other different causes and not only by P” is displayed to alert users to a behavior in the “Response” pattern which is not described by its CNL.
Pattern Behavior
Response
P must always be followed by S
P Eventually S
The effect S can be stimulated by other different causes and not only By P. Always
followed by
Figure 4.2: MLR Representations of the Response Pattern. This Figure shows a Textual Approach to Address CNL Ambiguities.
The author made MLR representations of the SPS qualitative and real-time patterns, and are found in Appendix A. Using the MLR language requires basic knowledge in MLR notation, and the temporal operators “Eventually”, “Always, “Next”…etc. Lee and Sokolsky did not provide any
19
evaluation information comparing the LR method to other methods with regard to the requirement formalization.
4.1.2. Real-Time Graphical Interval Logic
Ramakrishna et al. [49] proposed a Real-Time Graphical Interval Logic (RTGIL) method for representing the temporal behavior of Konrad and Cheng SPS patterns. The method provides two levels mapped to each other for representing system properties. The first level is called the Graphical Interval Logic (GIL) which provides a visual representation of the system properties' behaviors. The second level is called the Future Interval Logic (FIL) which provides temporal logic expressions for the system properties’ behaviors represented by GIL. Moser et al. [50] extended the work of Ramakrishna et al. [49] by developing the RTGIL, and the Real-time Future Interval Logic (RTFIL) to represent real-time properties [13, 49].
Table 4.3: RTGIL Method Diagram Symbols. RTGIL Diagram Symbols
1
Execution context: Represents an interval between two states where a certain property represented by a proposition can be evaluated.
2
Weak search: The RTGIL formula is true even when the search fails in finding a required state. Meaning the proposition may or may not hold on the interval.
3
Strong search: The RTGIL formula is false if the search fails in finding a required state. Meaning the proposition must hold on the interval.
4 Proposition will hold at every state.
5 Proposition will hold happen at next state.
6 len(d,D) Time-duration constraint where the duration (len) is defined by a minimum (d) and maximum (D) time values.
RTGIL categorizes system properties according to the location where they hold in an interval. In the "Initial property" category, the property holds at the beginning of the interval. The "Henceforth Property" category denotes a property that holds during the entire interval. The "Eventuality Property" category expresses a property that holds at some point along the interval starting from the beginning of the interval up to but not including the last point of the interval. Finally, the "Real-Time Duration Constraints" category expresses a time-duration constraint len(d, D) where the duration (len) is defined by minimum (d) and maximum (D) time values [13, 49].
20
Figure 4.3 shows RTGIL representations of the “Response” pattern semantics with a ”Globally” scope. The diagram’s graphical notation is explained in Table 4.3, and the diagram is read along both its horizontal and vertical axes. It is read horizontally from left to right and vertically from top to bottom. The behavior of the system property is represented by a sequence of events and time constraints. These events and constraints are distributed along a time-line describing the state progression of the system. The section of the time-line between two states is called an interval, which is the basic building block of GIL/RTGIL. An interval is the range where a property is checked for whether it holds or not. Each interval consists of a sequence of events aligned in a linear manner. Events of non-timed properties are described as discrete, while events of real-time properties are described as dense. Figure 4.3 shows a weak search represented by a single headed arrow which is preformed to check for whether P holds or not. Since the scope used here is “Globally”, the cause P can hold at any state along the progression line. Once P holds, then S must eventually hold. This is expressed by a second interval extending from where P holds and till the end of the first interval, meanwhile S is designated with the diamond symbol representing the temporal operator ”Eventually” [13, 49].
P
S
Figure 4.3: RTGIL Representations of a Response Pattern [50].
Using the RTGIL method requires knowledge in in RTGIL notation, and in temporal operators such as “Eventually”, “Always”, “Next” … etc. The researchers did not provide any data with regard to evaluating the RTGIL performance in requirement formalization. SPS real-time pattern representations in RTGIL were provided by Konrad and Cheng in [13] and GIL SPS qualitative pattern representations are available in an online repository setup by Alavi et al. [51].
4.1.3. Runtime Monitoring Framework for Property Specification Patterns
Simmonds et al. [52] proposed the Runtime Monitoring Framework for Property Specification Patterns (RMF) method, which was used to check the correctness of website behaviors. RMF implemented the Unified Modeling Language (UML) 2.0 [53] sequence diagrams (USD) for representing system specification properties. Simmonds et al. introduced modification to the USD so that the RMF was suitable for representing Dwyer et al. SPS property patterns. The USD diagrams were then interpreted into Finite State Automata (FSA)[54] which was used as a formal notation to formalize property semantics. The RMF does not support Konrad and Cheng SPS real-time patterns, and representations of the Dwyer et al. SPS can be found in [52].
Figure 4.4shows an example of a USD representation of an SPS “Response” pattern which is a qualitative cause-effect relation. In USD, the vertical dimension represents the relative time while the horizontal dimension represents the different states of the system. Each state/object is represented by the rectangular box with a vertical dashed line called a lifeline, and messages between objects are represented by arrows. The loop-block in Figure 4.4continuously checks for the existence of P while the assert-block indicates that S must hold after P has held. Simmonds et al. have extended the USD by adding operators from the UML 2.0 [53] to enhance capturing of system properties. The added operators can be categorized into four groups. The first group is the “Compositional operators”, which contains the following operators: alternatives “alt”, parallel
![Figure 2.1: Verification Overview [26].](https://thumb-eu.123doks.com/thumbv2/5dokorg/4763137.126864/16.892.163.728.574.934/figure-verification-overview.webp)
![Figure 2.2: Model Checking Method [28].](https://thumb-eu.123doks.com/thumbv2/5dokorg/4763137.126864/17.892.181.716.503.939/figure-model-checking-method.webp)
![Table 2.1: Dwyer et al. Patterns’ Categories and Patterns’ Descriptions [8].](https://thumb-eu.123doks.com/thumbv2/5dokorg/4763137.126864/19.892.131.767.186.775/table-dwyer-et-al-patterns-categories-patterns-descriptions.webp)
![Figure 3.1: Data Collection Cycle by Creswell [33].](https://thumb-eu.123doks.com/thumbv2/5dokorg/4763137.126864/23.892.195.702.392.679/figure-data-collection-cycle-by-creswell.webp)


![Figure 4.4: Response Pattern Semantics Represented in USD [52].](https://thumb-eu.123doks.com/thumbv2/5dokorg/4763137.126864/31.892.286.605.337.701/figure-response-pattern-semantics-represented-in-usd.webp)