Secondary Environmental
Impact due to Winter
Road Salting
Eva Gustavsson and Janet Yakoub co Cr o <-] <LC co o rw o t nm Aaa CB < < & f # * _ I_, -Cuss ® ) 753'1 Cisse \ //////lo,,,..~ IN ///////( G \ a l ... i]
\\\
///////////7//1 Aedes 11 \ .Swedish National Road and & Transport Research Institute
VTI meddelande 798A- 1998
Secondary
Environmental Impact #
due to Winter Road
Salting
" Eva Gustavsson and Janet Yakoub
Swedish National Roadand
Pubnsher PubHca on
-VTI meddelande 798A
Published Project code
- _ 1996 80063
Swedish National Road and
Project
' 'anspart ReseaI'Ch Institute Environmental impact of winter salting
Printed in English 1999
Author Sponsor
Eva Gustavsson and Janet Yakoub Swedish National Road Administration
Tl e
Secondary Environmental Impact due to Winter Road Salting
Abstract (background, aims, methods, result)
The term secondary environmental impact refers, inter alia, to the environmental impact which may arise if, because vehicles etc. become dirtier, they have to be cleaned more often and this increases the emissions of vehicle care products. Our aim is to nd out whether winter road salting affects wash frequency, the use of car cleaners and corrosion.
Compilation of the responses shows that there are signi cant differences in the care of cars between the island of Gotland (unsalted) and the Swedish mainland opposite Gotland (salted), and between part of Vaster-botten County (lightly salted) and part of Vasternorrland County (salted). We consider that if salt application were discontinued, wash frequency would be cut by ca 30% and the use of degreasers and screen wash uid would be reduced by 40 7 0%.
We formulated our study as a questionnaire survey. Responses were received from 1,587 car owners, 70% of the sample.
ISSN Language No. of pages
Foreword
This study has been nanced by the Swedish National RoadAdministration (SNRA) as part of the project En-vironmental impact of de-icing salt . The contact person at the SNRA was Lennart Axelson.
The VTI project manager for the main project was Lennart Folkeson. This part project was managedby Eva Gustavsson, and a lot of the work, data registra-tion and statistical analysis, was carried out by Janet Yakoub. Mats Wiklund acted as consultant in relation to statistical treatment of the collected data.
The reader at the seminar prior to publication was
Urban Hjorth, Department of Mathematics, University
of Linkoping.
VTI MEDDELANDE 798A
The nal version ofthe report was given its fmal form by Ann-Louise Flisback, and the cover was drawn by Veronica FredrikssonThe report was translated into English by Lewis Gruber.
We wish to extend our sincere thanks to all who have
contributed to this report.
Linkoping, November 1996/October 1998
Contents
Summary ...I
1 Introduction ... .. 13
1.1 Environmental impact due to the washing of vehicles ... 13
1.2 Relationship between salting, soiling, road wear and the use of studded tyres ... .. 14
1.3 Screen wash uids and rustproo ng preparations ... .. 14
1.4 The attitude of road users to winter road salting ... .. l4 2 Aim and limitations ... .. 15
3 Method ... .. 16
3.1 Suitable investigation areas ... 16
3.2 Different methods of investigating secondary environmental impact ... .. 16
3.3 Procedure used in the preliminary survey ... .. 16
3.4 Procedure used in the main survey ... 17
3.5 Processing of data ... .. 17
4 Results of the preliminary survey ... .. 18
5 Results of the main survey ... .. 22
5.1 Variations in the breakdown of the car population by age ... .. 23
5.2 Wash frequency ... .. 23
5.3 Degreaser ... .. 24
5.4 Screen wash uid ... 24
5.5 Rustproo ng treatment ... .. 25
5.6 Repair of corrosion damage ... 25
5.7 Money spent on corrosion damage ... .. 25
5.8 Where is the car washed? ... .. 25
5.9 Many comments regarding salt ... .. 26
5.10 Summary of results ... .. 27
6 Discussion ... .. 28
6.1 Can the differences between regions have a cause other than application of de-icing salt? ... .. 28
6.2 What if the whole of Sweden were to become salt-free? ... .. 28
6.3 Where the car is washed ... .. 29
6.4 Investigations of wash frequency by the National Board for Consumer Policies ... .. 29
6. 5 Development over time ... .. 30
7 Conclusions ... .. 31
8 Bibliography ... 32 Appendices
Appendix 1 Questionnaire regarding car care Appendix 2 Covering letter
Appendix 3 The test areas
Appendix 4 The survey population Appendix 5 Comments on salt (sample) Appendix 6 Statistical calculations
Appendix 7 Salt consumption by National Road Administration Appendix 8 Salting Strategies
Secondary environmental impact due to winter road salting
by Eva Gustavsson and Janet Yakoub
Swedish National Road and Transport Research Institute (VTI) SE 581 95 Linképing, Sweden
Summary
The term secondary environmental impact due to win-ter road salting refers, inwin-ter alia, to the environmental impact which may arise if, because vehicles etc become dirtier, they have to be cleaned more often and this in-creases the emissions of vehicle care products.
The aim of this study is to nd whether winter road salting affects wash frequency, the use of car cleaners and corrosion.
Evaluation ofthe answers to the questionnaire shows that there are clear differences in the cleaning of cars between the island ofGotland in the south (unsalted) and the mainland opposite Gotland (salted), and between part of Vasterbotten County in the north (lightly salted) and part of of Vasternorrland County (salted). These differ-ences are signi cant at the 5% level.
There are relatively large differences in climate
be-tween the north and south of Sweden, and these are
probably of great importance for the more frequent use of degreasers and screen wash uid, and the higher wash frequency, in the north. Another factor which may be important is that in winter more cars have studded tyres in the north than in the south. It is therefore not relevant to compare test areas in the north with those in the south.
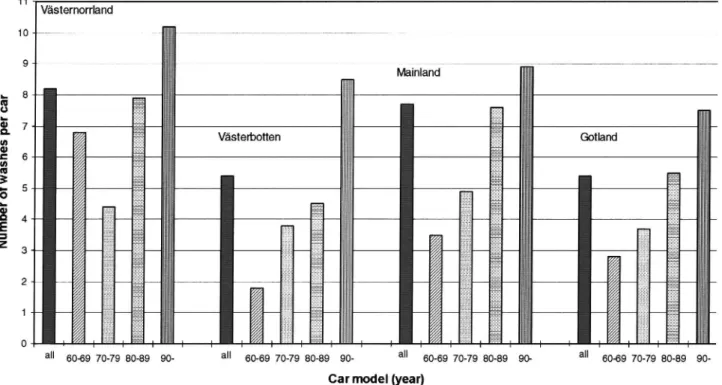
There is a clear difference in wash frequency dur-ing the winter between Gotland and the mainland: 5.4 washes per car as against 7.7. In Vasterbotten and Vasternorrland the difference is slightly larger, 5.4 and 8.2 washes per car respectively. See Figure 0.1.
11
Vésternorrland 10 9 hMWmd .- 8 _ 55%
a 7-
_
V Vasterbotten..
Gotland E 4- g 2% r;In
% 3 % ' 1 - :9;lei l I
a 60-69 70-79 80-89 90- a 60-69 70-79 80-89 90- a 60-69 70-79 80-89 90 a 60-69 70-79 80-89 90-Car model (year)Figure 0.1 Average number ofwashes per car in winter in different regions andfor cars ofdi erent ages.
80 70 60-50~ 40- 30-Use of de g re as er (% ) 20-V sternorrland vasterbotten Figure 0.2
On the island of Gotland, degreasers were used in only 18% of washes, while car owners on the mainland used these in 41% ofwashes. In the test region in Vaster-botten, degreasers were used in 71% of washes, as against 76% in Vasternorrland. See Figure 0.2.
Two thirds of car owners on Gotland used no de-greasers at all, while the corresponding proportion on the mainland was considerably less than one third. One fth of all car owners in Vasterbotten and one eighth in Vasternorrland used no degreaser at all during the
win-ter.
On Gotland, considerably less screen wash uid was used (1.2 litres during the winter) than on the mainland (3.3 litres). A difference of the same order was found between Vasterbotten (2.8 litres) and Vasternorrland (5.6 litres).
Repair of corrosion damage and rustproo ng
treat-Table 0.1
Mainland Gotland Percentages ofthe total number ofwashes in which a degreaser was used.
ment were not carried out by a sufficient number of car
owners, and sound conclusions cannot therefore be
drawn. A general trend can however be discerned: there are fewer corrosion repairs and less rustproo ng treat ment in the regions which use little or no de-icing salt on the roads.
What would happen if application of salt was dis-continued in the whole of Sweden? The four regions which have been investigated are not illy representa-tive ofthe country as a whole, but comparisons between pairs of these may give some indication. See Table 0.1. The calculations arevalid on the assumption that the same amount of degreaser is used in every wash regardless of the extent of salting. Our data can provide no infor-mation whether the consumption of degreaser per wash-ing is the same with and without salt application.
Percentage difference between salted and unsalted regions regarding number of washes and the consumption ofdegreaser and screen wash uid.
GOtland compared with
the mainland Vasterbotten comparedwith Vasternorrland
Number of washes
Consumption of degreaser
degreaser Consumption of screen wash uid
30% fewer washes 68% fewer washes with 65% less screen wash uid
34% fewer washes 38% fewer washes with
degreaser
50% less screen wash uid
Economic, social and cultural differences may be signi cant for the breakdown of cars by age, and may in this way have an indirect in uence on wash frequency. Such differences may also have a certain effect on how clean it is considered a car should be, and may there-fore also directly affect wash frequency and the use of chemicals.
We used questionnaires to collect data on how
pri-VTI MEDDELANDE 798A
vate car owners clean their cars on the island of Gotland (no salted roads) and part of Vasterbotten County, and compared these with data relating to regions with a simi-lar climate (the coast opposite Gotland and part of Vaster-norrland County respectively).
Of 2,257 car owners selected at random, 1,587 llly
answered the questionnaire. The response rate was thus 7 0.3 %.
1 Introduction
Winter road salting has been the subject of increasing discussion in recent years, mainly because of the vironmental effects it gives rise to. The primary en-vironmental impact consists of the direct effect which de-icing salt has on plants, animals, lakes, watercourses and groundwater near the road.
The term secondary environmental impact due to winter road salting refers, inter alia, to the environmental impact which may arise if vehicles etc. have to be cleaned more often because they become dirtier. Pre-vious research projects have demonstrated that roads on which salt has been spread in winter do make ve-hicles dirtier than roads on which sand has been spread (Helmers & Ytterbom, 1986). Increased cleaning of signs and other permanent road furniture may also cause an environ-mental impact.
Because ofthe increased need for cleaning, cleaning may either be carried out more often or stronger car
cleaners may be used. The use of degreasers, wax, car
cleaners and perhaps even rustproofmg preparations and rust removers may also increase as a result of salting. The environmental impact of an increased need for cleaning also depends on how and where vehicles are cleaned. Car wash installations have facilities for the separation of oil and other pollutants, while water used to clean vehicles in the street mostly nds its way to the watercourse without treatment.
Winter road salting can be carried out in a number of ways; damp or dry salt CNaCl), salt solution or a salt-sand mixture may be applied. The only distinction that will be made in this report is that between salt alone and salt-sand mixture. The quantity of salt per unit area when a salt-sand mixture is spread is the same as in applying salt on its own to prevent skidding and in preventive skid control (Oberg et al, 1991a). A salt-sand mixture can also produce slush just assalt on its own. In Sweden, the National Road Administration and the municipalities have applied a total of ca 350,000 tonnes of salt per winter in
1994/95 and 1995/96 (Danielsson, 1996).
1.1 Environmental impact due to the washing
of vehicles
The National Environmental ProtectionAgency has pub-lished a report, Washing of vehicles targets and rec-ommended values (Fordonstvatt, 1996) which de-scribes the environmental problems due to the washing of vehicles and the possible countermeasures. The water discharged from vehicle wash installations has elevated
VTI MEDDELANDE 798A
concentrations of organic substances and heavy metals, and the volumes of water discharged are large. Oil sep-arators cannot manage to remove either oil or heavy metals to a suf cient extent, and these discharges there-fore increase the load on the municipal treatment plants through the disturbance they cause to the treatment processes and their adverse effect on the quality of the sludge. Five ofthe thirteen environmental threats listed by the National Environmental Protection Agency are affected by the washing of vehicles:
0 eutrophication of water and land
0 adverse effects through metals
0 photochemical oxidants/ground level ozone
0 adverse effects through organic environmental
poi-sons
0 waste and environmentally hazardous residual
pro-ducts (Fordonstvatt, 1996).
The sources ofpollutants in the water used in washing vehicles are road surfacing, road maintenance materials, spillages of loads, vehicles, tyres, tyre studs, fuel and car cleaners, from which mineral oil (non-polar aliphatic hydrocarbons), metals (nickel, lead, cadmium and zinc) and compounds which give rise to chemical and bio-logical oxygen demand, are emitted. The washing of vehicles is a considerable source of cadmium input to treatment plants, and as much as 5 10% of the total quantity of metals which enter treatment plants may originate from vehicle care installations. The share of water ow from these installations is ca 0.7% of the total water ow into treatment plants. These gures have been taken from an investigation performed in Karlstad (Fordonstvatt, 1996).
The National Environmental Protection Agency has set up targets and recommended values for the washing of vehicles, and has proposed that the ultimate target should be the introduction of closed systems for washing and cleaning. Staged targets aim at 80% recirculation of the water, and a low level of pollutant discharge per vehicle washed as an average over a month (Fordons-tvatt, 1996).
It should be borne in mind that many vehicles are washed outside established installations (Fordonstvatt, 1996), but also that consumer products do not contain the same quantities of hazardous substances (KEMI, 1992)
Degreasers may be based on petroleum fractions (mainly whitespirits), alkaline compounds, limonene
products or chlorinated hydrocarbons (KEMI, 1992). Practically all the chlorinated solvents have been super-seded by e.g. alcohols and ketones during the rst half of the 1990s (KEMI, 1995).
1.2 Relationship between salting, soiling, road
wear and the use of studded tyres
Studded tyres in combination with a wet road abrade the carriageway to a slightly greater extent than do studs on a dry road. Particles of bitumen are thrown up and adhere to the vehicle. It is mainly in order to remove these particles that degreasers are used. Road wear which at
the end of the 19805 amounted to a total of 450,000
tonnes decreased to 300,000 tonnes during the rst half of the 1990s because of stronger surfacings and studs which cause less abrasion, and it is expected that by the turn of the century it will have dropped to 130,000 tonnes (Gustafson, 1995). Roads are sometimes wet as
a result of natural weather conditions, but because of
the application of de-icing salt, roads are wet more often than they would be without salting. Salt itself can be washed off the vehicle with clean warm water.
1.3 Screen wash fluids and rustproofing preparations
Screen wash uids mainly consist of solvents and sur-factants. At the beginning of the 1990s methanol and
1,1,1-trichloroethane were used in screen wash uids
(KEMI, 1992), but have been superseded by other sub-stances owing to demands by both consumers, legis-lation and the surveillance projects of the National Chemical Inspectorate (KEMI, 1995).
Rustproo ng preparations contain fats, corrosion inhibitors, solvents (mostly white spirits, petrol solvent, xylene or toluene) and surfactants. They are hazardous to health principally because of their solvent content (KEMI, 1992). There are as yet no water based rust-proofmg preparations, but there are preparations with
14
an elevated dry solids content and preparations which contain solvents of low aromaticity.
It has been found easier to substitute less hazardous substances for solvents and diluents than to replace the chemicals which are responsible for the function of the product (KEMI, 1995).
1.4 The attitude of road users to winter road salting
According to the attitude surveys of the National Road Administration, the general attitude to salting in Sweden as a whole became more negative from spring 1995 to spring 1996. In both surveys there is a certain majority in Sweden as a whole of those with a negative attitude to salting. It is most pronounced in the north, Region
North of the National Road Administration, but is also
found in the regions Centre, South-East and Malardalen (Noreland, 1996).
The MINSALT project (Oberg et al, 1991a) reveals
a tendency among road users to become more negative towards salt when they have had a chance to drive on winter roads on which no salt has been applied. This is particularly so on the island of Gotland; the probable reason for this is that it is the whole road network on the island which has not been salted, and not only some test sections as has often been the case in other trials regarding free winter road management. Short salt-free sections in an otherwise salted road environment may be perceived dif cult owing to the change which must be made to cope with different road conditions. But even in the reference region of Vastervik there has been a tendency for the adherents of unsalted roads to increase, so that from being a minority they became a majority during the year in which the surveys were made.The aspects of salting which road users regard as most negative are the environmental impact and soil-ing, but also corrosion.
2 Aim and limitations
The aim of this investigation is to nd whether or not secondary environmental impact as a result of salting occurs. Our hypothesis is that application of salt has an effect on the frequency of washing vehicles, the use of vehicle care products and screen wash uid, corrosion attack and the frequency of use of rustproo ng pre parations, and we test this hypothesis by comparing regions with different salt application strategies.
>
WashesUse of chemicals
>
VTl MEDDELANDE 798A
What we are mainly investigating are wash frequency and the use of degreasers and screen wash uids, i.e. the second link in the causation sequence from salt appli-cation to damage, as shown below.
Gravel roads are also salted in the summer, but this
is not dealt with in this report.
Emissions [Damage
3 Method
3.1 Suitable investigation areas
The most notable example of a deviation from con-ventional skid prevention measures is the island of Got-land in the south where application of salt was
discon-tinued from winter 1986/87 onwards, and Vasterbotten and Norrbotten Counties in the Province of Norrland,
northern Sweden, where salting in 1996 was mainly con ned to spreading of salt-sand mixture on European Route E4 and Highway 97. In winter 1994/95 the National Road Administration steeply reduced the quan-tities of salt applied in these two counties. The salting strategies are described in Appendix No. 8. In the spring of 1995 salt on its own was spread only once. In the following we will characterise a region with this type of salt application as lightly salted . Other roads in these counties are not salted. On the mainland coast near Got land it is also only the major roads, European Route E22, Highway 33, Highway 35, Cormty Road 212 and County
Road 806, which are salted. Use of salt in the towns in
these regions varies; see Section 3.4.
Changes in salting had occurred before, for instance in Norrbotten County where application of salt began in
winter 1992/93. Vasterbotten County was a suitable
control region since E4 here was salted in the conven-tional way. Beginning with winter 1994/95 (Widegren, 1996) quantities of salt were again steeply reduced in both Vasterbotten and Norrbotten Counties (see Ap-pendix No. 8). There is a risk that investigations in which the effects are compared in a region where skid pre-vention measures change between years will be distorted if the weather in the winter is different in these years (which is very probable!) A comparison of two similar regions during the same winter is therefore preferable. Gotland in the south and the areas around E4 in Vasterbotten in the north therefore seem to be the most interesting areas to investigate as regards the use of vehicle care products. The reference area should have the same climate as the unsalted area so as to minimise the effect of different weather and road conditions. For Gotland the suitable reference area is the mainland op-posite Gotland, and for Vasterbotten County the corre sponding area around the E4 in Vasternorrland County.
16
3.2 Different methods of investigating
secondary environmental Impact
Theoretically, there are different ways in which the magnitude of secondary environmental impact due to vehicle care chemicals can be investigated.
One possibility is to survey sales ofvehicle care pro-ducts such as degreasers, car shampoos, rustproo ng and rust repair preparations. However, 100% coverage in such a survey is not possible in practice. There is a vast number of different types of preparations and dif-ferent makes which come and go, which gain and lose market shares and whose composition changes. There are also a number of chains of outlets which may have different market shares over time or in different geo-graphical areas.
Another possibility is to collect data as to how often and in what way owners ofvehicles (private individuals or companies) wash their vehicles. The reports of the National Board for Consumer Policies on vehicle main-tenance contain some data in this regard. A new com-pilation of the raw data of the Board shows that there are some differences between salted and unsalted regions regarding wash frequency, money spent on vehicle care, the frequency of rustproofmg treatment and rust prob-lems (Bilunderhall, 1993).
We decided to use postal questionnaires to collect data as to how private car owners look after their cars in unsalted/lightly salted and normally salted regions with similar climates. The questionnaire is reproduced in Ap-pendix No. 1.
3.3 Procedure used In the preliminary survey
The regular reports ofthe National Board for Consumer Policies on vehicle maintenance (Bilunderhall, 1993) contain questions on e. g. washing of cars and rust dam-age. The report from 1993 sets out the results of a questionnaire survey made in 1991 on a population of ca 10,000 car owners. From the raw data in the replies to these questionnaires, we extracted those resident along the coast ofVasterbotten County (175 respondents; salted), along the Norrbotten coast (142 respondents; unsalted), on the mainland near Gotland1 (51 respon-dents; salted) and on Gotland (49 responrespon-dents; unsalted),
1 Postal code areas Valdemarsvik, Gryt, Gusum, Gamleby,
Véistervik, Loftahammar, Edsbruk, Overum, Hjorted,
Ankarsrum and Figeholm.
and made a preliminary assessment by using bar dia-grams. The number of observations is a little too low to permit statistically reliable conclusions, but we use these results as an indication whether this type of survey can provide any information regarding differences between salted and unsalted regions.
3.4 Procedure used In the main survey
From the Vehicle Register, we ordered the addresses of 2,400 private car owners (company cars, leasing and other cars owned by legal entities were not included in the sample), 600 from each of the following regions:
1. Timra, Harnosand and Kramfors municipalities in Vastemorrland County (normally salted)
2. Umea and Robertsfors municipalities in Vasterbotten County (lightly salted)
3. Vastervik and Valdemarsvik municipalities on the coast near Gotland, in the following referred to as the mainland (normally salted)
4. Gotland (unsalted).
Note that the National RoadAdministration has changed its salting strategy in Vasterbotten since data for the preliminary survey were collected.
Note also that comparisons can be made only between regions of similar climate, which means that we can only compare the two regions in Norrland with one another
_ and Gotland with the mainland.
In the Norrland regions, with the help of the postal code maps of the Post Of ce we removed the addresses in those postal code areas which were not near the salted main roads. The distance between the dwelling and a salted main road can vary and is difficult to judge since the boundaries of the postal code areas are not marked. The idea of the selection process is to include drivers who can be reasonably expected to drive on the main road at regular and fairly close intervals. It is dif cult to draw a clear line of demarcation. A list of the postal addresses to which the questionnaires were sent is given in Appendix No. 3.
Questionnaires were sent to all the 600 addresses in Valdemarsvik and Vastervik municipalities and to all the 600 on Gotland. All postal code areas in Valdemarsvik and Vastervik are near salted roads.
On the municipal road network, salt was spread as follows during winter 1995/96:
VTI MEDDELANDE 798A
Vasternorrland (normally salted):
Timra salt alone and salt-sand mixture
HamOSand salt-free
Kramfors salt-sand mixture
Vasterbotten (lightly salted):
Umea salt-sand mixture
Robertsfors salt-sand mixture
Mainland (normally salted):
Vastervik salt alone and salt-sand mixture
Valdemarsvik salt-sand mixture
(Sandahl, 1996)
We adopted a number of questions from the form used by the National Board for Consumer Policies, but con-sidered that we had to rephrase some other questions so that they should suit our purpose.
The survey population comprises cars registered and on the road from 1 October 1995 until 30 April 1996. At the top of the form there is a question whether the car was on the road during the whole of this period. If the answer is No , no further questions need be answered. Two reminders were despatched, with a new ques-tionnaire appended to the first. The initial letter was sent out at the end of May and the reminders in June. A few questionnaires which arrived after 5 August were not included in data processing which started on that date.
Response percentage was 70.3%. See Appendix No. 4
for the number of responses and non-responses.
3.5 Processing of data
Data were subjected to statistical treatment in Excel and SPSS. We used variance analysis to test for signi cant differences in the continuous variables number of washes and consumption of screen wash uid in the different regions. We postulated a linear model. All the explanatory variables are in categories.
Cross tabulation, in certain cases combined with a
xz-test (Pearson), was used for the analysis of the other variables. It was borne in mind that there is a greater probability of a true hypothesis being rejected when many tests are made using the Bonferroni rejection test. Processing of the data was concluded by calculating the percentages of the differences we had found in the areas surveyed.
4 Results of the preliminary survey
No evident differences between an unsalted area and a corresponding salted area, regarding the number oftimes
a car is washed, can be discerned from the data of the
National Board for Consumer Policies; see Figure 1. Those living in Norrbotten may possibly be said to have washed their cars a little less frequently than those in Vasterbotten (a higher frequency of every other
mont as against a higher Vasterbotten frequency of
once a month and every other week ). On Gotland and the mainland the small differences which exist are less systematic. Note that a comparison should be made only between the mainland and Gotland, and only be-tween Vasterbotten and Norrbotten.
100% -' esz- l m
llllllllillL
E: 5;: 5 :30% -
90%70% ~
60% :_
50%
3-40%
:-3o% :_
20% :
10%
0% _ ., V. botten Norrbotten Figure IMainland
There are larger differences between salted and un-salted areas as regards money spent on looking after the car; see Figure 2. There is a higher frequency of re-sponses which imply that expenditure is lower in unsalted areas. The differences between Vasterbotten and Norr-botten are larger than between Gotland and the mainland. However, on Gotland the frequency ofthe response SEK 0 is higher than on the mainland, and on Gotland there is also less expenditure above SEK 1,500. It is not known what is the purpose of the higher expenditure.
'r , .mn xu-%
iiTilillliiE
never IE] once or twice a every other month
once a month every otherweek E once a week I often
Gotland
Responses to the question About how often was the car washed during the first half of 1991, i. e. between January and June? No salt was spread in Norrbotten or on Gotland.
1 00% 90%
E?
llllllll
70% 80% 60% 50% 40% 30% 20% 10% 0% Figure 2More people on Gotland and in Norrland neglected to do something about rustproo ng during the 12 months that the question referred to than people in the areas where salt had been spread. See Figure 3.
VTI
V.botten Norrbotten Maln land Gotland
lllllllllll"Hill
SEK 0 IIIIISEK 1-100 SEK101-200 SEK 201-400 SEK 401-600 ESEK 601-800 ISEK 801-1000 EISEK 1001 -1500 @SEK 1501 -2000 SEK 2001 -3000 >SEK 3000Responses to the question About how much didyou spend on looking after your car during the past 12 months? The question referred to the cost ofrustproofing, washes, waxing etc, but not to repairs or maintenance service. No salt had been spread in Norrbotten or on Gotland
Data from the National Boardfor Consumer Policies.
MEDDELANDE 798A
In the salt-free regions fewer car owners had cor-rosion problems, in spite of the fact that, according to the gure, they had done less about rustproo ng. The differences are however small; see Figure 4.
100% 90% 80% -70% 60% 50% 40% -30% 20% 10% 0% -Figure 3 20 lilllllilHINIHIHHIHHHIi
V.botten Norrbotten Main land Gotland
No
Illl] Patch repalr E Inspection
Complete treatment at home Rustprooflng workshop
Responses to the question Has the car during the past 12 months had rustproofing treatment or had
its rustproofing inspected? The response choices were
H J}
No
Yes, I have on my own or with the help ofafriendpatched rusty places
Yes, the car has a current rustproofing guarantee and has been sent in for the prescribed inspection ofrustproofing
Yes, I have on my own or with the help ofafriend applied a complete rustproofing treatment Yes, at a rustproofing workshop
In Norrbotten and on Gotland no salt had been spread Datafrom the National Board for Consumer
Policies.
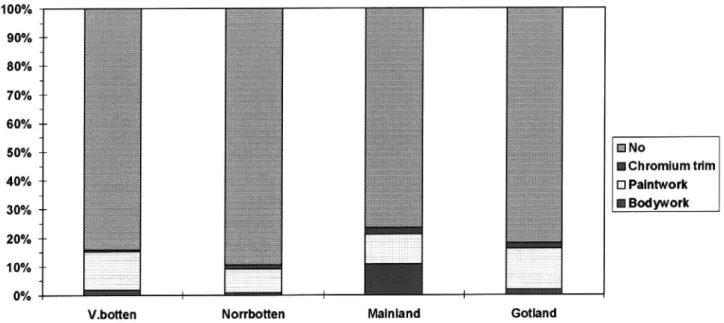
1 00% 90% 80% 70% 60% 50% N0 lChromium trim 40% E] Palntwork 30% I BOdywork 20% 1 0% 0%
V.botten Norrbotten Malnland Gotland
Figure 4 Responses to the question Have you hadproblems with the car due to corrosion? The response choices
were
o, no appreciable corrosion damage
Yes, but only super cial corrosion on the chromium trim or paintwork
Yes, quite extensive corrosion damage to the bodywork and/or structural components . In Norrbotten and on Gotland no salt had been spread
Datafrom the National Boardfor Consumer Policies.
Since the results of the preliminary survey showed formation needed, we decided to proceed with the main
that putting questions to car owners may elicit the in- survey in the form of a questionnaire study.
5 Results of the main survey
Compilation ofthe responses to the questionnaire shows degreasers were used. There was also an evident
dif-that there are clear differences in how cars are looked ference between the different regions as regards the use
after in salted and unsalted regions. This primarily applies of screen wash uid. Responses to the questions on
to how often the cars were washed and to what extent the form are summarised in Table 1.
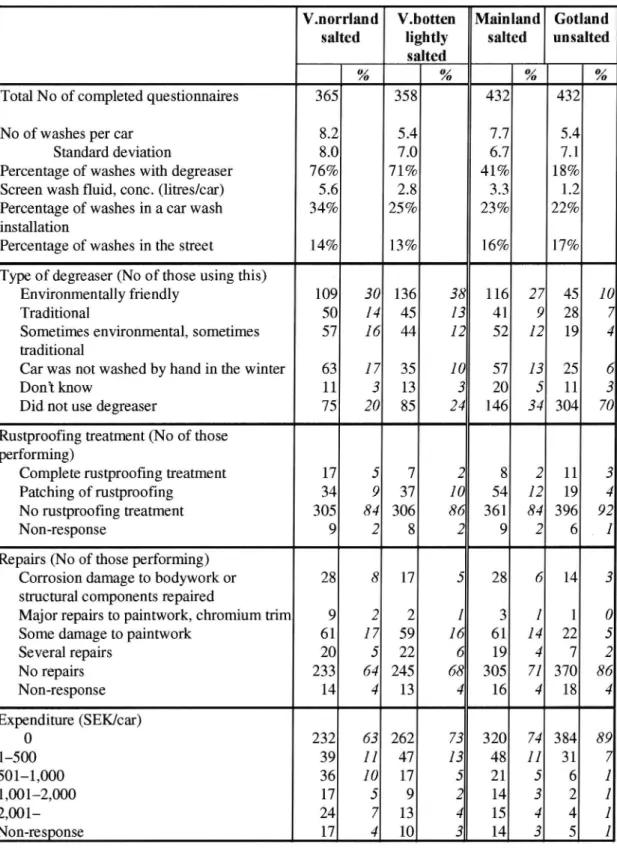
Table 1 Summary ofresponses to the questions in theform.
V.n0rrland V.b0tten Mainland Gotland
salted lightly salted unsalted
salted
% % % %
Total N o of completed questionnaires 365 358 432 432
No of washes per car 8.2 5.4 7.7 5.4
Standard deviation 8.0 7.0 6.7 7.1
Percentage of washes with degreaser 76% 71% 41% 18%
Screen wash uid, conc. (litres/car) 5.6 2.8 3.3 1.2
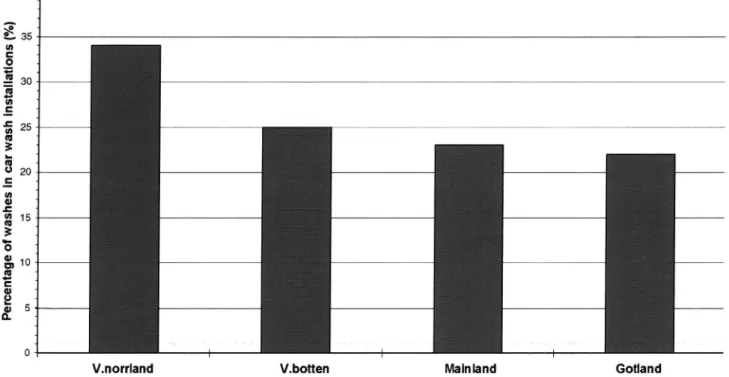
Percentage of washes in a car wash 34% 25% 23% 22%
installation
Percentage of washes in the street 14% 13% 16% 17%
Type of degreaser (No of those using this)
Environmentally friendly 109 30 136 38 116 27 45 10
Traditional 50 1 4 45 13 41 9 28 7
Sometimes environmental, sometimes 57 1 6 44 12 52 12 19 4
traditional
Car was not washed by hand in the winter 63 1 7 35 101 57 13 25 6
Don t know 11 3 13 3 20 5 11 3
Did not use degreaser 75 20 85 24 146 34 304 70
Rustproofing treatment (No of those performing)
Complete rustproo ng treatment 17 5 7 2 8 2 11 3
Patching of rustproofing 34 9 37 10 54 12 19 4
No rustproofing treatment 305 84 306 86 361 84 396 92
Non-response 9 2 8 2 9 2 6 1
Repairs (No of those performing)
Corrosion damage to bodywork or 28 8 17 5 28 6 14 3
structural components repaired
Major repairs to paintwork, chromium trim 9 2 2 1 3 1 1 0
Some damage to paintwork 61 1 7 59 16 61 14 22 5
Several repairs 20 5 22 6 19 4 7 2 No repairs 233 64 245 68 305 71 370 86 Non-response 14 4 13 4" 16 4 18 4 Expenditure (SEK/car) 0 232 63 262 73 320 74 384 89 1 500 39 I 1 47 13 48 1 1 31 7 501 1,000 36 10 17 5 21 5 6 1 1,001-2,000 17 5 9 2 14 3 2 1 2,001 24 7 13 4 15 4 4 1 Non-response 17 4 10 3 14 3 5 1
5.1 Variations In the breakdown of the car
population by age
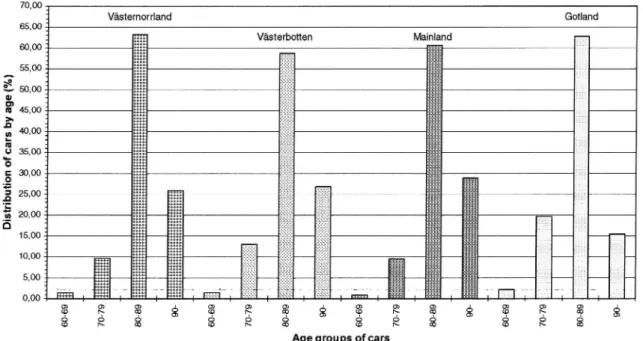
On Gotland where no salt has been spread for the past ten winters, beginning in winter 1986/87, cars are slight-ly older than in the other regions. See Figure 5. There is no appreciable difference in the breakdown of cars by age between the two regions in Nonland. In Vasterbotten County application ofsalt was radically reduced in winter 1994/95 (Widegren, 1996) after spreading of salt had begun some time in the middle ofthe 805. Salt application strategies are described in Appendix No. 8.
5.2 Wash frequency
The difference in the breakdown of cars by age between
Gotland and the mainland, described above, could in
itself give rise to a difference in wash frequency. As we can see from Figure 6, new cars are washed consider-ably more often than older cars. Variance analysis
shows, however, that even when this is taken into
ac-count there is a signi cant (p<0.01) difference in wash frequency in winter between Gotland and the mainland: 5.4 washes per car as against 7.7. Statistical results are set out in Appendix No 6.
In Vasterbotten and Vasternorrland the difference is somewhat larger, 5.4 as against 8.2 washes. This dif-ference is also signi cant (p<0.01).
70,00 Vésternorrland Gotland 65,00 Vésterbotten Mainland 60,00 55,00 3 Eamo 8 in 45,00 .5u, 40,00 l-m0 35,00 l. o : 30,00 .2 5 2500 a I ..'= .2 20,00 0 15,00 10,00 5,00 0% i
aeaaase
asaaasgg
s
2
s
e
2
s
8
2
s
s
e
8
Age groups of cars
Figure 5 Percentage breakdown of car population by age in the four regions.
11 Vasternorrland 10 9 I Mainland 8-Vésterbotten Gotland I WE l I.i .I. i.|. |l|! i!|! l.I .i. m .unhd'iil ' ": liii ii'i l'l iiii 'iii l'ii i}: :. Num be r of wa sh es pe r ca r
.r.i .r.i .r.l .r.i .n.i .r.l .r.i .l.l .i.. .r.i . 'Ii l I il I I I I I I l ,,. nigg er-o ::-::-: :n:: -:M :: ::: ::: .u: :-:--: sizir iri1 Li. ll ll -m l i l' l' li Ii Ii li q-pi [I li lI i. . I in ll I I I' ' ' ' l'l iiiiiii iiiiii iiliili lili'.i .'iiiii .'n u-'' i -: I I we u, m l . . . , . . , . .. . , . 1 , -i '¢' -r SI 'i Q 'H 6 'I n 6 ; 5" QI SS 'p SU pS h v' s ' ' nS d 'ui yén suf ru, vi . §' .5 \$ i \5 3' .5 .' ."> 'n ,uu, u, («A R uu < ii . W W
& 0) cp m ii iii! 8 co co 8 9:) 8o: co 5'N <0 on 3(D 8 ll i ti l' lil il l il li li lll il il 'v Ii ll li l Il il 'l I il il ili ll li li li li lil il il l I iI il l libii iiiii iiiii iiiii ii:it:iii! iiili liiii iiiii !iiir ill:i iiiii iiiii iiiii liibi ii' . _. .. . . A); ,s s4 v. swa nu. ". ,. s. ). ,«. s. s. s. s. s' . , -1 .) u5 t rsf t-f }y. {xj v'. 1' .»5 335 5HS 558 §55 S83 $23 38s }'. \'. '-. '.5 . <'. $'-S'. S. <.x$ u' mt g. . . .5). m. .5. m . m ay. .u'. n. r; .5. 3. m m . (m . 5. 5. 5. 5. 5 . . n .r. .r. .m l. . . 4 ( Ar ma n
-
W 9: o: 969 70-7(0 8 $ 8Car model (year) Figure 6
ages.
VTI MEDDELANDE 798A
Average number of washes per car in winter in different regions andfor cars ofdifferent
5.3 Degreaser
On Gotland degreasers were used in only 18% of
washes, while car owners on the mainland used them
in 41% of washes. In Vasterbotten degreasers were used in 71% of washes and in Vasternorrland in 76%. See Figure 7.
Two thirds of car owners on Gotland did not use degreasers at all, while the corresponding proportion on the mainland was much less than a third. One fth of car owners in Vasterbotten and one eighth in Vaster-norrland did not use any degreaser in the winter. In both the northern and southern regions there are relatively speaking large differences between the number of car owners who use a degreaser every time and the number who never use these. The numbers of those who use a degreaser in one wash out of two, one out of three or less than one out of three are more alike.
The differences between Gotland and the mainland regarding the use of a degreaser are signi cant (p<0.01),
as are those between Vasterbotten and Vasternorrland
(p=0.04).
On Gotland there is less propensity than on the main-land to use environmentally friendly degreasers. See Table 1. In Vasterbotten there is a relatively larger use of environmentally friendly degreasers than in
Vaster-norrland, i.e. there is a difference between the north and
south in the use of environmentally friendly degreasers in salted regions and regions lightly or not at all salted.
5.4 Screen wash fluid
On Gotland considerably less screen wash uid was used (1.2 litre during the winter) than on the mainland (3.3 litres). A difference of the same order can be seen be-tween Vasterbotten (2.8 litres) and Vasternorrland (5.6 litres). See Figure 8 and Table 1. The differences are signi cant (p<0.01). 80 01 O Us e ofde g re as er W. ) 8 8 7o-60 2o: 10; i o- : Véisterbotten vastemorrland Figure 7 24
It
Mainland GotlandPercentages of the total number of washes in which a degreaser was used.
Us eof sc re en wa sh ui d (I itre sl ca r)
ol
vasterbotten vasternorriand Figure 8 5.5 Rustprooflng treatmentThe number of car owners who patched the rustproofmg during the winter is almost three times as high on the
mainland as on Gotland, while there is little difference
between the two regions regarding complete rustproof-ing treatment (a few more treatments on unsalted Got-land). In Vasternorrland (salted) more than twice as many have carried out complete rustproofmg treatment as in Vasterbotten, but there is less difference in patch repairs between the two regions in Norrland (slightly more in Vasterbotten). See Table l.
About 40 car owners in each region changed their car during the winter and provided information for their previous car . The gures are fully in line with those for the present car as described in the paragraph above.
On the whole, there are only a few car owners who have carried out any rustproo ng treatment and it is therefore dif cult to draw reliable conclusions.
5.6 Repair of corrosion damage
In the two counties in Norrland the differences between the frequency of repair of corrosion damage are insig-ni cant. The proportion of cars on which various kinds of corrosion damage were repaired is two three times as high on the mainland as on Gotland. See Table 1.
Information relating to the previous car makes no
VTI MEDDELANDE 798A
Gotland Mainland
Use ofconcentrated screen wash uid, litres/car, in the different regions.
decisive difference if added to the gures for the present car .
Repairs of corrosion damage are also quite infre-quent, and regarding this variable also it is difficult to
draw reliable conclusions.
5.7 Money spent on corrosion damage
The frequency of little or no expenditure on corrosion damage was somewhat higher in lightly salted Vaster-botten, while expenditure over SEK 500 occurred about twice as often in conventionally salted Vasternorrland. See Table 1. On Gotland, a larger proportion had no expenditure at all than on the mainland. On the other hand, on the mainland there is a greater proportion of car owners in all the other expenditure categories. However, the number of those who had no expenditure is much higher in proportion to those who had none.
5.8 Where is the car washed?
The percentage of washes in car wash installations and the percentage of washes in a paved street, parking space and drive does not follow the same pattern as the other variables. In Vasternorrland washes in car wash in-stallations are considerably more usual than in the other regions. In the southern survey regions a higher per-centage of washes occurred in the street than in the northern regions. See Figure 9 and 10.
4O (D 01 0. ) O N 01 .5 U1 .5 O Pe rc en ta ge of wash es in ca r wa sh in stal la ti on s (% ) N O 01 . . I O - l lI l 4I
V.norr|and V.botten Maln land Gotland
Figure 9 Percentage of washes carried out in car wash installations.
20
24°
2' 15g _
65w _ 5 _ .Em _ o.c 10 -U) to _ 3 '5 . oa, . . Sc . 0 2 5 -a:o. a .o -
l
:
'r
V-nomand V.botten Mainland Gotland
Figure 10 Percentage ofwashes carried out in a paved street, drive or parking space.
5.9 Many comments regarding salt
On Gotland, a third of those who responded wrote a comment to the effect that it was good not to have salt on the roads. Nobody in this region expressed a wish that they wanted salt spread again. In the other regions fewer made a comment on salt, although there were also
26
rather many in Vasternorrland County, about one fth. Among these there are also some comments in favour of salt. Note that we did not ask for people s opinions regarding salt and only mentioned skid prevention in the rst covering letter. A selection of comments is repro-duced in Appendix No. 5.
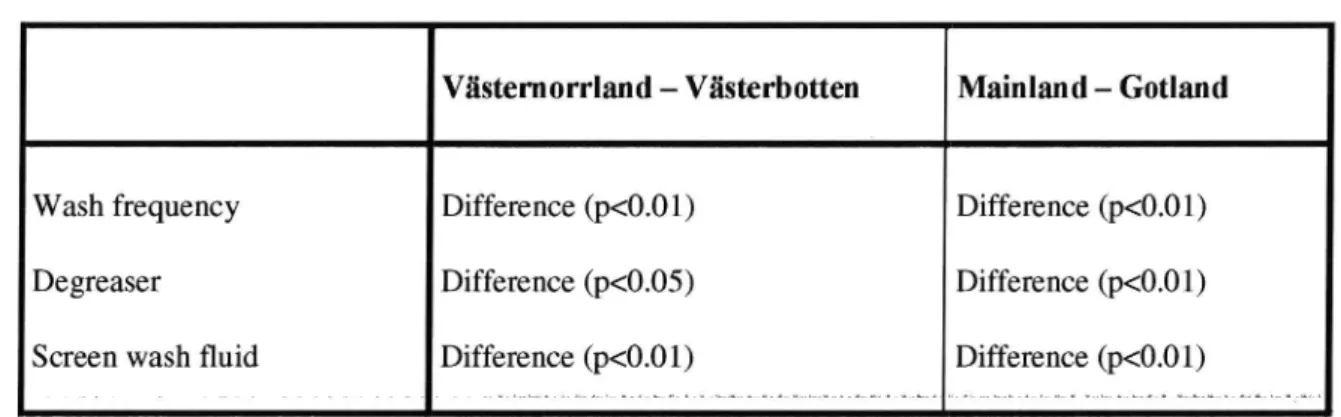
5.10 Summary of results
VH
Table 2 Di erences between the investigated regions.
Viisternorrland Viisterbotten Mainland Gotland
Wash frequency
De greaser Screen wash uid
Difference (p<0.01) Difference (p<0.05) Difference (p<0.01) Difference (p<0.01) Difference (p<0.01) Difference (p<0.01) MEDDELANDE 798A 27
6 Discussion
There are quite large differences in climate between the north and south of Sweden, and these are probably very signi cant regarding the greater use of degreasers and screen wash uid and the higher frequency of washes in the north. It is consequently impossible to draw any conclusions regarding the effect of salt from compari-sons between north and south. In the following, com-parisons will therefore only be made between the pairs ofregions Gotland Mainland and Vasterbotten Vaster-norrland.
6.1 Can the differences between regions have
a cause other than application of de-icing
salt?
There are several dissimilarities apart from the dif-ferences in skid prevention strategies between the salted and unsalted regions, and these may be signi cant for the factors which we measure. Breakdown of the car population by age is similar in Vasterbotten and
Vaster-norrland, but there is some difference between Gotland
and the mainland. Our data cannot provide any infor-mation on the extent to which this is attributable to Gotland s freedom from salt during the past ten years. Economic, social and cultural differences may play a part. Obviously, such factors may also have a certain
effect on how clean it is considered a car should be, and
they may consequently also affect wash frequency and the use of chemicals. It is however not improbable that ten years freedom from salt and the lower frequency of repairs of corrosion damage on Gotland are related. Caruse on Gotland is appreciably different from that on the mainland. Journeys are seldom long since it is not usual to travel to the mainland by car. Nor has Got-land any through traf c like the coastal region opposite the island. The topography on Gotland is also distinctive: the island is very at, which facilitates skid prevention and thus the abolition of salt application.
Tyre studs are used to a considerably greater extent in the north of Sweden (more than 80% on average in winter) than in the south where the gure is between 30 and 50% (Jacobson, 1996). When application of salt on Gotland was stopped in 1986, the use of studded tyres increased from 74 to 80% (maximum, highest percentage in winter), but it changed at the same time
28
and in a similar way in the Vastervik area where the same salting strategyas before was retained (Oberg, 1991b). There are no data of more recent date for the regions to which we sent questionnaires. Use of studded tyres has great signi cance regarding the quantity ofasphalt par-ticles that are torn out and adhere to the paintwork; see also Section 1.2.
Consumption of screen wash uid may be related to traffic density. The more often a car is overtaken or passes another car, the more probable it is that the wind-screen becomes dirty if the road is covered in slush.
Some differences in relative car ownership between men and women can also be discerned in the different regions. Men wash their cars more often than women.
Whether this is due to the fact that men, on average,
have newer cars and new cars are washed more often than older ones (see Figure 6), or whether it is because
men and women have different attitudes to their cars, is not certain. Variance analysis shows, however, that
the above differences in wash frequency and the use of screen wash uid between salted and unsalted regions are signi cant, even when allowance is made for the sexes of owners, age of car or distance driven in winter. Some statistical material is reproduced in Appendix No. 6.
The results of the survey may have been in uenced so as to make the differences larger than they are in actual fact by the somewhat unfortunate formulation of para-graph 1 ofthe rst covering letter. It is pointed out there that skid prevention measures are one ofthe reasons that cars get dirty. The people interviewed are well aware of what method of skid prevention is used in the area where they live, and they might have been in uenced by this. It is considered however that this could not have resulted in more than a marginal increase in the differences measured.
6.2 What if the whole of Sweden were to become salt-free?
What would happen if application of salt were discon-tinued in the whole of Sweden? Our investigation areas are not fully representative of the country as a whole, but comparisons between pairs of these may provide
some indication. For instance, if we make a projection
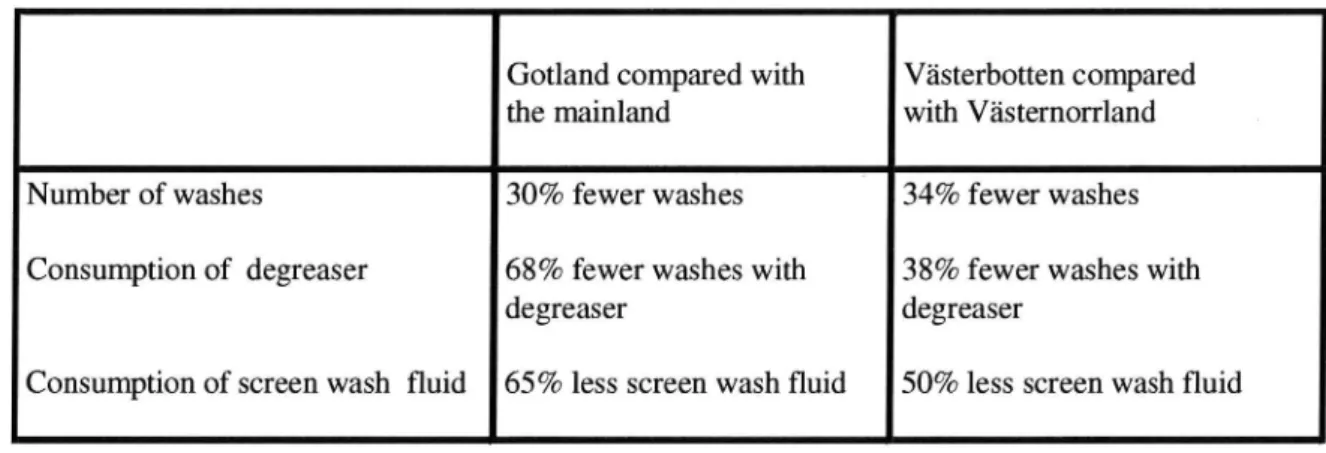
Table 3 Percentage difference between salted and unsalted regions regarding number of washes and the consumption of degreaser and screen wash uid
Gotland compared with
the mainland V'eisterbotten comparedwith Vasternorrland
Number of washes
Consumption of degreaser
degreaser Consumption of screen wash uid
30% fewer washes 68% fewer washes with 65% less screen wash uid
34% fewer washes
38% fewer washes with degreaser
50% less screen wash uid
from the results for Gotland and the mainlandz,
con-sumption of degreasers would be reduced by 68%. See Table 3. This assumes that the same amount of degreaser is used in every wash regardless of whether or not the roads are salted. Our data can provide no information whether the dosage of degreaser is the same with and without salt application.
In certain cases there are striking differences be-tween Gotland and the mainland, while the correspond-ing differences between Vasterbotten and Vastemorrland are less pronounced or non-existent. This may at least partly be due to the fact that Vasterbotten has not been completely salt-free; small quantities of salt had been spread, especially in the autumn of 1995. As regards wash frequency and the use of screen wash uid, there are evident and similar differences in both pairs of regions. On the other hand, there is much more dif-ference in the use ofdegreaser between Gotland and the mainland than between the two northern regions. Is it perhaps so that a longer time without salt is needed be-fore car owners discover that the car will be clean with-out as much degreaser as they have been accustomed to using?
6.3 Where the car Is washed
Whether the car is washed in a car wash installation or in the street does not appear to have anything to do with the type of salting strategy. These variables do not at all
2 On the mainland, 41% of all washes in winter have
de-greaser added, i.e. 41 washes out of 100 (see Figure 7). On unsalted Gotland the corresponding gure is 18%, and in addition the total number of washes is smaller, 70% ofthat in a salted region. Out of 100 washes 70 will thus remain when no more salt is spread, and degreaser is used in 18% of these, i.e. in '13 washes. A reduction from 41 to 13 washes is a reduction by 68%.
VTI MEDDELANDE 798A
conform to the clear patterns of the others, which show more or less striking differences between a lot of salt on the one hand and little or no salt on the other.
6.4 Investigations of wash frequency by the
National Board for Consumer Pollcles
Previous investigations by the National Board for Con-sumer Policies of car maintenance by Swedish car owners (e. g. Bilunderhéll, 1993) show that the average car owner washes the car about 20 times a year. The most recent investigation by the Board (Bilunderhall,
1995 96) sets separate questions for the winter months,
November April, and the summer months, May
October. According to the Board, private car owners wash their car on average 8.1 times during the winter months and 9.9 times during the summer months. The gures of the Board for the winter months may be com-pared with ours: 7.7 washes in a salted region in the south of Sweden and 8.2 washes in a salted region in the north. Note that the Board s winter period is a little shorter than ours, and that the Board s population of cars comprises only models since 1980. We have not put any limits on the age of a car. Figure 6 shows that new cars are washed more often. In addition, we have put our questions in a different way, which may affect the re-sults: we have made the question relating to car washes in the winter open ended, while the Board gave the
choices several times a week , about once a week , etc.
6.5 Development over time other cases, e.g. the use of car cleaners and treatment
against corrosion, some familiarisation and dissemination of information between car owners are perhaps needed before people realise that the need for these changed when spreading of salt stopped.
It may be presumed that some variables, such as wash frequency and the consumption of screen wash uid, change rapidly when application of salt ceases. These are probably adjusted according to obvious needs. In
7 Conclusions
This study demonstrates that secondary environmental impact due to salting does occur. We can state that application ofsalt contributes to higher wash. frequency and increased use of chemicals for the care of cars. There are signi cant differences between both Gotland and the mainland and between Vasterbotten and Vaster-norrland where the differences in salt application rate are comparatively smaller.
VTl MEDDELANDE 798A
If salt-free winter road management were to be in-troduced, this would therefore mean that a smaller quan-tity of chemicals is needed for cleaning and for rust-proo ng, and that vehicles may last longer. The use of degreasers would be appreciably reduced ifapplication of salt ceased, perhaps to one half of their present use.
31-8 Bibliography
Bilunderhall 1993, Attityder Beteenden Problem Kostnader (Car maintenance, Attitudes Behaviours Problems Costs) (in Swedish). Report No. 1992/ 93:25. National Board for Consumer Policies. Stockholm. 1993.
Bilunderhall 1995 96, Tabeller (Car maintenance 1995 96, Tables) (in Swedish). T 11161. National Board for Consumer Policies. Stockholm. 1995
1996.
Bilunderhall 1995/96, Teknisk beskrivning, For
Konsumentverket (Car maintenance 1995/96, Speci cations, for the Board) (in Swedish). T-11161. National Board for Consumer Policies. Stockholm.
1996.
Danielsson, H: Personal communication. Swedish
National Road Administration. Borlange. 1 996. Fordonstviitt, Mal och riktviirden (Washing of
vehicles Targets and recommended values) (in
Swedish). National Environmental Protection Agency. Stockholm. 1996.
Gustafson, K: VTI:s viigforskning ur miljiiperspektiv and Slitstyrka hos belaggningar (Environmental
aspects of VTI road research and The abrasion
resistance of road surfacings. (in Swedish). Talk at
Better technology on roads a development
conference on 22 March 1995, Stockholm Arlanda.
VTI reprint No. 243, Swedish National Road and Transport Research Institute. Linkoping. 1995.
Helmers, G and Ytterbom, U: Saltningens inverkan
pa vaglagets smutsighet (The effect of salt application on the dirtiness of roads) (In Swedish). VTI Report No. 286. Swedish National Road and Transport Research Institute. Linkoping. 1986.
Jacobson, T: Personal communication. Swedish
National Road and Transport Research Institute. Linkbping. 1996.
32
KEMI: Tillsynsprojekt bilvardsprodukter vilja till f6réindring(Surveillance project, car care products willingness to change. (in Swedish). Report No. 3/92. National Chemical Inspectorate. Stockholm. 1992.
KEMI: Bilvardsprodukter utveckling och
forekomst (Car care products development and
occurrence) (in Swedish). Report No. 8/95 . National Chemical Inspectorate. Stockholm. 1995.
Noreland, J: Personal communication. Swedish
National RoadAdministration. Borlange. 1996.
Oberg, G, Gustafson, K and Axelson, L: Effektivare
halkbek mpning med mindre salt, MINSALT-projektets huvudrapport (More effective skid
prevention with less salt Final report on the
MINSALT project) (in Swedish). VTI Report No. 3698A. Swedish National Road and Transport
Research Institute, National RoadAdministration and
Swedish Association ofLocal Authorities. Linképing. 1991a.
Oberg, G et al: MINSALT Forsiik med osaltade viigar
(MINSALT Tests on unsalted roads) (in Swedish). VTI Bulletin No. 637. Swedish National Road and Transport Research Institute. Linkoping. 1991b.
Sandahl, J: Personal communication. Swedish
Association of Local Authorities. 1996.
TemaNord: Effekter av saltning och punksaltning pa gator (The effects ofsalt application and localised salt application on streets) (in Swedish). TemaNord 1994: 511 . Nordic Council ofMinisters. Copenhagen. 1994.
Widegren, 0: Personal communication. Swedish National Road Administration. Borlange. 1996.
Appendix 1 Page 1(3)
Questionnaire regarding car care
[
\
J
r
a Are you [I female El male?
Year of birth? 19
Did you have a car on the road all last winter? (1 October 95 30 April 96)
EIYes, I had at least one car on the road all winter
EINo, I had a car only part of the winter
EINo, I had a car but it was off the road during all or part of the winter
Ifyou have answered NO to this question, you need
not answer any more questions. Please return the
form in the post paid envelope.
If you owned more than one car at the same time, the following questions refer to the car which you used most.
The questions refer to the car (or cars if you have changed cars) which you owned last
win-ter. It makes no difference whether it was you or somebody else who used the car or cars
most.
4.
V
What year is the car (or cars if you have changed cars)?
Year: Year of previous car:
About how many kilometres was the car driven last winter (Oct 95 April 96)?
If you have changed cars, how many kilometres in all were the cars driven ?
D0 km Ell 5000 km D5001 10,000 km [110,001 15,000 km [115,001 20,000 km [120,001 25,000 km [325,001 km or more
About how many times in all was the car washed during last winter? No of times:
How often was a degreaser used last winter? UFor every wash
EIFor every other wash
CIFor every third wash
ULess often than every third wash
UNot at all > Go to Question 9
8.
Appendix 1 Page 2(3)
When the car was washed by hand, was the degreaser used an environmentally friendly or traditional type?
EIEnvironmentally friendly El Traditional
El Sometimes environmentally iendly, sometimes traditional EIThe car was not washed by hand last winter
UDon t know
How often was the car washed in a car wash installation?
[Every time
El Every other time
[I Every third time
ClLess often than every third time DNever
10. How often was the car washed in a paved street, parking space or drive?
11.
12.
13.
El Every time [:IEvery other time DEvery third time
EILess often than every third time
EINever
How much screen wash uid was used in the car last winter?
El About litres concentrated
CIAbout litres ready mixed
EINone at all CIDon t know
Was the car given rustproofing treatment last winter? (1 October 95 30 April 96)
The car you had The previous car
30 April (if you have changed cars)
Complete treatment [I [3
Patch repair of rustproofmg Cl C]
No treatment Cl I]
Was any of the following repairs made on the car last winter? Put one or more crosses.
The car you had The previous car
30 April (if you have changed cars)
Corrosion damage to bodywork or
structural components was repaired I] D
Major repairs were made to paintwork
or chromium trim I] [I
Small damage to paintwork was patched I] I]
No, no corrosion damage was repaired El El
Appendix 1 Page 3(3)
14. How much money did you spend on corrosion damage last winter?
1:1 SEK 0
E1 SEK 1 500
1:1 SEK 501 1,000
1:1 SEK 1,001 2,000
1:1 2,001 3,000
U More than SEK 3,000 Do you want to add anything?
Thank you for your help!
Appendix 2 Page 1(3)
Covering letter
How do you look after your car?
When the car is used in the winter, it becomes dirtier than in summer. One of the reasons for this is that the roads
must be kept free from ice. The National Road and Transport Research Institute (VTI) is now carrying out a survey of how car owners look after their cars in winter.
You have received this questionnaire through being selected from among car owners in some municipalities in Sweden. All you have to do is to answer the questions in the form, in most cases just by putting a cross in the space
con-cemed.
It is naturally entirely up to you whether you want to take part, but every answer we get increases the value of the survey. We would therefore be very grateful ifyou would ll in the questionnaire and return it in the post paid enve-lope as soon as possible. The answers will be dealt with in strict con dence, and nobody will be able to nd out what you have answered. The number printed on the form is used only to tick off the answers received, so that a reminder is sent only to those who have not answered. However, if for some reason you decide not to take part, will you please return the blank questionnaire.
Please ring us if something is not clear. Thank you in anticipation. Yours sincerely
Eva Gustavsson Janet Yakoub
Research Engineer Research Engineer
Appendix 2 Page 2(3)
Reminder
How do you look after your car?
A week or two ago we sent you a letter containing questions about how you look after your car. We would be very grateful if you would answer the questions and return the questionnaire in the post paid envelope within one week. You have received this questionnaire through being selected from among car owners in some municipalities in Sweden. All you have to do is to answer the questions in the form, in most cases just by putting a cross in the space con-cerned.
The answers will be dealt with in strict con dence, and nobody will be able to nd out what you have answered. The number printed on the form is used only to tick offthe answers received, so that a reminder is sent only to those who have not answered. However, if for some reason you decide not to take part, will you please return the blank questionnaire.
If you have replied in the last few days, please ignore this reminder. Please ring us if something is not clear. Thank you in anticipation. Yours sincerely
Eva Gustavsson Janet Yakoub
Research Engineer Research Engineer
Appendix 2 Page 3(3)
Second reminder
Please let us know how you look after your car!
A few weeks ago we sent you a letter containing questions about how you look after your car. A fortnight ago we also sent you a reminder.
If you answer the questions and send in the form in the post paid envelope within a week, you will have very greatly helped research into road traf c.
You have received this questionnaire through being selected cm among car owners in some municipalities in Sweden. All you have to do is to answer the questions in the form, in most cases just by putting a cross in the space con-cerned.
The answers will be dealt with in strict con dence, and nobody will be able to nd out what you have answered. The number printed on the form is used only to tick off the answers received, so that a reminder is sent only to those who have not answered. However, if for some reason you decide not to take part, will you please return the blank questionnaire.
If you have replied in the last few days, please ignore this reminder. Please ring us if something is not clear. Thank you in anticipation. Yours sincerely
Eva Gustavsson Janet Yakoub
Research Engineer Research Engineer
Appendix 3 Page 1( 1)
The test areas
The questionnaires have been sent to car owners in the following areas: .
Vasternorrland V sterbotten Mainland Gotland
1. Scrberge Umea Ankarsrum Burgsvik
2. FagerVik Hjorted Havdhem
3. Bergeforsen Totebo Hemse
4. Scraker Gunnebo Stanga
5. Timra Loftahammar Ljugarn
6. Alandsbro Robertsfors Overum Klintehamn
7. Utansjo Edsbruk Romakloster
8. Ramvik Vastervik Dalhem
9. Bjartar Gamleby Slite
10. Ullanger Gusum Tingstade
11. Docksta Ringarum Larbro
12. Nyland Gryt Faresund
13. Hamosand Valdemarsvik Visby
14. Kramfors 15. Lunde 16. Sandbverken 17. Bjartra 18. Skog 19. Bollstabruk 20. Vaja
N.B. Due to erroneous codes in the Vehicle Register, two addresses in SoderkOping and one address in Atvidaberg were by mistake included in our sample.
Appendix 4 Page 1(3)
The survey population
The survey population comprises cars registered and on the road (1 October 95 30 April 96). Total number of questionnaires sent out: 2,337
Number of questionnaires sent in: 1,809 (77.4%): o 3 did not own a car
4 were returned to sender
51 had the car on the road for only part of the winter 22 had the car off the road
The sample was thus reduced to 2,257.
101 of the forms received were not lled in
13 were lled in wrongly (both the sex and age of the car owner and the year of the car wrong) 9 had no number on the questionnaire
19 did not say when they had the car on the road. These are included in the non-response element.
Of the 2,337 questionnaires sent out, 1,587 (70.3%) form the basis for the processing of data.
Appendix 4 Page 2(3)
GENERAL DESCRIPTION OFTHE SURVEY POPULATION
Sex and age
Of those who had the car on the road in the winter (1 Oct 95 - 30 April 96), 1133 were male, 421 female, and 33 did not indicate their sex.
percentage sex male 71.4 female 26.5 not given 2.1 n = 1,587 age 19 29 10.3 30 39 20.7 40 49 22.4 50 59 18.9 60 69 14.1 70 79 9.6 80 91 1.6 not given 2.3 n = 1,587
Sex and age broken down by region
0 Vasternorrland County: n = 365 percentage No of washes per car sex male 70.1 8.7 female 27.1 6.6 not given 2.2 age 20 29 10.4 7.3 30 39 18.3 9.3 4049 21.6 7.6 50 59 21.1 9.4 60 69 14.0 8.5 70 79 9.3 6.1 80 88 2.5 3.0 not given 2.7
Appendix 4 Page 3(3) 0 Vasterbotten County: n = 358 percentage N0 of washes per car sex male 71.6 ' 6.1 female 25.4 3.6 not given 1.7 age 20 29 13.4 3.8 30 39 25.4 6.4 40 49 22.9 4.9 50 59 15.6 5.8 60 69 15.1 5.4 70 79 5.3 6.0 80 83 0.3 7.0 not given 1.9 0 Mainland: n = 432 percentage N0 of washes per car sex male 76.3 8.0 female 20.8 6.7 not given 2.5 age 20 29 8.8 7.3 30 39 18.5 7.6 40 49 19.9 8.1 50 59 21.5 8.9 60 69 12.9 7.4 70 79 13.4 7.0 80 91 2.1 3.4 not given 2.8 0 Gotland County: n = 432 percentage No of washes per car sex male 65.5 5.8 female 32.6 4.3 not given 1.9 age 20 29 9.3 6.2 30 39 20.8 4.2 40 49 25.0 5.4 50~59 17.1 6.3 60 69 14.6 5.7 70 79 9.7 5.0 80 85 1.6 3.1 not given 1.8
Appendix 5 Page 1( 1)
Comments on salt (sample)
Percentage
Region: County of V.norrland 22.7 %
n = 365 County of V.botten 14.0 % n = 358 Mainland 7.9 % n = 432 Gotland 33.0 % n = 432 From Vasterbotten
My opinion is that winter road salting causes rust damage on my car, increases the use of screen wash uid and use of not environmentally friendly degreaser. Environmentally friendly degreaser can not take away the salt from the car.
Stop salting roads, get the velocity down, more speed controls. From Vasternorrland
The salting must be stopped, people must learn adapt the speed to the current state of the road. I prefer slipperiness to salting of roads.
I hate de-icing salt, exchange the salt for common sand, the traf c should be adapted to the state of the road From the mainland
Stop salting of all roads!
Take away the salt from the roads so that people learn to drive slowlier. From Gotland
I live on Gotland and I drive on unsalted roads, Very good! Salt-free roads are good for the car and the environment.
As we have unsalted roads on Gotland, in fact, we don t need any degreaser when washing the car.
Appendix 6 Page 1(6)
Statistical calculations
Gotland - Mainland
Tests of Significance for NUMBER OF WASHES using UNIQUE sums of squares
Source of Variation SS DF MS F Sig of F
WITHIN+RESIDUAL 5427.90 195 27.84
REGION GOTLAND MAINLAND 394.28 1 394.28 14.16 .000
DISTANCE DRIVEN 270.63 3 90.21 3.24 .023 YEAR OF CAR 69.74 3 23.25 .84 .476 SEX 85.00 1 85.00 3.05 .082 (Model) 970.94 8 121.37 4.36 .000 (Total) 6398.84 203 31.52 R-Squared = 152 Adjusted R Squared = .117
Combined Adjusted Means for REGION
Variable .. NUMBER OF WASHES REGION GOTLAND MAINLAND
UNSALT UNWGT. 5.00056
SALT UNWGT. 7.96487
Combined Adjusted Means for DISTANCE DRIVEN
Variable .. NUMBER OF WASHES DISTANCE DRIVEN
1 UNWGT. 4.97076
2 UNWGT. 6.00807
3 UNWGT. 8.57221
4 UNWGT. 7.32889
Combined Adjusted Means for YEAR OF CAR
Variable .. NUMBER OF WASHES YEAR OF CAR
1 UNWGT. 5.00000
2 UNWGT. 4.96549
3 UNWGT. 6.84580
4 UNWGT. 7.52518
Combined Adjusted Means for SEX
Variable .. NUMBER OF WASHES SEX
Male UNWGT. 8.46533
Female UNWGT. 5.66339
Appendix 6 Page 2(6)
Tests of Significance for SCREEN WASH FLUID using UNIQUE sums of squares
Source of Variation SS
WITHIN+RESIDUAL 3399.
REGION GOTLAND MAINLAND 207.
DISTANCE DRIVEN 457. YEAR OF CAR 14 SEX 4. (Model) 768. (Total) 4168 R Squared = 184 Adjusted R Squared = 142 38 39 22 .27 82 96 .34 DF 133 H * D J ( D e4 140 MS 25. 207. 152. .13 .82 109. 29. 56 39 41 85 77 F .11 .96 .28 .19 .30 Sig of F .005 .001 .757 .665 .000
Combined Adjusted Means for REGION
Variable SCREEN WASH FLUID
REGION GOTLAND-MAINLAND
UNSALT UNWGT.
SALT U NWGT.
3.51677 5.57188
Combined Adjusted Means for DISTANCE DRIVEN
Variable SCREEN WASH FLUID
DISTANCE DRIVEN
l UNWGT. 2.47398
2 UNWGT. 3.50072
3 UNWGT. 7.96047
4 UNWGT. 4.97148
Combined Adjusted Means for YEAR OF
Variable SCREEN WASH FLUID
YEAR OF CAR
1 UNWGT. .
2 UNWGT. 4.32628
3 UNWGT. 4.89690
4 UNWGT. 4.55886
Combined Adjusted Means for SEX
Variable SCREEN WASH FLUID
SEX
Male UNWGT. 5.60482
Female UNWGT. 4.28711