VTI PM 2018-12-07 Diarienummer: 2017/0508-8.3
New Ways of Collecting Individual Travel
Information
Evaluation of data collection and recruitment
methods
Jenny Eriksson
Eva Lindborg
Emeli Adell
Andreas Holmström
Ary P. Silvano
Annika Nilsson
Per Henriksson
Mats Wiklund
Lina Dahlberg
VTI PM
Foreword
A need to find and develop new solutions for travel surveys (TSs) has been identified within the Nästa
generations resor och transporter (Next Generation Travel and Transport) cooperative programme. In
January 2017, a project plan for the New Solutions for the Future Travel Survey project was submitted to the Swedish Ministry of Enterprise and Innovation, with Transport Analysis being the coordinating body. The project plan was divided into five work packages: (1) coordination, (2) stakeholder and needs analysis, (3) detailed mapping of tools and applications, (4) testing and analysis of tools and applications, and (5) development potential and recommendations. This report pertains to a portion of work package 4 and is funded by 50% in part by the Swedish Transport Administration’s Research and Innovation Work portfolio. Transport Analysis is bearing own personal cost and parts of the data collecting. Transport Analysis has also got financial support by Eurostat. Trivector is bearing the cost of the development work for the mobile app. The project has been carried out by the Swedish Road and Transport Research Institute (VTI), Transport Analysis, and Trivector.
Jenny Eriksson has been the project manager at VTI, while Per Henriksson and Ary P. Silvano have participated as project members. Eva Lindborg, Andreas Holmström, and Mats Wiklund from Transport Analysis also took part as project members and were the supervising coordinators for the online questionnaire analyses. Emeli Adell, Annika Nilsson and Lina Dahlberg from Trivector participated as project members and were the supervising coordinators for the mobile app analyses. Everyone helped in various ways with the preparation, execution, analysis, and in authoring the report. We would especially like to thank the City of Gothenburg, Maria Eriksson, and Jenny Larsson for access to an ongoing travel survey during the same period. We are also very grateful to Enkätfabriken, which collected travel data via the online questionnaire and handled the e-mailing to the web panel for both the mobile app and the online survey. We also wish to thank Annika Johansson of VTI for designing the websites
To ensure the quality and practical applicability of the project, this study has been presented to and feedback obtained from the reference group affiliated with the New Solutions for the Future travel survey project. A hearty thanks to all of you.
Linköping, May 2018
Jenny Eriksson Project manager
VTI PM
Table of Contents
Summary ...7 1. Introduction ...9 1.1 Background ...9 1.1.1 Eurostat ...9 1.2 Purpose ...9 1.3 Terms ...10 1.4 Delimitation ...102 Method, materials, and execution ...11
2.1 Summarised study set-up ...11
2.2 Set-up of traditional travel surveys ...11
2.2.1 Set-up of the national travel survey ...11
2.2.2 Gothenburg Region Travel Survey 2017 ...12
2.3 Data collection methods ...13
2.3.1 Online questionnaire ...13
2.3.2 Travel data apps ...14
2.4 Recruitment methods ...16
2.4.1 Random sample ...16
2.4.2 Web panel ...17
2.4.3 Crowdsourcing ...17
2.5 Summary of data collection and nonresponse ...20
2.5.1 Collection period, number of mailings, and respondents ...20
2.5.2 Item nonresponse ...22
2.5.3 Nonresponse analysis of the random sample ...23
2.6 Data processing ...24
2.6.1 Data cleaning and aggregation ...24
2.6.2 Management of multiple trip days from the mobile app ...25
2.6.3 Weighting process ...26
2.6.4 Method for estimation of sampling errors ...29
3 Results and analysis ...30
3.1 Respondent profiles ...30
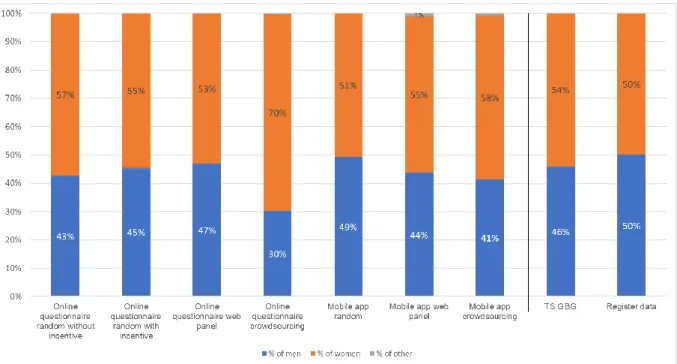
3.1.1 Gender ...30
3.1.2 Age ...31
3.1.3 Occupation ...32
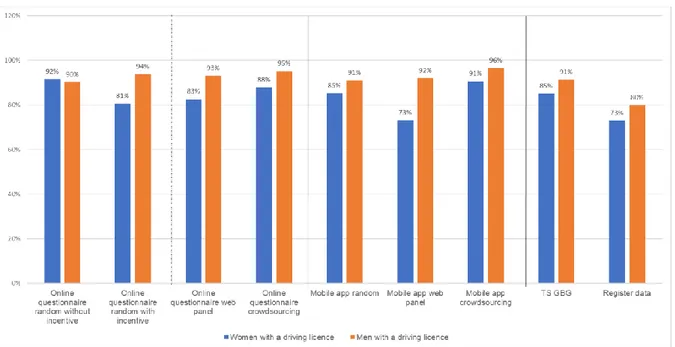
3.1.4 Driving licence and car access ...34
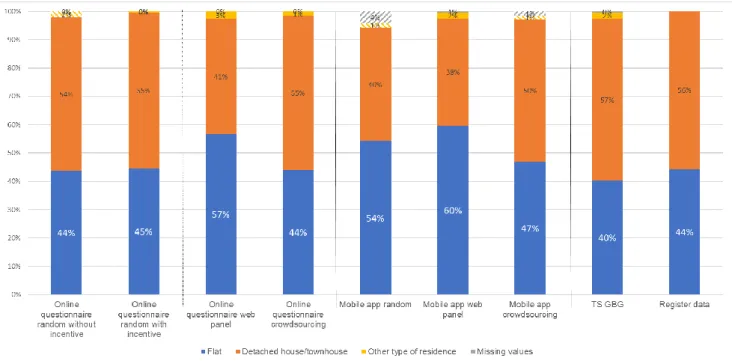
3.1.5 Type of residence ...34
3.1.6 Household size and type ...35
3.1.7 Municipality of residence ...37
3.1.8 Summary of respondent profiles ...37
3.2 Share that did not travel, and reasons why ...39
3.3 Average number of trips per day ...40
3.4 Average distance travelled per day ...50
3.5 Distance travelled per trip ...60
3.6 Uncertainty estimates ...61
3.7 Estimated collection costs ...62
VTI PM
4.1 Data collection methods ...64
4.1.1 Online questionnaire ...64
4.1.2 Mobile app ...64
4.1.3 Differences in collection methods’ response rate and item nonresponses ...65
4.1.4 Differences in the data collection methods’ respondent profiles ...66
4.1.5 Differences in collection methods’ trips and trip lengths ...67
4.1.6 Comparison with the SPOT project ...68
4.1.7 Differences in mode of travel and purpose ...68
4.2 Recruitment method ...69
4.2.1 Random sample ...69
4.2.2 Web panel ...69
4.2.3 Crowdsourcing ...70
4.2.4 Differences in recruitment methods’ respondent profiles ...70
4.2.5 Differences in recruitment methods’ trips and trip lengths ...71
4.3 Cost effectiveness ...71 4.3.1 Collection method ...71 4.3.2 Recruitment method ...72 4.3.3 Comparison ...72 4.4 Concluding discussion ...72 5 Conclusions ...75
5.1 Conclusions – data collection...75
5.2 Conclusions – recruitment...75
5.3 Conclusions – respondent profiles ...75
5.4 Conclusions – travel habits ...76
6 Summary and recommendations ...77
6.1 Important issues for travel surveys ...77
6.2 New methods’ potential to overcome current deficiencies ...77
6.2.1 Collection method ...77
6.2.2 Recruitment method ...79
6.3 Quality aspects ...81
6.3.1 Relevance ...81
6.3.2 Reliability ...81
6.3.3 Timeliness and punctuality ...82
6.3.4 Accessibility and clarity ...82
6.3.5 Comparability and co-usability ...82
6.4 Recommendations ...83
6.5 Continued research and development ...84
References ...85
Appendix 1 – Online questionnaire...86
Appendix 2 – Background Questionnaire for TRavelVU ...93
Appendix 3 – Institutions, etc., contacted for crowdsourcing advertisement ...95
Appendix 4 – Media impact, etc ...96
Appendix 5 – Information and expression of interest page posted on www.vti.se/resa in phase one ...97
Appendix 6 – Information page and link to the online questionnaire posted on www.vti.se/resaenkat ...99
VTI PM
Appendix 7 – Information page and link to download page for the mobile app posted on
www.vti.se/resaapp ...100 Appendix 8 – Respondent profiles, additional figures, and tables ...101 Appendix 9 – Estimated costs of data collection, calculations ...105
VTI PM 7
Summary
New Ways of Collecting Individual Travel Information – Evaluation of Collection and Recruitment methods
by Jenny Eriksson (VTI), Eva Lindborg (Transport Analysis), Emeli Adell (Trivector), Andreas Holmström (Transport Analysis), Ary P. Silvano (VTI), Annika Nilsson (Trivector), Per Henriksson (VTI), Mats Wiklund (Transport Analysis), and Lina Dahlberg (Trivector)
A need to find and develop new solutions for travel surveys (TSs) has been identified within the Next Generation Travel and Transport cooperative programme, for which Transport Analysis is the coordinating body. The background for this consists in part of declining response rates using current methods, which could lead to problems in terms of representativity. The development of new data collection methods for future TSs is viewed as matter of great urgency in both the short and long terms.
The overall purpose of the project is to conduct a demonstration study that shows how two data collection methods that have been developed to collect travel survey data perform in the field, and how they perform compared with traditional TSs (i.e., postal questionnaires and/or telephone interviews). The project is also intended to provide a better understanding of the ways in which different recruitment methods of respondents can be used so that future TSs can be more cost effective.
The two collection methods tested consist of a mobile app and an online questionnaire with a map to assist the respondents to identify travel destinations. Three recruitment methods were used, i.e., recruitment via random sampling, a web panel, and crowdsourcing. The portion of the random sample that received an online questionnaire was divided into two groups. Half the group was given no incentive, while the other half received a gift card worth SEK 100 after answering the questioner. Those who were recruited via a web panel and were to use the mobile app were rewarded in the form of a gift card worth SEK 100 if, at minimum, they made corrections to trips made on one day
registered in the mobile app. A nonresponse analysis was performed of the random sample for both the online questionnaire and the mobile app. Cost estimates for each collection method and recruitment method were also performed, as were uncertainty estimates.
The respondents were localised to the Gothenburg region, as a traditional travel survey was being conducted in that region during the same period. The purpose of choosing the same region and time period was to enable comparison of the results of our pilot surveys with those of a larger traditional survey. The target population comprised inhabitants between the ages of 16 and 84 years in
municipalities in the Gothenburg region.
Overall, the study shows that the mobile app registered significantly more trips per respondent than did the online questionnaire, while the distances travelled were comparable. There are several possible interpretations of this. One is that people who responded to the online questionnaire either forget about and/or combined short trips (particularly trips made for the purposes of leisure or shopping, and using the travel modes walking and car). One presumable explanation for this is that it is easier to
confirm/correct the trips that the mobile app suggests than it is to recall and enter all trips in an online questionnaire. Another possible interpretation is that people responding to different data collection methods have different travel patterns. Yet another explanation is connected to technique issues regarding the different data collection methods.
With regard to the recruitment methods, crowdsourcing netted the highest number of responses compared with both random sampling and a web panel. It was also the least expensive to perform. It
VTI PM 8 is, however, a problematic method to use if there is a desire to apply statistical theory, as the target population is unknown.
With regard to the response rates, the new collection methods (i.e., online questionnaire and mobile app) perform less well than do the traditional methods (i.e., telephone interviews and paper
questionnaires). Incentives are considered to have only a marginally positive effect on the response rate. The basic problem with low response rates is that they increase the risk that the responses will not be representative of the target population.
Compared with the target population, people who have a driving license or are cohabitants without children were over-represented in all the collection and recruitment methods among those who responded to the survey. The group that responded to the online questionnaire after having been recruited via crowdsourcing deviated greatly from the other groups in most of cases. This group contained a higher proportion of women, people of working age, and gainfully employed than did the other groups. On the other hand, this group did exhibit, together with the randomly selected
respondents who responded to the online questionnaire, very high correspondence with the breakdown in terms of type of residence according to the register data (i.e., flat versus detached
house/townhouse).
One way of dealing with the fact that the respondents do not correspond to the target population is to weight the responses so that those from groups that are over-represented are given lower weights, while the responses from the underrepresented groups are given higher weights. Our work with such weighting shows that the differences between the data collection methods in terms of numbers of trips per person and day become smaller when we weight the results so that they correspond to the target population to a greater extent. However, we can only weight those variables about which we have knowledge in the context of both the target population and the respondents. If our respondents deviate from the target population in some way that we cannot measure, for example, by having other values that in turn affect their travel behaviour, then we cannot address this through weighting, and risk obtaining less valid results.
Deficient representativity has been suspected in connection with traditional travel surveys. In our study, the levels of representativity for the online questionnaire and mobile app were roughly the same as for the traditional survey. It is primarily the mobile app that is considered to deliver higher data quality in terms of travel times and trip lengths, and it can also address the issue of route choice, which traditional methods cannot. The response rate for random sampling was lower for the online
questionnaire and mobile app than for traditional methods. Crowdsourcing and web panels do not yield response rates on a par with those of random sampling. Nor are there any proven methods for describing the statistical uncertainties in the results obtained from crowdsourcing or web panels. The proven collection methods have been evaluated in terms of four statistical quality criteria: relevance, reliability, timeliness and punctuality, and accessibility and comparability. When selecting a method for collecting travel survey data, the purpose of the survey needs to be clear. Depending on the purpose of the survey, the collection and recruitment methods can be chosen based on their various strengths and weaknesses. Nor is there any easy answer when it comes to recruitment methods. In our study, the random sampling method that has so far been completely dominant was no better at
representing the target population than was the web panel or data collection via crowdsourcing. Given the low response rates associated with random samples, our recommendation regarding recruitment is to continue studying alternatives to random sampling and to work more on the weighting of received responses. The latter should be done regardless of whether or not random sampling is used.
VTI PM 9
1. Introduction
1.1 Background
A need to find and develop new solutions for travel surveys (TSs) has been identified within the Next Generation Travel and Transport cooperative programme. The background for this consists in part of declining response rates obtained using current methods, which could lead to problems in terms of representativity. This problem has led, for instance, to the Swedish Transport Administration not having used the latest national travel survey, TS Sweden 2011–2014, in its socioeconomic models, falling back instead on data from 2005–2006. Transport Analysis has consequently chosen to take a hiatus in collecting data for the national travel survey. The agency will instead put more emphasis on developing new methods that can better address the representativity issue. The development of new data collection methods for future TSs is consequently deemed to be a matter of great urgency, both in the short term, so that data collection can resume, and in the longer term, when techniques that are not yet mature can be utilised.
As a result, Transport Analysis has launched a project with a view to studying and testing new technical solutions for collecting travel data and how various collection methods could be used (alone or in combination) in conducting future travel surveys. The project consists of a number of subprojects (work packages). A stakeholder and needs analysis was initially conducted in parallel with the
mapping of tools and applications within this field. The previous subproject (see Eriksson et al., 2017) studied the needs and new users of TSs, and the questions that future TSs should be able to answer. The next subproject (see Clark et al., 2017) performed a broad mapping of various types of traffic and travel metrics and a categorisation of tools and applications for collecting travel data.
In the present substudy, a pilot study has been conducted in which different methods for collecting travel data (i.e., online questionnaire and mobile app) and different methods for recruiting participants (i.e., random sampling, web panel, and crowdsourcing) were tested. The choice was made to site the pilot study in the Gothenburg region, which enabled comparisons of the pilot study results with those of a conventional TS (i.e., paper questionnaire with the option of responding online) that the City of Gothenburg Traffic Administration Office conducted concurrently in the fall of 2017.
The set-up of the national TS is described briefly in the following chapter, which also addresses the harmonisation of these types of surveys within the EU.
1.1.1 Eurostat
National travel surveys are conducted in numerous countries in Europe. In some countries such surveys have a long history, having been conducted since the 1960s, while no data are collected at all in other countries. Eurostat (2016) has set forth guidelines for travel surveys. The guidelines were based on an attempt to harmonise the travel surveys in Europe, and they contain information about desired variables concerning individuals, such as gender and age, and about their modes of travel and the purposes of their trips. The guidelines also document gathered experience and discuss the
advantages and disadvantages of various data collection methods (Eurostat, 2016).
Eurostat also provides support for the development of travel surveys. Transport Analysis has received support from Eurostat in advancing its work with travel surveys.
1.2 Purpose
The overarching purpose of the project is to conduct a demonstration study that shows how two data collection methods developed to collect travel survey data (i.e., an online questionnaire with a map, and a mobile app) perform in the field, and how they perform versus “traditional” TSs (i.e., postal questionnaire and/or telephone interview). The project is also intended to provide a better
VTI PM 10 understanding of how different recruitment methods (i.e., random sampling, web panel, and
crowdsourcing) can be used so that future TSs can be more cost effective.
1.3 Terms
Three terms are used in travel surveys to describe the various levels of travel, i.e., journey, trip, and stage. A journey begins and ends at a defined point. For example, in TS Sweden these journey points were the respondent’s permanent residence, workplace, school and temporary overnight site. Each journey consists of one or more trips. A trip starts and ends at a point where a purpose is fulfilled. A trip consists in turn of one or more stages. If only the mode of travel changes and no purpose is fulfilled, a trip is divided into multiple stages.
In this pilot study, the term “trip” serves as the basis for describing respondent trips.
The purposes that are fulfilled can be grouped into several main categories, for example, work,
business, and school trips, service-related and shopping trips, and leisure and other trips. In connection with travel survey applications developed for smart phones, these can be referred to as activities, which can also include waiting times/transfers and parking a vehicle.
In this pilot study, we have used three different recruitment methods, i.e., ways of reaching people in our target group. They comprise random sampling from a population register, the use of existing web panels, and announcements/advertisements placed online, in newsletters, in free publications, etc., and collectively referred to here as crowdsourcing. The people who were contacted and were willing to take part in the study were asked to describe/register their trips using one of the two collection
methods that were tested, i.e., responding to an online questionnaire or downloading a travel survey
app to a smart phone.
1.4 Delimitation
We will not discuss policies or legalisation regarding data collection or management because the new General Data Protection Regulation (GDPR) has only recently gone into effect in all the EU member states, as of 25 May 2018. This regulation entails sweeping changes for those who manage personal data, and strengthens the rights of the individual in terms of personal privacy. Overall, we can state that any required changes will presumably not entail any major differences from previous regulations. However, consent will be required in a clearer manner, and data security and documentation will be subject to more stringent requirements. More information about this is available on the Swedish Data Protection Authority website.
VTI PM 11
2 Method, materials, and execution
In this study we have tested and evaluated various methods for recruiting participants and collecting data for travel surveys. The study up is summarised in Section 2.1. Section 2.2 describes the set-ups of the traditional surveys that we chose. The two data collection methods tested consisted of an online questionnaire with a map, and a mobile app, and they are described in Section 2.3. Three recruitment methods were used, i.e., recruitment via random sampling, a web panel, or crowdsourcing. These three methods are described in detail in Section 2.4. In Section 2.5 we review the
post-processing of the collected datasets. We conclude with a comparison of the study set-ups (see Section 2.5).
2.1 Summarised study set-up
The evaluation also included a traditional travel survey (TS) set-up (see Table 1). The table shows that six different set-ups will be compared in our study, and that we will also make comparisons with a traditional TS.
Table 1. Summarised study set-ups for the various data collection and recruitment methods to be evaluated and compared.
The sample population and the traditional TS comprised people between the ages of 16 and 84 years. The same survey area was also chosen in the studies, i.e., the following 21 municipalities with their environs in the Gothenburg region were included in the surveys: Ale, Alingsås, Bollebygd, Borås, Gothenburg, Härryda, Kungsbacka, Kungälv, Lerum, Lilla Edet, Mark, Mölndal, Orust, Partille, Stenungsund, Tjörn, Trollhättan, Uddevalla, Varberg, Vänersborg, and Öckerö.
2.2 Set-up of traditional travel surveys
2.2.1 Set-up of the national travel survey
The national travel surveys have been conducted by means of computer-aided telephone interviews since the mid 1990s. The samples of respondents were obtained from the Total Population Register (TPR). Telephone numbers for the sample were then obtained, and several days before the first measurement day, the prospective respondents received, by post, a cover letter along with a travel diary. The respondents were then telephoned the day after the first measurement day for an interview. If a respondent failed to respond to this attempt at contact, new attempts were made for up to six additional days. To a large extent, roughly the same questions were asked regarding trips. One major change occurred from 1998 to 1999, i.e., a transition from a journey-based approach to collecting data to a trip-based approach. Several trip purposes were also added, and the number of modes of travel was increased. Trip data from TS Sweden were compared in some cases with the pilot study and TS Gothenburg results (see following chapters). A sample was drawn from TS Sweden that was limited to
Data collection method Recruitment method Random
sampling Web panel Crowdsourcing Traditional TS
Postal/online questionnaire ✓ - -
Our study
Online questionnaire without incentive
✓ ✓ ✓
Online questionnaire with incentive
✓ - -
VTI PM 12 the pilot study survey area and the 2013–2016 period in view of the introduction of the congestion tax in Gothenburg on 1 January 2013.
2.2.2 Gothenburg Region Travel Survey 2017
The City of Gothenburg conducted a travel survey in the fall of 2017 at the request of the West Swedish Agreement 1 (hereinafter, “TS GBG”). The 2017 data collection process involved postal
questionnaires and a means of answering questions online. The questionnaire consisted in part of a background section containing questions about the respondents and their households, as well as a travel diary containing questions about all the trips made on a particular measurement day. It was possible to fill out the online questionnaire in more languages that just Swedish, i.e., English, Finnish, Arabic, Persian, and Somali.
The sample was drawn from the State Personal Address Register (SPAR). The sample size was 46,620 people. No stratification was performed with respect to age or gender, but rather only geographically, which means that a random sample was obtained within each respective sample area. Gothenburg was divided into 21 sample areas (strata), while the other 20 municipalities each constituted one sample area (stratum). The sample sizes for the various 41 sample areas ranged from 550 to 8,400 people. It was possible for municipalities to order additional samples, as Kungsbacka and Mölndal did. The measurement period lasted three months. The regular measurement days consisted of the
Wednesdays from Wednesday 14 August to Wednesday 15 November. Each person in the sample was contacted via up to three postal mailings (all contact attempts entailed new measurement days):
• The first mailing was a postal invitation, in the form of a postcard, to fill out a questionnaire online.
• The second mailing was a postal questionnaire, but it was still possible to fill out the questioner online.
• The third mailing was a new postal questionnaire. It was also possible to fill it out online. • The fourth contact attempt was a telephone reminder.
Obviously erroneous information in the response data was corrected, such as implausible time or distance information. New variables for the primary mode of travel were generated based on the mode of travel given for each stage. In those cases in which multiple modes of travel were reported for a trip, the following hierarchy was applied to determine the primary mode of travel:
1. boat 2. aircraft 3. other 4. mobility service 5. train/tram 6. bus
7. taxi (non-mobility service) 8. car as driver/car as passenger 9. moped/motorcycle
10. bicycle/electric bicycle 11. walking
VTI PM 13 For example, if the respondent walked to the bus, took the bus, and then walked from the bus to his/her destination, the bus would be the primary mode of travel, as it ranks higher in the hierarchy than walking. The modes of travel were then grouped as car (8), public transport (1, 5, 6), walking (11), and other (2, 3, 4, 7, 9).
The individuals were weighted based on gender, age, and geographic area. The trips were weighted on a seasonal basis for all modes of travel except walking, with “bicycle” being corrected with a
weighting of 0.8, “public transport” with a weighting of 0.9615, and “car” with a weighting of 0.9756.
2.3 Data collection methods
There are data collection methods other than those tested in this study, such as telephone interviews (as in TS Sweden) and paper questionnaires (as in TS GBG). We have used an online questionnaire and a mobile app. The online questionnaire mainly resembles the set-up of a paper questionnaire, but with the difference that the respondent can use an interactive map. However, a feature common to both methods is that they collect data for a trip day. Here the mobile app differs from the other data
collection methods, as it is able to collect multiple trip days per individual.
2.3.1 Online questionnaire
An online questionnaire is a questionnaire that is posted on a website. It offers numerous advantages over a paper questionnaire, for example, the responses are registered as soon as the questionnaire is submitted. With respect to the collection of addresses, it is possible to link to a map tool in which the respondents can mark their location directly on a map. Checking to prevent implausible responses can occur directly during the process, and the respondents need not be shown questions that are irrelevant, based on how they answered earlier questions.
In the pilot study, the design of the online questionnaire and its data collection process were the objects of a procurement process carried out by Transport Analysis. Data collection occurred via an online form tool provided by Enkätfabriken AB which had won the procurement process. The tool contains inbuilt support for the collection of origins and destinations for the trips via a map function linked to an address register containing geocoded addresses. One of the requirements in the
procurement process was that the web form tool would be designed in such a way that the respondents could provide their answers using the most common web browsers and using smart phones or tablets based on the Android or iOS operating systems.
A web form was used in the pilot study (see Appendix 1) containing 13 background questions concerning gender, age, home address, driving licence possession, etc., plus some 30 questions about the trips made by the respondent. The scope of the form was based largely on the Eurostat travel survey guidelines. In the questionnaire, the respondents first had to answer the background questions regarding themselves and their households. The travel data were collected for a given measurement day, trip by trip. The respondents were to specify the mode of travel used in each trip. However, information as to the order in which these modes were used was not collected, with the result that we obtained no information about the order or number of stages, as it is possible for one mode of travel to be used in multiple stages, for instance, if the respondent walks at both the beginning and end of a trip. One simplification in the online questionnaire compared with TS Sweden is that no question was asked concerning the purpose of the journey in connection with trips that ended at home or another overnight site. An analysis of TS Sweden response data has identified deficiencies in the responses to the question concerning the purpose of the journey. Many respondents failed to understand the question and indicated “trip home” rather than the primary purpose of the trip. In the online questionnaire, the purpose of the journey was instead estimated based on previously stated trip purposes. It was generally assumed that the purpose fulfilled over the longest period of time was the primary one, unless the trip started at a workplace or school, in which case the purpose of the journey
VTI PM 14 was to attend work or school. If the journey had no purpose while in process, it was assumed to be a journey made for exercise. This can result in certain differences compared with how such journeys are categorised in TS Sweden.
The people recruited via random sampling had individual logins. The respondents could choose to follow a QR code on their cover letter or enter a web address, user ID, and password. The purpose of the individual logins was to ensure that the respondents would not have to enter information that was already known from the sampling process, such as their age and gender. Two portals to the form were created for those people who had been recruited via a web panel or crowdsourcing, one for each recruitment method. The portal to the form was the same for all respondents recruited using the same recruitment method. After the data collection process was concluded, databases containing the results and an implementation report were submitted to Transport Analysis.
2.3.2 Travel data apps
A number of different mobile phone apps are available to collect travel data for travel surveys. Apps use various sensors in the mobile phone to capture how the phone is being moved, which is interpreted as the individual’s movement pattern. The tools provide information about trips and their purposes, and often information about the individual who has the phone as well. Different apps require different levels of user involvement. There are apps that automatically attempt to detect information about both travel made and their purposes, as well as apps that attempt to detect only travel automatically. There are also apps that want the user to turn a logging function on and off so that trip data will be collected (albeit mostly in the research world). Most of these apps have been designed so that the user checks (and optionally corrects) the data. Data correction can occur either in the app or via an online interface. Information about the user is usually collected via a questionnaire in the app or online interface. A complete account of the various types of apps used to collect trip data is given by Clark et al. (2017).
In this study, we have opted for a trip data app that automatically detects trips (the user need not turn the logging on/off). The user reviews the app’s analysis and makes changes as needed, and this review process occurs within the app. The chosen app is called TRavelVU (hereinafter, “the mobile app”) and was developed by Trivector. This mobile app collects travel data at the stage level, along with
information about the start and end times, mode of travel, speed, distance, and route of each stage. Information about the start and stop times and geographic location is available for each activity. The users of the mobile app in our study were asked to register their trips/activities for at least one week. In its current version the mobile app identifies seven different modes of travel automatically, and efforts are underway to enable the automatic identification of three additional modes (see Table 2). In addition to these ten, the user can choose among seven additional modes of travel when
checking/correcting his/her trips (see Table 2 below). The mobile app also has an algorithm for learning the user’s travel pattern, which means that it takes into account what the user has previously marked as the correct mode of travel. The user has 17 activities from which to choose. The mobile app does not suggest which activity the user has done at various stops, but rather it is up to the user to enter that. On the other hand, the mobile app does remember what the user has previously entered at a given location and will suggest the same activity the next time the user stops at that location. All activities during the day need to be entered for it to be possible to mark a day as “correct” (i.e., to demonstrate that any errors have been checked and corrected). The activities that can be chosen are: waiting time/transfer, parking, home, temporary residence, work, school/training, business trip, picking up/dropping off someone, shopping, healthcare, other service-related trip, health of friends and relatives, exercise and outdoor activities, restaurants and cafés, hobby activity, entertainment and culture, and other activity. If the user does not wish to specify any activity, it is possible to choose the “Will not specify” option.
VTI PM 15
Table 2. The mobile app’s selectable modes of travel, the modes currently identified automatically, and the modes under development (lower accuracy at present).
Selectable mode of travel Currently identified Under development
Walking Yes
Exercise and hiking Yes
Bicycle Yes Electric bicycle No Bus Yes Train Yes Car Yes Car passenger No Tram Yes Underground No X Moped No Motorcycle No Ferry/boat No X Aircraft No X Mobility service No Taxi No Other No
Data are collected via the mobile phone and sent to a server for analysis. The analysis results are then sent back to the mobile phone, at which point the user has the opportunity to correct his/her
movements. For the data to be included in the dataset, the user must mark to indicate that the
description of the trips and activities for the relevant day is correct. If there are days that have not been corrected, the user will be reminded to make corrections when going into the mobile app. The
reminder will recur until the day has been corrected or the respondent indicates no wish to correct it. GPS data are “cleaned” in three steps. The first step involves removing duplications and implausible responses. For example, the GPS could wander off course without the phone having moved, and sometimes unreasonably high speeds are registered if the GPS point pops up somewhere it should not be. This is performed partly based on earlier work in the field (e.g., Schüessler & Axhausen, 2008), but to optimise this particular mobile app, certain parameters are adjusted, and the data cleaning is also supplemented with other elements. In the second step, the GPS data are smoothed to create a less “choppy” GPS trace. Without this smoothing process, which may be likened to calculating a rolling mean, data may, for instance, show that one has repeatedly moved from the left side to the right side of a street, which can have a major impact on the distance travelled. The disadvantage of this approach is that if one passes a street corner, the GPS track may cut across the corner. The last step in the cleaning process involves determining GPS coordinates for various activities. During an activity, GPS traces are created around the activity site, and these are grouped together so that the activity occurs in one place and does not yield a movement.
At present the algorithms in the mobile app are rule-based, which means that the rules are set in advance and are not altered depending upon various types of input data. The GPS collection process begins when the phone is in motion, and it is the app that launches the GPS collection process. To save the battery, GPS points are not collected while the phone is stationary. Because all trips begin, in principle, with walking and end with walking, for example, from the residence to a bicycle rack, from a train to a bicycle rack, walking trips are identified in order to determine the starts and stops of stages. The mode of travel for the stage is then determined based on an array of different parameters, i.e., different speed and acceleration measurements along the travelled stretch, proximity to public
VTI PM 16 transport stops, how previous trips were made along the same stretch (when a trip has been corrected), etc. The probabilities of various modes of travel are determined using fuzzy logic,2 i.e., the mode of
travel that is calculated as having the highest probability of being valid is selected and displayed to the user by the mobile app. Previously corrected days and trips of roughly the same length, distance, and with the same start and end points affect the choice of mode of travel.
Appendix 2 contains the background questionnaire used in the mobile app for this study.
2.4 Recruitment methods
The traditional way of recruiting people for a survey is via random sampling. We used this as the basis of our study. In addition to this, we tried recruiting people via a web panel and crowdsourcing. The target for the study was to recruit at least 200 people per recruitment and data collection method. Two hundred people per group were considered enough respondents to enable analyses of differences between the groups while keeping within the project budget.
2.4.1 Random sample
In a random sample from, for example, a population register, each individual has a known probability of being included in the sample, and that probability must be greater than 0. Given these assumptions, it is possible to determine the sample error, i.e., the deviation between the value of a parameter to be estimated using the sample and the value that would have been obtained if a total survey had been conducted.
The random samples for the mobile app and the online questionnaire were drawn in the same sampling process using SPAR and distributed to the various platforms by Transport Analysis. In total, the sample comprised 5,600 people, 2,800 of whom were selected to respond via the mobile app, 1,400 via the online questionnaire with no incentive, and 1,400 via the online questionnaire with an
incentive. The number of people in the sample for the online questionnaire was calculated based on an anticipated response rate of roughly 15%, which would yield roughly 200 interviewees for the online questionnaire with an incentive and 200 for the online questionnaire without an incentive. We knew less about what the anticipated response rate would be for the mobile app.
To enable comparison with the results of the Gothenburg survey, we used the same target population as in the Gothenburg TS. The sample was stratified into four age groups (i.e., 16–25, 26–44, 45–64, and 65–84 years) and by gender, yielding a total of eight strata. There were 700 people in each stratum, so the sample was not selected proportional to the population. Unfortunately, it was not possible to exclude people who were included in the sample used in the Gothenburg TS. There is thus a risk of double selection, which could reduce the inclination of those people to respond.
In the random sample for the online questionnaire, the respondents were assigned measurement days so that they were uniformly distributed over the two weeks during which the survey was ongoing, in order that each day would have an equal number of respondents. People who failed to complete the questionnaire within a few days of their measurement day were sent a reminder about the survey. The measurement day was moved forward one week in the reminder. There were no specific measurement days for the app, and the thinking was that the respondents would instead start as soon as possible and then use the app for at least one week.
2 A mathematical approach for calculating the probability that something is true, in this case, that the mode of
VTI PM 17 Nonresponse analysis
Enkätfabriken performed a nonresponse analysis of those in the random sample who failed to respond. Four hundred telephone interviews were conducted, i.e., 200 interviews among those selected to respond using the mobile app, 100 among those who failed to respond and had been selected to respond via the online questionnaire without an incentive, and 100 among those who failed to respond and had been selected to respond via the online questionnaire with an incentive. The nonresponse analysis is summarised in Section 2.5.2.
2.4.2 Web panel
A web panel is a database containing individual information about people who have expressed willingness to cooperate as respondents in future online surveys in the event that they are selected (Surveyföreningen, 2014). Web panel members can be recruited in two different ways, i.e., as random (i.e., probability-based) or self-recruited (i.e., non-probability-based) panel members (Stern et al., 2014). A third group consists of a mix of randomly recruited and self-recruited members, which is known as a mixed panel.
VTI used a procurement process to gain access to a web panel. The web panel was the object of a direct procurement process involving known web panel companies, with VTI sending out invitations to four different companies along with a description of the job. All the invited companies except one tendered a written proposal. Enkätfabriken submitted the best proposal and was awarded the job. Enkätfabriken conducted the survey using a mixed web panel that was provided by the company CINT, with panel members comprising roughly 200,000 people from throughout Sweden. The web panel members who responded to our survey received compensation of roughly SEK 7 (typical compensation for panel members participating in a survey of this scope).
The aim was to collect responses from 200 web panel participants in the online questionnaire survey and 200 in the mobile app survey. Enkätfabriken sent out an e-mail to all the selected panellists. In the case of the online questionnaire survey, the e-mails were distributed evenly over the days during the measurement period (both weekdays and weekends). A reminder was sent out seven days later if the panellist had not responded to the survey.
Recruitment occurred via an online form in the case of the mobile app survey. If the respondents lived in the study area, they received an invitation to participate in the survey. Those who responded in the affirmative had to enter their e-mail address and mobile number. An SMS was sent out containing a direct link to the mobile app, along with an e-mail containing information about the survey and instructions for downloading and using the mobile app. As an additional incentive, the participants were offered a gift card worth SEK 100. This was issued to participants who corrected at least one day in the mobile app.
2.4.3 Crowdsourcing
Crowdsourcing is a relatively new mode of online participation. In brief, it is based on an organisation asking a group of people to voluntarily achieve a goal or perform a given activity, with both parties viewing the process as mutually beneficial (Estelles-Arolas & Gonzalez-Ladron-de-Guevara, 2012). Generally, recruitment occurs and announcements/advertisements are published via social media (e.g., Facebook and Twitter) and periodicals (e.g., free newspapers and classified ad newspapers).
A message and a channel strategy were created to inform people of the study. The message was intended to pique the target group’s interest and induce its members to answer the online questionnaire or use the mobile app. The channel strategy was employed to disseminate the editorial material, which was both published via periodicals and linked to in social media that reached the target group.
VTI PM 18 Contacts and channels were obtained partly via the City of Gothenburg Traffic Administration Office and partly via a web search of existing periodicals available in the relevant region. Because a large share of the target population lives in Gothenburg, it was considered reasonable to disseminate a relatively large amount of information there. The Gothenburg Region Local Federation (GR) was also viewed as an important channel, as it comprises 13 municipalities, two of which, i.e., Kungsbacka and Mölndal, have large populations. Channels to municipalities with relatively high numbers of
inhabitants, i.e., Borås, Kungsbacka, Mölndal, Varberg, Trollhättan, and Uddevalla, were prioritised as well. It was considered that covering all the municipalities would not be particularly efficient. The entities contacted to disseminate our information are listed in Appendix 3. The listed municipalities and media companies were contacted by e-mail roughly three weeks before the start of the collection period. They were asked to disseminate information about the project; this e-mail was followed up with telephone calls. The periodicals viewed this mainly as an advertisement for which they sought payment, while channels with more public orientations chose to disseminate the information free of charge. GR did not disseminate information itself, but rather provided an address list containing some 60 representatives in their sustainable travel network. The list included officials from municipalities, the Swedish Transport Administration, the National Society for Road Safety (NTF), Region Halland, Framtiden Byggutveckling AB (residential development), and the Västra Götaland Region. These people received an e-mail roughly two weeks before the start of the data collection period, and the mailings were coordinated with the TS for the West Swedish Agreement.
VTI used its Facebook page to attract participants to the survey. An advertisement was created containing a brief description of the purpose of the project. The advertisement was linked to VTI’s crowdsourcing website (see Figure 1). VTI’s and Transport Analysis’s Twitter accounts were also used, although few people learned of the survey via that channel. In addition to these channels, people residing in the survey area who had previously expressed an interest in participating in VTI studies (e.g., simulator studies and group discussions) were also notified of the opportunity to take part in the pilot study.
The impact in the form of publications on municipality websites, newsletters, and periodicals may be viewed as good. To our knowledge, some 20 mentions (see Appendix 4). During the period from 9 to 30 October, VTI’s Facebook advertisement resulted in 2,953 people clicking on the
advertisement/post, 47 sharing it, 37 commenting on it, and 88 “liking” it. A total of 57,661 people were exposed3 to the post, 53,031 from the post. The advertisement was ultimately viewed4 89,730
times.
A strategy involving two different phases was employed in order to achieve a more even distribution of start days over the measurement period, particularly for the online questionnaire survey. Those interested could express their interest prior to the start of the measurement period and could begin collecting their data immediately during the measurement period. First, an expression of interest page (www.vti.se/resa, see Appendix 5 and the left-hand column in Figure 1) for the study was created, setting out the criteria that had to be met to participate and containing descriptions of the two methods for collecting trip data. Those interested could fill out a form and choose whether they wished to complete the online questionnaire, download the mobile app, or do either (i.e., no preference). All advertisements and promotional items referred to that page. The page had the following appearance from 25 September to 16 October 2017.
3 Exposure refers to how many times an advertisement has been displayed on a screen, which could be the same
screen multiple times.
VTI PM 19
Figure 1. Schematic of the portal to the study’s two data collection methods for those recruited via crowdsourcing: phase 1 – when the expression of interest was submitted (25 September to 16 October 2017, left); phase 2 – when those interested could choose one of the direct links to how they wanted to describe their trips (16 October to 16 November 2017, right).
The data from the expression of interest form were downloaded on the morning of 16 October 2017. The output data file contained 687 items. After the file was cleaned (13 people failed to provide an e-mail address and 23 duplications were removed), 651 people remained. The breakdown of their responses into the options in the expression of interest form is presented in Table 3.
VTI PM 20
Table 3. Data collection method that those interested indicated in the expression of interest form. Responses
(number)
Responses (%)
a) Answer an online questionnaire and describe my travels
during one day at the end of October 180 27.6 b) Download a mobile app and collect trip data over one
week at the end of October 193 29.6
Do either a) or b) (i.e., no preference) 278 42.7
Total 651 100.0
Interest was roughly equally strong in completing the online questionnaire and in using the mobile app. Those who indicated that they could provide trip data using either of the two collection methods (i.e., had no preference) were divided so that each municipality was uniformly split between the online questionnaire and the mobile app. The people were also distributed as uniformly as possible over the 14-day period. As a result, 326 people were asked to download the app and 325 were asked to complete the online questionnaire.
Half of all the expressions of interest up to 16 October came from people who reported that they resided in Gothenburg Municipality. Just over 30 expressions of interest were received from people residing in each of the following municipalities: Kungsbacka, Kungälv, Mölndal, and Stenungsund. In addition, all the municipalities in the Gothenburg Region and its environs that participated in the survey were represented by those who expressed interest. An e-mail was sent out between 16 and 29 October to those who had expressed interest in the study. Between 45 and 47 people received this e-mail each day. Five e-e-mail messages failed to reach their intended recipients. We learned that one person had chosen not to answer the online questionnaire after having been informed that there would be no compensation for participating, but it is unknown whether this attitude was present among more of those who had expressed interest.
A new version of the webpage was launched at the same time as the data from the expression of interest form were downloaded. The visitors who came to www.vti.se/resa from 16 October on were able to choose the method by which they wished to report the trip data. Clicking on any of the descriptions of the data collection methods linked them to either www.vti.se/resaenkat or
www.vti.se/resaapp (see Appendices 6 and 7, respectively, and the right-hand column in Figure 1); these pages were live until 16 November. After that date, visitors to www.vti.se/resa were informed that the data collection period had ended, and were thanked for their interest.
2.5 Summary of data collection and nonresponse
This section summarises the data collection process in its entirety, and the item nonresponse is examined here as well. The results of the nonresponse analysis are also presented here. The cost estimate for the data collection process is found in Section 3.7. Those responses that were implausible or could not be used in the analysis for some other reason were eliminated (see further in Section 2.6.1).
2.5.1 Collection period, number of mailings, and respondents
The portion of the random sample that received an online questionnaire was divided into two groups. Half of the group was offered no incentive, while the other half received a gift card worth SEK 100. Those who were recruited via a web panel and were to use the mobile app received compensation in the form of a gift card worth SEK 100 if they corrected at least one day’s trips in the mobile app. The starting date for the collection period was the same regardless of the data collection method, but the group that was to use the mobile app could start using it at any time throughout the collection period. One day’s trips were to be described by those who participated in the online questionnaire, while the members of the mobile app group were asked to register their trips over at least a week. The collection period for our study fell within the collection period for the TS conducted in the Gothenburg Region,
VTI PM 21 which was a goal. Table 4 shows when the data collection occurred, and when and how many
reminders were sent out. Table 5 shows the sample size and the numbers and proportions of
respondents. Appendix 8 provides a summary of when the responses were received (cumulative total).
Table 4. Collection period and reminder strategies for each data collection and recruitment method. Collection
method Recruitment method
Ordinary
collection period Reminder
Online questionnaire
Random sample 15/10–28/10 7 days after mailing Web panel 15/10–28/10 7 days after mailing Crowdsourcing 15/10–15/11 N/A
Mobile app
Random sample 15/10–4/11 7 days after mailing
Web panel 15/10–4/11 After 3 and 7 days for downloading and corrections, respectively
Crowdsourcing 15/10–15/11 N/A
Table 5. Sample size, number of respondents, and response rate for each data collection and recruitment method.
Collection
method Recruitment method Sample size
Number of respondents Response rate Online questionnaire
Random sample (w/o incentive) 1,400 192 14% Random sample (with incentive) 1,400 222 16%
Web panel 1,519 221 N/A
Crowdsourcing N/A 407 N/A
Mobile app
Random sample 2,800 70 3%
Web panel 5,085 198 N/A
Crowdsourcing N/A 279 N/A
The overall response rates were low, 14–16% for the online questionnaire and 3% for the mobile app. An incentive had a marginal effect on the inclination to complete the questionnaire. The response rate was only just over 2% higher in the randomly sampled group that received a gift card worth SEK 100 than among those who were given no incentive. The response rate for the mobile app could have been negatively affected by a mistake made with regard to the mailing. In the mailing, the respondents were asked to download the app and start registering their trips on 15 October. The intention from the start was to send out the cover letter before 15 October to all respondents in the group, but the mailing was instead divided into four parts, which were sent out on 13, 16, 20, and 23 October. October 13 was a Friday, which meant that all the people in the sample received the cover letter after 15 October but were asked to respond starting on 15 October. The fact that the respondents were asked to respond several days before they received the mailing could have given an impression of ineptitude and negatively affected the response rate. The mistake was handled by updating the text in the reminder mailing. That this affected the response rate is evident in part in the large volume of e-mails received containing comments indicating that the survey looked to be inept. A more reasonable response rate for the app should be considered to be roughly 8%, i.e., the rate achieved in a study in Umeå, where the random recruitment process functioned as intended (Indebetou & Börefält, 2018).
Response rates for both the web panel and crowdsourcing are not relevant, as there was no random sampling. On the other hand, it is evident that more mailings to app users (5,085) were required than was the case with the online questionnaire to achieve the target of at least 200 responses (5,085 versus 1,519 mailings).
VTI PM 22 Table 6 shows how many people downloaded the mobile app and how many of them corrected at least one day of data. The desired target of 200 respondents was not achieved in the case of the random sample, although the target of 200 was achieved for both the web panel and crowdsourcing.
Table 6. Numbers of people who downloaded the mobile app and corrected data (at least one day), and number of reported days per person, broken down by recruitment method.
Recruitment method Downloaded the
mobile app Number of net responses
Average number of reported days per person
Random sample 99 70 9
Panel 246 198 11
Crowdsourcing 410 279 16
2.5.2 Item nonresponse
Item nonresponse arises when a respondent fails to answer certain questions, or if an answer contains something implausible. This could be because the respondent misunderstood a question, or because of unwillingness to provide an answer.
Table 7 presents both the numbers and percentages of item nonresponse in the trips with respect to mode of travel, travel time, and geocoding. For geocoding, the item nonresponse is presented broken down by start point, end point, or if both pieces of information are lacking. The item nonresponse with respect to geocoding was higher for the online questionnaire, i.e., 1–10%, than for the mobile app, where the item nonresponse was 1–2%. The highest item nonresponse with respect to geocoding is found in the responses from the web panellists who used the online questionnaire. Crowdsourcing had the lowest item nonresponse among the respective collection methods. The item nonresponse with respect to geocoding was higher in the online questionnaire and the mobile app than in the Gothenburg travel survey. The highest item nonresponse in the Gothenburg survey pertained to travel times.
Table 7. Incidence of item nonresponse for the trips with respect to mode of travel, travel time, and geocoding for online questionnaire and mobile app.
Online questionnaire random without incentive Online question-naire random with incentive Online question-naire web panel Online question-naire crowd-sourcing Mobile app random Mobile app web panel Mobile app crowd-sourcing TS GBG Lacking mode of travel Lacking (number) 5 6 5 15 0 2 1 - Total (number) 373 441 316 1,045 2,726 8,544 29,286 - Share (%) 1% 1% 2% 1% 0% 0% 0% - Travel time Lacking (number) 5 5 4 11 47 160 190 1,920 Total (number) 373 441 316 1,045 3,104 8,770 18,160 26,829 Share (%) 1% 1% 1% 1% 2% 2% 1% 7% Start point Lacking (number) 13 6 6 17 53 185 256 54 Total (number) 373 441 316 1,045 2,963 8,799 19,755 26,829 Share (%) 3% 1% 2% 2% 2% 2% 1% 0% End point Lacking (number) 9 5 7 11 1 19 35 62 Total (number) 373 441 316 1,045 2,963 8,799 19,755 26,829 Share (%) 2% 1% 2% 1% 0% 0% 0% 0% Neither start nor end point Lacking (number) 13 7 32 11 54 201 290 - Total (number) 373 441 316 1,045 2,963 8,799 19,755 - Share (%) 3% 2% 10% 1% 2% 2% 1% -
VTI PM 23 Table 8 presents the item nonresponses for implausible distance travelled values.5 The “on foot” mode
of travel had the most implausible values, regardless of data collection or recruitment method. The online questionnaire had a higher share of item nonresponses due to implausible distances travelled than did the mobile app, i.e., between approximately 2–3% versus 0.1%. In the case of TS GBG, the share was essentially twice as high as for the online questionnaire.
Table 8. Incidence of item nonresponse for trips based on distance travelled, broken down by mode of travel. Online questionnaire random without incentive Online questionnaire random with incentive Online questionnaire web panel Online questionnaire crowd-sourcing Mobile app random Mobile app web panel Mobile app crowd-sourcing TS GBG Implau s ible v a lue s /L a c k ing d is ta n c e t ra v e lle d p e r mod e o f tr a v e l On foot 6 8 6 11 1 4 9 - Bicycle 0 1 0 4 0 0 0 - Car 0 0 1 0 0 1 0 - Public transport 2 2 1 5 0 0 0 - Train 0 0 0 0 0 0 1 - Other 0 1 0 0 0 0 0 - Total 8 12 8 20 1 5 10 1,465 Share lacking distance travelled 21% 2.7% 2.5% 1.9% 0.0% 0.1% 0.1% 5.5% It was not possible to skip any background questions in the online questionnaire, with the result that
there is no item nonresponse in that portion. That was not the case with respect to the background questions in the mobile app, i.e., all the questions were voluntary and could thus be skipped, but the item nonresponse was still limited in scope.
2.5.3 Nonresponse analysis of the random sample
Enkätfabriken contacted a total of 400 people by telephone; they were divided into two groups of 100 who were asked to complete the online questionnaire with and without incentive, respectively, and 200 who were asked to use the mobile app. The telephone interviews were conducted in November 2017. First, the contacted people were asked if they had seen the mailing saying that they had been selected for inclusion in the pilot study: 70% of those selected to complete the online questionnaire knew of/recalled the mailing; the corresponding share among those who were invited to use the mobile app was nearly 80%.
Of those who had seen the invitation to complete the online questionnaire and had been offered an incentive (64 people), just over 40% accepted the offer. We also studied whether the group that had seen the survey invitation regarding the online questionnaire had made any trips during the
measurement day. Of those who had not seen the invitation to complete the online questionnaire (61 people), 36% would have responded had they known that they had been selected. Those who answered NO were asked a follow-up question as to whether the gift card had motivated them to take part. Of those belonging to the group that was to receive the incentive, 1/3 indicated that they would have completed the online questionnaire, while half of those belonging to the group that would not have received an incentive would have participated. It was found that nearly half had travelled/undertaken
5 Reasonable distances (km): on foot ≤25, bicycle ≤100, and car ≤1,500; public transport: bus ≤1,500, ferry/boat
≤1,000, tram ≤250, and train ≤2,000; and Other: moped ≤10, motorcycle ≤1,500, taxi ≤500, mobility service ≤500, aircraft ≤25,000, and other ≤10,000.
VTI PM 24 movements during the day, roughly 30% had not, and just over 20% could not recall. Corresponding questions were not posed to those invited to respond via the mobile app, as they did not have a specifically designated measurement day.
Of the just over 20% who had not seen the invitation to use the mobile app, the vast majority (93%, corresponding to 42 people) still would not have participated. The reason for this was most often a lack of time (31%) or that they had no access to a smart phone (12%; see also Figure 2). A gift card worth SEK 100 would have induced nearly one out of every four people who did not participate to use the mobile app. Others who had seen the invitation to download the mobile app still chose
overwhelmingly (92%) not to download it. The most common reasons for this were unspecified, i.e., “Other reason” (37%), followed by a lack of time (21%). A gift card worth SEK 100 would have induced just over one out of every four people in this group to download the mobile app.
0 10 20 30 40
No time Other reason No access to Internet/smart phone Objections on principle Too difficult/complicated Secrecy/privacy/register Voluntary Not possible to download app Purpose of the survey Illness Language difficulties Require compensation
%
Had seen the mobile app invitation (133 people) Had not seen the mobile app invitation (42 people)
Figure 2. Reasons why people did not download the mobile app, broken down by whether or not they had seen the invitation; results of Enkätfabriken’s nonresponse interviews.
2.6 Data processing
A portion of the data collected via the online questionnaire and the mobile app contains information that is not deemed plausible, or that derives from people who do not meet the established criteria for data collection. The processes applied to the collected data material are described below. Respondents who ended the online questionnaire before reaching the questions having to do with their travel were naturally excluded. This same is true for those who used the mobile app.
2.6.1 Data cleaning and aggregation
The mobile app collects data at the stage level. Trips are created by aggregating the stages present in the trip chain by adding times and distances. The mode of travel is set to the mode of travel that was used over the longest distance in the trip chain.
Table 9 shows the numbers of people from the online questionnaire and the mobile app who were excluded from this pilot study. The grounds for exclusion were that the respondents lived outside the study area, that they did not fall within the age group (16–84 years), or that their answers applied to days outside the study period. The two most common grounds for exclusion were that the respondents did not live in the study area (geography) or that their answers did not apply to the study period (date). One person was excluded because he/she did not fall into the relevant age group. The highest loss for
VTI PM 25 such grounds pertains to crowdsourcing, regardless of the data collection method, although the highest numbers of responses were also found within these groups. The loss attributable to these grounds was also comparatively high in the web panel groups. The random sample exhibited almost no loss, regardless of the collection or recruitment method.
Table 9. Number of people (online questionnaire and mobile app) who did not belong to the target population or meet the criteria and were consequently excluded from the analysis.
Grounds for exclusion Online questionnaire random without incentive Online questionnaire random with incentive Online questionnaire web panel Online questionnaire crowd-sourcing Mobile app random Mobile app web panel Mobile app crowd-sourcing Total Geography (people) 0 0 4 19 1 6 7 37 Age (people) 0 0 0 0 0 0 1 1 Date (people) 0 0 10 0 0 1 2 13 Total 0 0 14 19 1 7 10 51
With respect to the online questionnaire, information about the municipality of residence for the web panel groups was obtained from registers, and not from the questionnaire answers. The remaining responses from people who thus belong to the target group and were included in the analysis are referred to hereinafter as “net responses”. The six categories of trip purposes used in the results were derived based on the types of purposes specified in the online questionnaire and the mobile app (see Table 10).
Table 10. Categorisation of trip purpose types.
Main category of purpose of trip Description of included purpose types
Work Work; school/training; on-the-job training/work-related travel
Leisure trips Friends and relatives; hobbies, courses, club activities, religious practice; restaurant, café; exercise/outdoor life; entertainment and culture Service-related trips
Healthcare; other services Shopping trips
Picking up/dropping off someone Other
The modes of travel have also been aggregated into a few main categories. The category designated “public transport” in the results chapter includes bus, tram, boat, or other means of public transport, while “train” is reported separately. The category “Other” also encompasses moped, motorcycle, mobility service, taxi, aircraft, and other mode of travel. “Bicycle” also includes electric bicycles. In certain cases, there is insufficient data material for a breakdown into multiple subgroups to be meaningful, i.e., the number of individuals drops too low in the case of some subgroups. As a result, the bars that are based on responses from fewer than five individuals are made less prominent with the help of patterns of diagonal stripes in the diagram describing the numbers of trips and their lengths.
2.6.2 Management of multiple trip days from the mobile app
In the data collection process with the mobile app, data are collected for a number of days. The intent was that the respondents would collect data over a week, but some respondents collected data for fewer days, and many for more. To compensate for respondents having collected data for different numbers of days and to generate results that are capable of comparison with the web data and traditional TS data, the data processing was performed in three steps: In step 1, a mean value was calculated for each individual for each day of the week (Monday to Sunday); for example, the average