http://www.diva-portal.org
Postprint
This is the accepted version of a paper published in Mathematical Social Sciences. This paper has been peer-reviewed but does not include the final publisher proof-corrections or journal pagination.
Citation for the original published paper (version of record): Eriksson, K., Strimling, P. (2015)
Group differences in broadness of values may drive dynamics of public opinion on moral issues.
Mathematical Social Sciences, 77: 1-8
http://dx.doi.org/10.1016/j.mathsocsci.2015.06.004
Access to the published version may require subscription. N.B. When citing this work, cite the original published paper.
Permanent link to this version:
Group differences in broadness of values may drive
1dynamics of public opinion on moral issues
2Kimmo Eriksson 3
(Corresponding author) Centre for the Study of Cultural Evolution, Stockholm University,
4
SE-106 91 Stockholm, Sweden, and School of Education, Culture and Communication,
5
M¨alardalen University, SE-721 23 V¨aster˚as, Sweden. email: kimmoe@gmail.com
6
Pontus Strimling 7
Institute for Analytical Sociology, Link¨oping University, SE-581 83 Link¨oping, and
8
Centre for the Study of Cultural Evolution, Stockholm University, SE-106 91 Stockholm,
9
Sweden
Abstract
11
Here we propose the idea that the success of an argument in favor of an issue position should depend on whether the argument resonates with the audience’s values. Now consider two groups, one of which has a broader set of values than the other. We develop a mathematical model to investigate how this difference in broadness of values may drive a change on the popula-tion level towards posipopula-tions in line with the more narrow set of values. The model is motivated by the empirical finding that conservative morality rests equally on moral foundations that are individualizing (harm and fairness) and binding (purity, authority, and ingroup), whereas liberal morality relies mainly on the individualizing moral foundations. The model then predicts that, under certain conditions, the whole population will tend to move to-wards positions on moral issues (e.g., same-sex marriage) that are supported by individualizing moral foundations.
Keywords:
12
moral foundations, attitude change, moral opinions, micro-macro, 13
mathematical modelling, ingroup bias 14
1. Introduction
15
In a recent paper, Grossmann and Hopkins (2015) noted a paradoxical 16
feature of American public opinion: Whereas conservative responses predom-17
inate on items measuring ideological self-identification, liberal positions are 18
more popular than conservative positions on most issues. In the present pa-19
per we shall argue that such paradoxes may arise as moral psychology drives 20
cultural dynamics. 21
A key observation is that positions on issues are indeed dynamic. Ac-22
cording to the General Social Survey, a biyearly survey of opinions in the US 23
since 1972, the public opinion in the US has become more liberal on a number 24
of morally charged issues 1. For instance, from 1972 to 2012 we see substan-25
tial, sometimes even dramatic, movement towards more liberal opinions on 26
issues such as whether or not it is morally acceptable to have homosexual 27
relations (support increased from 11% in 1972 to 42% in 2012); sex before 28
marriage (support increased from 27% to 56%); allowing anti-religionists to 29
make speeches (support increased from 66% to 76%); allowing communist 30
books in the library (support increased from 53% to 71%); accepting homo-31
sexual college teacher (support increased from 48% to 83%); and approval 32
of sex-education (support increased from 79% in 1974 to 89% in 2012). In 33
contrast to these changes in specific moral opinions, the proportions of Amer-34
icans who self-identify as liberal have changed only slightly and in the other 35
direction during the same time period, going from 31% in 1974 to 28% in 36
2012. Thus, it seems that moral opinions have been changing in the liberal 37
direction in a way that cannot be accounted for by spread of liberal ideology. 38
We shall develop a hypothesis about moral opinon change based on a new 39
perspective on the psychological theory of moral foundations. When applied 40
to the dynamics of American public opinion, our hypothesis offers a possible 41
explanation of the above-mentioned phenomenon. 42
A basic idea of moral foundations theory (Haidt and Joseph, 2004; Haidt 43
and Graham, 2007; Graham et al., 2009) is that moral opinions draw upon a 44
handful of universal human moral foundations: Harm, Fairness, Ingroup, 45
Authority, and Purity. (The definitions of these moral foundations and 46
much other relevant material, including a discussion of additional candi-47
dates for moral foundations, are conveniently collected at a single website, 48
www.moralfoundations.org.) Individuals differ in their reliance on each moral 49
foundation, as measured by the Moral Foundations Questionnaire (Graham 50
et al., 2011). The MFQ asks questions about how relevant the respondent 51
finds various concerns (e.g., whether or not someone violated standards of 52
purity and decency) when making moral judgments. Responses are given 53
on a scale from This consideration has nothing to do with my judgments of 54
right and wrong to This is one of the most important factors when I judge
55
right and wrong. According to Graham et al. (2009), such reports of moral
56
relevance ”are likely to be concordant with explicit reasoning during moral 57
arguments” (p. 1031). Thus, individuals’ reliance on moral foundations (as 58
measured by the MFQ) is expected to play a role when they evaluate moral 59
arguments. 60
The Gallup polls indicate that many individuals change their positions 61
on moral issues over time. Although it is difficult to know the cause of an 62
individual changing position, exposure to arguments is an obvious candidate 63
(Chong, 1996; Chong and Druckman, 2007; Keasey, 1973; Lindstr¨om, 1995, 64
1997). The new perspective we offer is that reliance on moral foundations 65
might influence the individual’s receptiveness to various arguments that bears 66
on an issue — thereby explaining why an individual who is exposed to an 67
argument on a moral issue may sometimes change position, sometimes not. 68
To illustrate, consider how positions on the issue of same-sex marriage may 69
be taken by two hypothetical individuals, H and PH, where H finds only 70
the moral foundation of Harm to be relevant whereas PH relies both on 71
Purity and Harm. When exposed to a Harm-based argument why same-72
sex marriage should be legal, both H and PH should find the argument 73
relevant and may update their positions on the issue accordingly. Change of 74
position in the opposite direction may occur when PH is exposed to a Purity-75
based argument against same-sex marriage, whereas H is assumed not to be 76
receptive to arguments based on Purity and is therefore less likely to change 77
position based on such arguments. The consequence is that moral arguments 78
can sway PH in both directions but H only in one direction. If conservatives 79
are more likely to be PH types and liberals are more likely to be H types, 80
this could form the basis of an explanation of the phenomenon we described 81
in the opening paragraph. 82
In the coming sections we explore the idea sketched above. First we de-83
velop a hypothesis about an individual mechanism, ”position-change bias”, 84
grounded in several previous lines of research. We then develop a mathe-85
matical model to allow investigation of what macro-level dynamics of moral 86
opinons in the population should emerge from the proposed micro-level mech-87
anism. The last two sections present some testable predictions, both at 88
micro-level and macro-level, and discuss our contribution from a broader 89
perspective. Most of the mathematical analysis appears in the Appendix. 90
2. A hypothesis about an individual bias in moral position change
91
The basic message of this paper is that population level change towards 92
more liberal positions on morally loaded issues may be a consequence of 93
conservatives tending to endorse a greater diversity of moral foundations 94
than liberals. The difference between liberals and conservatives was first 95
proposed in a seminal paper by Haidt and Graham (2007): 96
Our thesis in this article is that there are five psychological foun-97
dations of morality, which we label as harm/care, fairness/reciprocity, 98
ingroup/loyalty, authority/respect, and purity/sanctity. Cultures 99
vary on the degree to which they build virtues on these five foun-100
dations. As a first approximation, political liberals value virtues 101
based on the first two foundations, while political conservatives 102
value virtues based on all five. (p. 99) 103
Haidt and Graham (2007) based this statement on the results of a survey 104
to 1,613 Americans, using a precursor to the Moral Foundations Question-105
naire. Researchers from the same group have since replicated the finding 106
using a variety of methods, including the final version of the MFQ (Graham 107
et al., 2009; Koleva et al., 2012). Moral foundations theory is not without 108
its critics; see the 2013 special issue of Journal of Moral Education (Maxwell 109
and Narvaez, 2013). Of particular relevance to our thesis, some critics have 110
questioned the fundamental nature of the difference in reliance on moral 111
foundations between liberals and conservatives. For instance, studies have 112
found that the difference in moral foundations endorsement is attenuated 113
under cognitive load or situational threat (Wright and Baril, 2011, 2013). 114
These interesting results give new insight into the nature of moral founda-115
tions and suggest that other differences between liberals and conservatives 116
might be more fundamental. However, our premise is only that the differ-117
ence in reliance on moral foundations exists in practice. This premise is not 118
undermined by the new studies; on the contrary, their control conditions 119
replicate the typical difference between liberals and conservatives. 120
2.1. The relation between moral foundations and individual change of
posi-121
tions on morally loaded issues
122
In the introduction we noted that individuals cannot be static in their 123
positions on moral issues. The change in population level support of same-124
sex marriage seems to be too fast to be accounted for only by population 125
turnover, hence individual change in positions must be common. The fact 126
that people may change positions on moral issues has not received enough 127
attention in moral foundations research (Bloom, 2010). Nonetheless, MFQ 128
items on ”the most important factors when I judge right and wrong” suggest 129
a view of moral judgment as an ongoing process. Moral judgment could of 130
course be an ongoing process that consistently results in the same judgment 131
for a given issue. However, earlier psychological research provides good rea-132
son to expect individuals to fluctuate in their positions when they encounter 133
moral arguments. 134
For instance, a classic study of Eiser and White (1974) demonstrated 135
that people’s position on an issue may change depending on how the issue 136
is framed. In a more recent study, Brewer (2002) let participants read a 137
newspaper article that framed gay rights either as an issue of morality or 138
an issue of equality. When participants later were asked for the basis of 139
their own position on the issue, they tended to refer to arguments within 140
the frame to which they had been exposed. Taken together, these findings 141
suggest that when an individual encounters a moral argument in which the 142
issue is framed as being about a certain moral foundation, this aspect of the 143
issue may become more important and thereby result in a revised judgment. 144
This view is closely related to political scientist Dennis Chong’s model of 145
political attitudes changing with the framing of issues (Chong, 1996; Chong 146
and Druckman, 2007). 147
Our argument then rests on one fundamental assumption: Framing of 148
an issue as being about, say, purity should be effective only to the extent 149
the individual endorses purity as a valid basis for moral judgment. In other 150
words, we assume that people’s self-theories about the bases of their moral 151
judgments have at least some grounding in how they actually form moral 152
judgments. This assumption is consistent with a study of a large sample 153
of US residents who had previously disclosed their political orientation on 154
the liberal-conservative spectrum (Koleva et al., 2012). Respondents filled 155
in both the MFQ and a questionnaire asking for their position on a num-156
ber of political issues (e.g., same-sex marriage) to which moral arguments 157
are commonly applied. Regression analyses of positions on political issues 158
showed that moral foundations were predictive above and beyond political 159
orientation on the liberal-conservative spectrum. For instance, to favor a 160
ban for same-sex marriage was independently predicted by conservatism, en-161
dorsement of the Purity foundation, and lack of endorsement of the Harm 162
foundation. Koleva et al. (2012) noted that their correlational results can-163
not establish a causal order between foundation endorsement, ideology, and 164
issue positions. We think the most natural interpretation of their results is 165
that people’s positions on issues are to some extent influenced directly by 166
their reliance on various moral foundations. Our hypothesis is based on this 167
interpretation. 168
2.2. The position-change bias hypothesis
169
Chong (1996) presented a dynamical model of framing in which an indi-170
vidual’s receptiveness to various framings of an issue was a key parameter. 171
Building on this idea we shall define an individual’s position-change bias on 172
a given issue as the ratio between, on the one hand, the likelihood of moral 173
arguments ”against” making the individual change position when he (or she) 174
is currently ”for” and, on the other hand, the likelihood of arguments ”for” 175
making the individual change position if he is currently ”against”. An indi-176
vidual who is always receptive to arguments for the other position than the 177
one he currently holds has no or weak change bias. The position-178
change bias is strong if one of these change likelihoods is much smaller than 179
the other. Once such a strongly biased individual has arrived at the favored 180
position, he is unlikely to be swayed by arguments for the other position. 181
Above we have put forward a view of moral foundations as a way to un-182
derstand change of moral opinion. In this view, MFQ scores on the different 183
moral foundations predict how receptive the individual will be to different 184
kinds of moral arguments. For any given issue, the individual’s varying re-185
ceptivity to different arguments for and against then sums up to his (or her) 186
position-change bias on the issue. 187
From this hypothesis a prediction follows: Individuals who endorse a 188
wider range of moral foundations should tend to have weaker position-change 189
bias than individuals who endorse a smaller range of moral foundations. From 190
the premise that liberals tend to endorse a smaller range of moral foundations 191
than conservatives we then obtain a second prediction: Conservatives should 192
tend to have weaker position-change bias than liberals. We do not know of 193
any study directly testing this prediction. However, it is clearly consistent 194
with recent findings that conservatives opinions tend to align with a range 195
of both conservative and liberal viewpoints whereas liberals political beliefs 196
show less variation and more consistent support for liberal stances on issues 197
(Kesebir et al., 2013). 198
Related to our hypothesis, Day et al. (2014) recently suggested that “al-199
tering the evoked moral foundations may shape peoples subsequent attitudes, 200
particularly if the moral foundations seem relevant” (p. 2). They also re-201
ported data that generally supported this suggestion. However, it should be 202
noted that these data do not speak directly to our hypothesis. For instance, 203
whereas we are interested in the effect of exposure to arguments made by 204
others, participants in these studies came up with arguments themselves. 205
Also, the focus of our hypothesis is moral opinion, whereas Day et al. (2014) 206
studied more general policy issues (immigration, the environment, economic 207
markets, social programs, and education). 208
3. A mathematical model of population-level change of moral
opin-209
ions based on individual-level biases
210
An intriguing aspect of the position-change bias hypothesis is that it offers 211
a potential explanation for the pattern described in the beginning. When 212
exposed to a counter-argument to one’s current position, the likelihood that 213
a conservative will abandon a position typically favored by conservatives is 214
expected to be greater than the likelihood that a liberal will abandon a 215
position typically favored by liberals. It seems intuitive that, in the long 216
term, this asymmetry in position-change bias could lead to a shift in the 217
population towards the position typically favored by liberals. 218
However, position-change bias is not the only bias that will affect the 219
cultural dynamics of moral opinions. A large body of social psychological 220
research suggests a permeative presence of ingroup bias. We should expect 221
conservatives to be much more likely to be exposed to and care about a moral 222
argument when it is made by a fellow conservative than when made by a 223
liberal, and vice versa. In order to explore the potency of position-change 224
bias in the presence of group-exposure bias we developed a mathematical 225
model of the cultural dynamics of moral opinions. 226
Mathematical models enable researchers to explore the consequences of 227
various possible assumptions. Such models have been used for decades in 228
mathematical sociology and cultural evolution research (Boyd and Richer-229
son, 1988; Coleman, 1994; Schelling, 2006). Chong (1996) used a dynamic 230
model based on assumptions partly related to ours to discuss a number of 231
issues in political attitude change, including the development of consensus or 232
polarization on an issue. We know of no previous models aimed specifically 233
at exploring how empirical findings on individual moral cognition should 234
influence our understanding of the dynamics of moral opinions. 235
3.1. Model assumptions
236
For maximal simplicity we shall assume an infinite population in which 237
every individual is either Lib or Con, a simple dichotomy. Now consider an 238
issue on which people hold either of two positions, either for or against. 239
The for position is better aligned with the Lib profile of moral foundations, 240
whereas the against position is better aligned with the Con profile. How-241
ever, these differences in moral foundation profiles do not strictly determine 242
the individual’s position on the issue. An individual’s position may change 243
if the individual is exposed to an argument for the other position. 244
Three parameters govern the process by which positions are acquired. The 245
first parameter is the group-exposure bias. This bias measures how much less 246
likely it is for an individual to be exposed to (and care about) the arguments 247
of someone from the same political orientation than of someone from the 248
other political orientation (i.e., a Lib is more likely to listen to another Lib, 249
etc.). The group-exposure bias for a given set of values will be defined as the 250
ratio between two probabilities as follows: 251
Gl =
Prob(a Lib is exposed to a Con’s argument) Prob(a Lib is exposed to a Lib’s argument) and, analogously,
252
Gc =
Prob(a Con is exposed to a Lib’s argument) Prob(a Con is exposed to a Con’s argument).
Note that these probability ratios incorporate the influence of all factors on 253
exposure. Thus, the group-exposure bias will reflect the total influence of 254
psychological factors (such as preferences for the ingroup) and structural 255
factors (such as the tendency for similar people to cluster together, the pro-256
portions of Libs and Cons in the population, and any differences between the 257
groups in their power and efforts to expose others to their arguments). With 258
all exposure probabilities assumed to be non-zero and a Lib assumed to be 259
at least as likely to be exposed to a Lib argument than to a Con argument, 260
etc., the group-exposure bias parameters are assumed to satisfy 0 < Gl ≤ 1
261
and 0 < Gc≤ 1.
262
Our assumption is that the source of bias in exposure is group member-263
ship, not position. In other words, we assume the conditional probability 264
of being exposed to an argument for, given that the individual making the 265
argument is a Con, to be just the current proportion of for within the Con 266
group (and similarly for alternative possibilities). 267
The second parameter is the position-change bias. This bias measures how 268
the difference in moral foundation profiles between the political orientations 269
makes it less likely for an individual to be swayed by arguments for one 270
position than for the other position (i.e., a Lib is less easily swayed to the 271
against position than to the for position, etc.). The position-change bias 272
for a given set of values is defined as the ratio between two probabilities as 273
follows: 274
Pl= Prob(a Lib who is for is swayed when exposed to an arg. against)
Prob(a Lib who is against is swayed when exposed to an arg. for) and, analogously,
275
Pc= Prob(a Con who is against is swayed when exposed to an arg. for)
Prob(a Con who is for is swayed when exposed to an arg. against). Assuming all swaying probabilities to be non-zero and a Lib more likely to 276
be swayed to for than against, etc., the position-change bias parameters 277
must satisfy 0 < Pl ≤ 1 and 0 < Pc≤ 1.
278
The third parameter is the influentiability coefficient. This is a measure 279
of how often others are allowed to influence an individual’s position and 280
incorporates both absolute levels of exposure per time step and absolute 281
levels of influence. Previous research has indicated that conservatives tend 282
to exhibit less openness than liberals (Jost et al., 2003), which suggests that 283
influentiability differs between political orientations. We therefore introduce 284
two separate influentiability coefficients, Il> 0 and Ic > 0.
285
3.2. The dynamical system
286
Denote the proportions of for and against in the Lib population at a 287
certain time by ql and (1− ql), respectively. The corresponding proportions
288
in the Con population are qc and (1− qc).
289
Change comes from individuals being exposed to and swayed by argu-290
ments for the other position. Let ∆ql/∆t denote the change over a small
291
time step ∆t in the proportion of for in the Lib population. Four types of 292
events contribute to change: 293
• A Lib who is currently against may be swayed from exposure to a
294
Lib who is for. This event happens with rate (1 − ql)qlIl.
295
• A Lib who is currently against may be swayed from exposure to a
296
Con who is for. Because of group-exposure bias, this happens only 297
with a rate of (1− ql)qcGlIl.
298
• A Lib who is currently for may be swayed from exposure to a Lib who
is against. Because of position-change bias, this happens only with a 300
rate of ql(1− ql)PlIl.
301
• A Lib who is currently for may be swayed from exposure to a Con
302
who is against. Because of combination of group-exposure bias and 303
position-change bias, this happens only with rate ql(1− qc)GlPlIl.
304
Under the assumption that the population is infinite there will be no stochas-305
tic effects and we can just sum the above rates of change, with the appropriate 306
signs, to obtain the following formula for change over a small time step ∆t: 307
∆ql
∆t = [+(1− ql)(ql+ qcGl)− qlPl((1− ql) + (1− qc)Gl)] Il (1) In this equation, note how the three parameters occur in the right-hand side 308
expression. First, the influentiability coefficient Il occurs as a factor of the
309
entire change expression. As we discuss in the Appendix, this means that 310
the influentiability coefficient will influence the speed of change, but it will 311
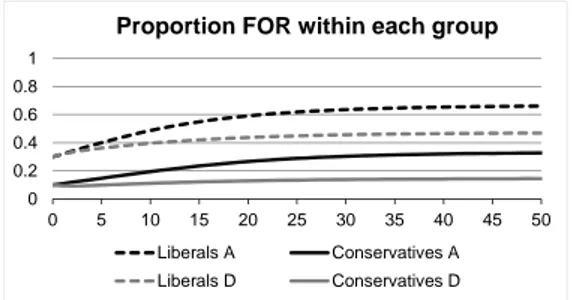
not influence the long-term outcome. Second, the position-change bias Pl
312
multiplicatively decreases all swaying of Libs in the against direction. The 313
swaying of Libs in the for direction is decreased by the group-exposure bias 314
Gl, but not multiplicatively; group-exposure bias decreases only the swaying
315
of Libs by Cons (and regardless of direction), whereas the swaying of Libs by 316
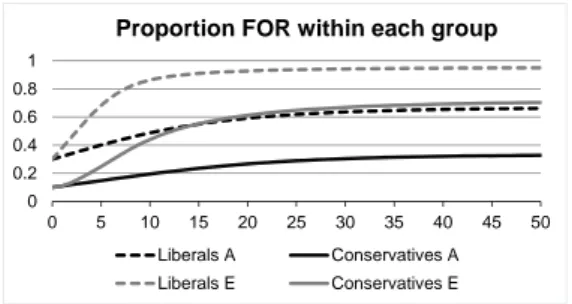
Libs is unaffected. As we shall see in the Appendix, it is therefore difficult, 317
and often impossible, for a change in the latter bias to compensate for a 318
change in the former bias. 319
By analyzing the analogous four events for swaying of Cons we obtain a 320
similar equation for the dynamics of qc:
321
∆qc
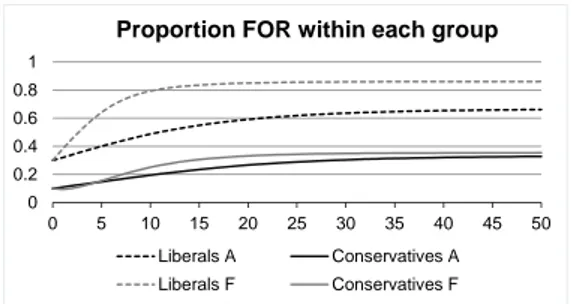
Note that the parameters occur in this equation in the same manner as in 322
the previous one. Thus, the influentiability coefficient Ic occurs as a factor
323
of the entire change expression; the position-change bias Pc multiplicatively
324
decreases all swaying of Cons in the for direction; the swaying of Cons in 325
the against direction is decreased by the group-exposure bias Gc, but not
326
multiplicatively. 327
3.3. Results
328
A mathematical analysis of this dynamical system is given in the Ap-329
pendix. Here we present the main results in an accessible way. Recall that 330
the model assumes that conservatives and liberals are biased toward different 331
positions on an issue. The model predicts that: 332
1. if a position is present at all in the population it will be present in both 333
groups but in different proportions; 334
2. the long-term proportions do not depend on the initial proportions, nor 335
on the influentiability coefficients; 336
3. the long-term proportions are determined by the strength of the group-337
exposure bias and the position-change bias such that the position fa-338
vored by the more biased group will tend to become the majority po-339
sition in the population; 340
4. one group’s biases influence the long-term proportions of positions in 341
both groups; 342
5. position-change bias plays a greater role than group-exposure bias (i.e., 343
it is difficult to compensate for a difference in position-change bias by 344
a difference in group-exposure bias). 345
To illustrate these analytic results we show the outcomes of a series of 346
computer simulations of the model. Each simulation tracks the change of 347
the proportion of for among liberals and conservatives over 50 time steps. 348
Our reference case will be Simulation A, in which there is no group-exposure 349
bias (Gl = Gc = 1), both groups exhibit equally strong position-change bias
350
(Pl = Pc= 0.5), and are equally influentiable (Il= Ic= 0.5). Starting at low
351
proportions of for, ql= 0.3 and qc= 0.1, we see in Figure 1 that proportions
352
of for increase over time towards equilibrium levels at ql= 2/3 and qc= 1/3
353
(as predicted by plugging these parameter values into the formula (A.8) in 354
the Appendix). 355
Figure 1 also illustrates that the same equilibrium is approached regard-356
less if the start values are radically different: In Simulation B the for po-357
sition is initially in majority in both groups, yet ends up approaching the 358
same equilibrium levels (ql= 2/3 and qc= 1/3). In the same vein, Figure 2
359
illustrates that the same equilibrium is approached, only at a slower speed, 360
if an influentiability coefficient is set at a lower value (Simulation C). 361
Now consider the effect of group-exposure bias. Figure 3 compares the 362
reference case with Simulation D, in which the conservative group-exposure 363
bias is stronger than in Simulation A (Gc is set to 0.5 instead of 1). Over
364
time this conservative group-exposure bias results in a lower proportion of 365
the for position not only among conservatives but also among liberals. For 366
the population as a whole, this means a substantially decreased support for 367
the for position due to conservative group-exposure bias. 368
Next we turn to position-change bias, the key concept of this paper. Fig-369
ure 4 compares the reference case with Simulation E, in which the liberal 370
position-change bias is stronger than in Simulation A (Pl is set to 0.25
in-371
stead of 0.5). Over time this liberal position-change bias results in a greater 372
proportion of the for position not only among liberals but also among con-373
servatives. For the population as a whole, this means a substantially in-374
creased support for the for position due to liberal position-change bias. 375
Finally, consider the interaction of the two types of bias. Figure 5 com-376
pares the reference case with Simulation F, combining the conservative position-377
change bias and the liberal position-change bias of the two previous simula-378
tions. Over time this combination of biases results in a greater proportion of 379
the for position among liberals but no change among conservatives. For the 380
population as a whole, this means increased support for the for position. In 381
other words, position-change bias played a greater role than group-exposure 382
bias for the population as a whole. 383
3.4. Discussion of the model assumptions
384
Our simple model could be extended and refined in various ways to make 385
it more realistic. Here we point out five assumptions that could be relaxed 386
and discuss what would be the likely impact on results. 387
First, predictions of long-term behavior are based on the assumption that 388
parameter values are constant over time. However, the model itself is based 389
on a rule that updates proportions of for and against in each time-step. 390
Thus, the model allows simulations of fluctuating parameter values. Such 391
fluctuations will lead to fluctuating proportions of for and against. Long-392
term average proportions over time should still be predictable by long-term 393
average parameter values. 394
Second, our model made the unrealistic assumption of an infinite popula-395
tion. The point of this assumption was to let us ignore stochastic effects and 396
obtain a deterministic rule for change in the population in each time step. 397
A finite population model must instead keep track of how each individual is 398
subject to a sequence of random events in which the individual with some 399
probability is exposed to another’s argument and, if so, with some proba-400
bility is swayed. The expected population change in one time step is the 401
same as in the infinite population model. By chance, the change may be-402
come smaller or greater than expected. Because the real population (e.g., in 403
America) is very large, the law of large numbers implies that such stochastic 404
effects would typically entail only the addition of a minimal amount of noise 405
to the prediction of the infinite population model. Thus, we conclude that 406
taking finiteness of the population into account is very unlikely to have a 407
large impact on the results. 408
Third, our model allows no other differences between individuals than 409
those connected with the division in liberals and conservatives. In other 410
words, all individuals within a group are assumed to be identical in their 411
parameter values. We can think of our model as replacing all individuals by 412
the group average. A more refined model would, around these group aver-413
ages, incorporate random within-group variation of characteristics between 414
individuals. Because our results only deal with the aggregate level (i.e., the 415
proportion of the population that changes in a time step), it is likely that 416
they mainly depend on the aggregated level of characteristics (i.e., group av-417
erages). Thus, we conclude that taking within-group variation in parameter 418
values account is unlikely to have a large impact on the results. 419
Fourth, our model assumes that exposure within each group reflects the 420
current proportions of for and against in the group. This assumption 421
would automatically hold if every individual is equally likely to be a source 422
of social influence. However, it will not necessarily hold in actual networks of 423
social influence, in which some individuals wield much more influence than 424
others do due to factors like status, connections, ability and interest. A more 425
refined model would incorporate an influence-weight for each individual, gov-426
erning the probability of others to be exposed to that individual’s argument. 427
Such a refined model is likely to behave approximately as the original model 428
with parameters set to the influence-weighted average parameter values. This 429
would have a qualitative impact on results only if highly influential liberals 430
are more like conservatives and vice versa. 431
Fifth, our model assumes that people change their position on moral 432
issues from exposure to moral arguments. In reality there might be other 433
important mechanisms of change. Specifically, people might adopt positions 434
without ever considering how they fit with their endorsed moral foundations 435
(e.g., due to automatic conformity). Any sufficiently well-defined proposal for 436
such mechanisms could be included in a model. However, for such additional 437
mechanisms to have a qualitative impact on our results it seems that they 438
would have to be stronger for one group than for the other. We know of no 439
a priori reason to expect morally unmotivated change of positions on moral 440
issues to vary with political orientation. Thus, as long as the basic mechanism 441
underlying our model is correct, we expect the results of our model to make 442
qualitatively correct predictions in realistic settings. 443
4. Predictions
444
Building on prior theoretical work on the importance of individual differ-445
ences in receptivity to various framings of an issue (Chong, 1996), we have 446
here defined the concept of individual differences in ”position-change bias.” 447
Building on moral foundations theory (Haidt and Graham, 2007; Graham 448
et al., 2009) we then developed a hypothesis about how position-change bias 449
should relate to moral foundation endorsement. This hypothesis makes the 450
following prediction, which should be testable in longitudinal studies or ex-451
periments on change of moral positions (see Keasey (1973) for an example). 452
Prediction 1: Consider any particular moral issue for which different
453
kinds of moral foundations tend to support arguments for different positions 454
on the issue. Individuals who equally strongly endorse moral foundations of 455
both kinds should tend to exhibit less position-change bias than individuals 456
who strongly endorse only one kind of moral foundations. 457
We also discussed the empirical finding that conservatives tend to give 458
more equal endorsement of different moral foundations than liberals (Haidt 459
and Graham, 2007; Graham et al., 2009; Koleva et al., 2012). This empirical 460
finding matches the premise of Prediction 1, thus yielding a second interesting 461
prediction. 462
Prediction 2: On moral issues for which different kinds of moral
founda-463
tions typically support arguments for different positions, conservatives should 464
tend to exhibit less position-change bias than liberals. 465
Because position-change bias measures how likely an individual is to 466
change position from for to against compared to the opposite direction, the 467
aggregate effect of the second prediction over time should be long-term move-468
ment of moral opinons in the direction given by the moral foundations (harm 469
and fairness) favored by liberals. We used a mathematical model to investi-470
gate how sensitive this conclusion are to the presence of group-exposure bias. 471
The results can be summarized as a third prediction. 472
Prediction 3: Unless conservative group-exposure bias is much stronger
473
than liberal group-exposure bias, stronger position-change bias among liber-474
als should lead to a tendency for liberal positions to become majority posi-475
tions over time. 476
It seems unlikely that group-exposure bias in the psychological sense 477
should differ much in strength between liberals and conservatives. How-478
ever, group-exposure bias in the model is defined simply as the degree to 479
which members of one group are more likely to be exposed to arguments 480
from the own group than to arguments from the other group. This means 481
that groups could differ in their group-exposure bias for purely institutional 482
reasons. A conservative media monopoly and organized sanctions against the 483
expression of liberal opinions should lead to generally higher exposure to con-484
servative arguments than to liberal arguments. In our model this would be 485
represented as stronger conservative group-exposure bias and weaker liberal 486
group-exposure bias. 487
The suggested pathway to more liberal moral opinions should therefore 488
apply only under conditions of media pluralism and free speech. These con-489
ditions are, on the whole, satisified in the United States. The pathway pro-490
posed in this paper may therefore be (at least part of) the explanation for the 491
American trend noted in the beginning: moral opinons seem to become more 492
liberal without a corresponding liberalization of values. Many other societies 493
lack media pluralism and free speech. Variation in these societal feature 494
has been studied in several academic disciplines. For instance, economists 495
and political scientists are interested in the relation between press freedom 496
and corruption. Some propose a causal effect such that freer press leads to 497
lower corruption (Freille et al., 2007). Psychologists have found press free-498
dom to covary with self-expression values and individualism (e.g., Van de 499
Vliert (2011)). In the same vein as these findings, our theoretical argument 500
yields a prediction about societal differences. 501
Prediction 4: Societal trends towards more liberal opinons on moral
502
issues should be found mainly in societies with media pluralism and free 503
speech. 504
This prediction should be of broad interest to psychologists, sociologists 505
and political scientists. 506
5. Conclusion
507
Nobel laureate Thomas Schelling wrote a book based on the principle that 508
macrobehavior can be derived from micromotives (Schelling, 2006). Within 509
the realm of economic behavior this principle has been extensively explored in 510
economic models based on assumptions of profit-maximizing actors. Outside 511
the economic realm the micromotive of profit maximization is less generally 512
applicable, but various preferences and biases may instead apply on a case-by-513
case basis. For instance, one theme in the abovementioned book by Schelling 514
is how individual preferences for being with similar others could lead to the 515
emergence of macroscale segregation. In the present paper we have similarly 516
argued that the macro-dynamics of moral opinons might be derived from 517
individual biases in receptivity to moral arguments. 518
We have argued elsewhere that a fundamental aspect of cultural change 519
is that individuals change their cultural traits over life; this feature distin-520
guishes cultural evolution from genetic evolution, genes being approximately 521
constant over each individual’s lifetime (Strimling et al., 2009). Specifically, 522
a model of the cultural dynamics of moral opinons should be informed by 523
knowledge about biases in the process whereby individuals change their moral 524
judgments. Piecing together findings from moral foundations research with 525
findings from research on attitude change, we formulated a hypothesis about 526
a mechanism at the individual level. The corresponding Predictions 1 and 2 527
about micromotives could be tested in future psychological research. Assum-528
ing the validity of the individual level hypothesis we then modeled the social 529
dynamics that should emerge. The corresponding Predictions 3 and 4 about 530
macrobehavior could be tested using data and methods from sociology and 531
political science. 532
The success of the micro-to-macro approach depends on research at the 533
different levels fitting together. If we may offer a general conclusion, it would 534
be that psychological research on preferences and biases — anything that 535
could serve as ”micromotives” — could become more useful for the study of 536
dynamics of macrobehavior by focusing more on how individuals change. 537
6. Acknowledgement
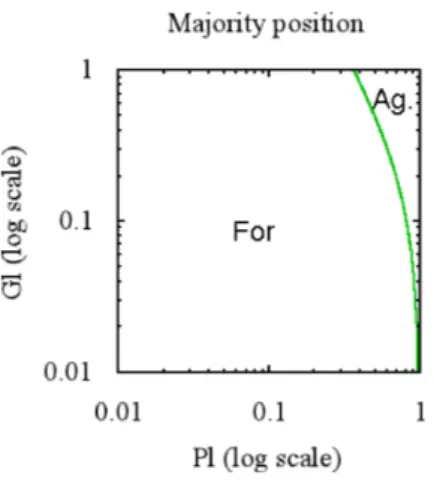
538
The preparation of this article was supported by grants from the Swedish 539
Research Council (2009-2390 and 2009-2678) to the authors. We are grateful 540
to Brent Simpson for inspiring this work. 541
Appendix A. Analysis of equilibria of the dynamical system
542
Equilibria (i.e., fixed points) of the dynamical system are obtained when 543
there is zero change, that is, when the formulas in (1) and (2) equal zero. 544
The equilibrium equations can be written 545
(1− ql)(ql+ qcGl) = qlPl((1− ql) + (1− qc)Gl) (A.1)
and 546
qc((1− qc) + (1− ql)Gc) = (1− qc)Pc(qc+ qlGc). (A.2)
Note that the equilibrium equations do not depend on the influentiability 547
coefficients Il and Ic. Thus, although the speed of the dynamical process is
548
influenced by these coefficients they do not influence what are the equilibrium 549
outcomes. 550
Appendix A.1. Pure equilibria
551
It is evident from the equilibrium equations that there are always two pure 552
equilibria: (A.1) and (A.2) are satisfied both by ql = qc= 1 and ql= qc = 0.
553
These solutions correspond to the entire population being for and against, 554
respectively. 555
Appendix A.2. Mixed equilibria
556
Next we investigate the possibility of mixed equilibria. First, it is straight-557
forward to see that the equilibrium equations (A.1) and (A.2) can never be 558
satisfied when only one group is mixed, so a mixed equilibrium must have 559
both 0 < ql < 1 and 0 < qc < 1. For any such mixed state we can define
560 ratios of proportions: 561 γ := qc ql > 0 and β := 1− ql 1− qc > 0.
Note that from these ratios the proportions can be retrieved: ql = (1 −
562
β)/(1− γβ) and qc= γql.
563
Appendix A.3. Trivial mixed equilibria
564
First consider the trivial case where nobody has any position-change bias 565
(i.e., Pl = Pc = 1). Both equilibrium equations then reduce to ql = qc,
566
that is, any proportion of for is an equilibrium as long as it is the same in 567
both groups. All remaining (”nontrivial”) mixed equilibria must satisfy both 568
Pl< 1 and Pc< 1.
569
Appendix A.4. Nontrivial mixed equilibria
570
In order to look for parameters allowing non-trivial mixed equilibria, we 571
will henceforth assume that 0 < ql, qc, Pl, Pc < 1. If we divide the equilibrium
572
equations by ql(1− qc), they can be expressed in terms of γ and β as
573
β(1 + γGl) = Pl(β + Gl) (A.3)
and 574
γ(1 + βGc) = Pc(γ + Gc). (A.4)
Solving for β in (A.3) and substituting into (A.4) we obtain a quadratic 575
equation in γ. On standard form: 576
γ2+γ[(1− Pc)(1− Pl)− GlGc(Pc− Pl)]− PcGc(1− Pl)
Gl(1− Pc)
= 0 (A.5)
Note that the constant term is negative, so there will be only one positive 577
solution. Letting 578
the non-trivial mixed equilibrium solution to (A.5) can be expressed as 579 ˆ γ = −[(1 − Pc)(1− Pl)− GlGc(Pc− Pl)] + √ R 2Gl(1− Pc) > 0. (A.6) In equations (A.3) and (A.4) the roles of β and γ are symmetric with 580
respect to swapping Lib and Con(whereas R is invariant under this swap). 581
Hence, by swapping Lib and Con in (A.6) we obtain the non-trivial mixed 582
equilibrium value for β: 583 ˆ β = −[(1 − Pc)(1− Pl) + GlGc(Pc− Pl)] + √ R 2Gc(1− Pl) > 0. (A.7) Recall the identities ql= (1− β)/(1 − γβ) and qc= γql. The values of ql
584
and qc in a non-trivial mixed equilibrium can therefore be expressed as
585
ˆ
ql= (1− ˆβ)/(1 − ˆγ ˆβ) and ˆqc= ˆγ ˆql, (A.8)
where ˆγ and ˆβ are given by (A.6) and (A.7). Of course, the non-trivial mixed
586
equilibrium exists only if the equilibrium proportions satisfy 0 < ˆql < 1 and
587
0 < ˆqc < 1. From (A.8) it follows that these conditions are satisifed if and
588
only if ˆγ < 1 and ˆβ < 1. Using (A.6) and the assumptions that all parameters
589
lie between 0 and 1, the inequality ˆγ < 1 straightforwardly simplifies to
590
(1− Pc)(1− Pl) + GlGc(Pl− Pc) + Gl(1− Pc)− PcGc(1− Pl) > 0. (A.9)
Symmetrically, ˆβ < 1 implies that
591
(1− Pc)(1− Pl)− GlGc(Pl− Pc) + Gc(1− Pl)− PlGl(1− Pc) > 0. (A.10)
Appendix A.5. Importance of parameter values in determining equilibrium
592
proportions of for and against
593
Figure A.6 illustrates how parameter space is divided into three sectors 594
by the inequalities (A.9 and A.10) for the existence of a mixed equilibrium. 595
The figure is drawn for Gl = Gc = 1/2 but looks qualitatively similar for
596
other values of the group-exposure bias parameters. When Pl is much lower
597
than 1 (i.e., liberals are strongly position-change biased) but Pc is close to
598
1 (i.e., conservatives are not very position-change biased), a pure equlibrium 599
where everyone is for is obtained. Symmetrically, when Pc is much lower
600
than 1 but Pl is close to 1, a pure equlibrium where everyone is against is
601
obtained. 602
The mixed equilibrium exists in the intermediate sector where both in-603
equalities (A.9) and (A.10) are satisfied. In this sector the pure equilbria are 604
unstable. It is well-known that an equilibrium of a dynamical system is un-605
stable if the Jacobian of the dynamical system, evaluated at the equilibrium, 606
has an eigenvalue with absolute value greater than one. It is straightforward 607
to calculate the Jacobian, evaluate it at either of the two pure equilibria, 608
and verify that the inequalities (A.9) and (A.10), respectively, imply that 609
the largest eigenvalue is greater than 1. We omit the details. 610
For a comparison of the effects of position bias and group-exposure bias 611
we refer to Figure A.7. This figure shows, for various combinations of Pl and
612
Gl, whether for or against is in majority in the mixed equilibrium (under
613
the simplifying assumption that the liberal and conservative subpopulations 614
are of equal size). The axes are log scaled, that is, a constant distance along 615
an axis corresponds to multiplication of the bias with a constant factor. A 616
log scale is the correct scale for comparisons as biases are multiplicative. It 617
is clear from Figure A.7 that the majority position is mainly determined by 618
the position-change bias Pl, whereas the value of Gl has much less influence.
619
In other words, a change in Pl can only be compensated for (if at all) by
a much larger change in Gl. Figure A.7 is drawn for Pc = Gc = 1/2 but
621
looks qualitatively similar for other values of these bias parameters. The 622
intuitive explanation was mentioned in the main text: The position-change 623
bias decreases all swaying in the direction that is atypical for the group, 624
whereas the group-exposure bias applies only to a subset of the swaying in 625
both directions. 626
Bloom, P., 2010. How do morals change? Nature 464 (7288), 490–490. 627
Boyd, R., Richerson, P. J., 1988. Culture and the evolutionary process. Uni-628
versity of Chicago Press. 629
Brewer, P. R., 2002. Framing, value words, and citizens’ explanations of their 630
issue opinions. Political Communication 19 (3), 303–316. 631
Chong, D., 1996. Creating common frames of reference on political issues. In: 632
Mutz, D. C., Sniderman, P. M., Brody, R. A. (Eds.), Political Persuasion 633
and Attitude Change. Ann Arbor: University of Michigan Press, pp. 195– 634
224. 635
Chong, D., Druckman, J. N., 2007. Framing theory. Annual Review of Polit-636
ical Science 10, 103–126. 637
Coleman, J. S., 1994. Foundations of social theory. Harvard University Press. 638
Day, M. V., Fiske, S. T., Downing, E. L., Trail, T. E., 2014. Shifting liberal 639
and conservative attitudes using moral foundations theory. Personality and 640
Social Psychology Bulletin 40 (12), 1559–1573. 641
Eiser, J. R., White, C. J. M., 1974. The persuasiveness of labels: Attitude 642
change produced through definition of the attitude continuum. European 643
Journal of Social Psychology 4 (1), 89–92. 644
Freille, S., Haque, M. E., Kneller, R., 2007. A contribution to the empirics 645
of press freedom and corruption. European Journal of Political Economy 646
23 (4), 838–862. 647
Graham, J., Haidt, J., Nosek, B. A., 2009. Liberals and conservatives rely 648
on different sets of moral foundations. Journal of Personality and Social 649
Psychology 96 (5), 1029–1046. 650
Graham, J., Nosek, B. A., Haidt, J., Iyer, R., Koleva, S., Ditto, P. H., 2011. 651
Mapping the moral domain. Journal of Personality and Social Psychology 652
101 (2), 366–385. 653
Grossmann, M., Hopkins, D. A., 2015. Ideological republicans and group in-654
terest democrats: The asymmetry of american party politics. Perspectives 655
on Politics 13 (01), 119–139. 656
Haidt, J., Graham, J., 2007. When morality opposes justice: Conservatives 657
have moral intuitions that liberals may not recognize. Social Justice Re-658
search 20 (1), 98–116. 659
Haidt, J., Joseph, C., 2004. Intuitive ethics: How innately prepared intuitions 660
generate culturally variable virtues. Daedalus 133 (4), 55–66. 661
Jost, J. T., Glaser, J., Kruglanski, A. W., Sulloway, F. J., 2003. Political 662
conservatism as motivated social cognition. Psychological Bulletin 129 (3), 663
339–375. 664
Keasey, C. B., 1973. Experimentally induced changes in moral opinions and 665
reasoning. Journal of Personality and Social Psychology 26 (1), 30–38. 666
Kesebir, P., Phillips, E., Anson, J., Pyszczynski, T., Motyl, M., 2013. Ideolog-667
ical consistency across the political spectrum: Liberals are more consistent 668
but conservatives become more consistent when coping with existential 669
threat. Available at SSRN 2215306. 670
Koleva, S. P., Graham, J., Iyer, R., Ditto, P. H., Haidt, J., 2012. Tracing the 671
threads: How five moral concerns (especially purity) help explain culture 672
war attitudes. Journal of Research in Personality 46 (2), 184–194. 673
Lindstr¨om, P., 1995. Falsifiability of political opinions. Scandinavian Journal 674
of Psychology 36 (3), 295–305. 675
Lindstr¨om, P., 1997. Retrospective versus prospective explanations of 676
changes in political opinion. Scandinavian Journal of Psychology 38 (2), 677
157–163. 678
Maxwell, B., Narvaez, D., 2013. Moral foundations theory and moral devel-679
opment and education. Journal of Moral Education 42 (3), 271–280. 680
Schelling, T. C., 2006. Micromotives and macrobehavior. WW Norton & 681
Company. 682
Strimling, P., Enquist, M., Eriksson, K., 2009. Repeated learning makes 683
cultural evolution unique. Proceedings of the National Academy of Sciences 684
106 (33), 13870–13874. 685
Van de Vliert, E., 2011. Bullying the media: Cultural and climato-economic 686
readings of press repression versus press freedom. Applied Psychology 687
60 (3), 354–376. 688
Wright, J. C., Baril, G., 2011. The role of cognitive resources in determining 689
our moral intuitions: Are we all liberals at heart? Journal of Experimental 690
Social Psychology 47 (5), 1007–1012. 691
Wright, J. C., Baril, G. L., 2013. Understanding the role of dispositional and 692
situational threat sensitivity in our moral judgments. Journal of Moral 693
Education 42 (3), 383–397. 694
0 0.2 0.4 0.6 0.8 1 0 5 10 15 20 25 30 35 40 45 50
Proportion FOR within each group
Liberals A Conservatives A Liberals B Conservatives B
Figure 1. Simulations A and B have the same parameter values (Gl =
Gc = 1, Pl = Pc = 0.5, Il = Ic = 0.5) but different start values (A :
0 0.2 0.4 0.6 0.8 1 0 5 10 15 20 25 30 35 40 45 50
Proportion FOR within each group
Liberals A Conservatives A Liberals C Conservatives C
Figure 2. Simulations A and C have the same parameter values except the liberal influentiability coefficient is only half as large in C (Il= 0.25, Ic= 0.5)
0 0.2 0.4 0.6 0.8 1 0 5 10 15 20 25 30 35 40 45 50
Proportion FOR within each group
Liberals A Conservatives A Liberals D Conservatives D
Figure 3. Simulations A and D have the same parameter values except the conservative group-exposure bias is twice as strong in D (Gl = 1, Gc = 0.5)
0 0.2 0.4 0.6 0.8 1 0 5 10 15 20 25 30 35 40 45 50
Proportion FOR within each group
Liberals A Conservatives A Liberals E Conservatives E
Figure 4. Simulations A and E have the same parameter values except the liberal position-change bias is twice as strong in E (Pl= 0.25, Pc= 0.5) as in
0 0.2 0.4 0.6 0.8 1 0 5 10 15 20 25 30 35 40 45 50
Proportion FOR within each group
Liberals A Conservatives A Liberals F Conservatives F
Figure 5. Simulations A and F have the same parameter values except both
the conservative group-exposure bias and the liberal position-change bias are twice as strong in F (Gl = 1, Gc= 0.5, Pl = 0.25, Pc= 0.5) as in A.
Figure 6. For fixed Gl = Gc = 1/2, the figure shows the combinations
of values of the parameters Pl and Pc for which the equilibrium is pure or
mixed.
Figure 7. For fixed Pc = Gc = 1/2, the figure shows the combinations
of values of the parameters Pl and Gl for which ( ˆql+ ˆqc)/2 > 1/2 (i.e., the
majority is for in the mixed equilibrium) or (ˆql + ˆqc)/2 < 1/2 (i.e., the