MASTER'S THESIS
Rare Earth Oxide Nanopowder (RE = Nd,
Eu, Gd, Ho, Y, Yb) by Combustion
Synthesis, Sulfation and Calcination
Role of the Initial Structure
Michael Agthe
Master of Science Chemical Engineering
Luleå University of Technology
Abstract
A novel method for synthesising rare earth oxide (RE2O3) nanopowder was applied to several rare earths including Nd, Eu, Gd, Ho, Y and Yb. The process was successful in producing homogeneous, fine dispersed and deagglomerated powder particles with uniform morphology for all rare earth oxides, except neodymia.
In the first process step, rare earth nitrate solutions were mixed with glycine and subse-quently heated in a furnace. Glycine acted as fuel to initiate the combustion synthesis (SHS) in order to obtain nanocrystalline and weakly agglomerated particles. Powder samples were produced at three different glycine-to-nitrate ratios (G/N), involving stoi-chiometric ratio (G/N = 0.56) and two fuel lean ratios (0.32 and 0.25). As a consequence of low combustion temperature at fuel lean ratios were carbonate structures found and their formation was correlated to the size of the rare earth cation. Resulting cellular struc-tures were analysed by X-ray diffractometry (XRD) and transmission electron microscopy (TEM).
The cellular structure is unsuitable to be processed to a final product. The resulting pow-der has a very large specific volume and is comprised of strongly agglomerated crystallites, which renders pressing and sintering of these structures difficult. Therefore an additional synthesis step was employed with the addition of ammonium sulfate and calcination for 4 h in a tube furnace at 1100◦C. In order to understand the influence of the initial, cellular structure on the morphological and microstructural powder properties different sulfate concentrations were used. Samples were characterized by XRD and scanning electron mi-croscopy (SEM). The average crystallite size increased during calcination from below 15 nm in the initial structure to 50 nm in the final product. However, the resulting particles were loosely agglomerated. A benefit of sulfate-doped rare earth compounds under heat treatment is the formation of nearly isotropic surfaces, which might be related to the promotion of surface diffusion and partial inhibition of densifying transport mechanisms such as volume diffusion.
1
Contents
1 Introduction 2
2 Fundamentals 3
2.1 Combustion synthesis . . . 3
2.2 Binary rare earth oxides . . . 5
2.3 Sulfation . . . 8
3 Experimental procedures 9 3.1 Materials and sample preparation . . . 9
3.1.1 Synthesis of the initial structure . . . 9
3.1.2 Sulfation and calcination . . . 10
3.2 Techniques . . . 11
4 Analysis of the initial structure 13 4.1 Observations during and after combustion synthesis . . . 13
4.2 X-ray diffractometry . . . 15
4.2.1 Phase identification . . . 15
4.2.2 Crystallite size calculation . . . 18
4.3 TEM investigations . . . 20
5 Nanoparticles by sulfation and calcination 26 5.1 X-ray diffraction analysis . . . 26
5.2 Morphology of sulfate-ion doped and calcined rare earth oxides . . . 29
6 Conclusions 36
Bibliography 38
List of Figures 41
2
1
Introduction
Physical and chemical properties of materials depend on the way they are processed. Ceramic materials are usually fabricated by powder synthesis, followed by a compaction to a green body, either with simultaneous application of heat or with a later sintering stage to obtain the final product. The materials engineer has to make sure that the desired properties are achieved after sintering. It depends on the powder’s capability to reduce its surface area and thus eliminate pores to form a dense body. A general rule to increase sinterability is to process small, deagglomerated powder particles with large specific surface area and uniform morphology. The improved densification during sintering leads to an enhanced homogeneity of material properties and to a more favourable final product. Therefore it is of crucial importance to have the possibility of controlling size, morphology and agglomeration behaviour of powder particles during powder synthesis. Rare earth containing nanopowders with superior sintering capabilities are produced via several synthesis routes. These include sol-gel [LL07, SCNY08], solvothermal method [HZS+06], hydrothermal method [TBDS07], co-precipitation [KGW06], spray pyrolysis
[HSC01], flame synthesis [KSJ10] and combustion synthesis [BCT07, MMH+08, CST06,
JRJ+10, XYL+08]. Combustion synthesis offers a huge improvement of the processing
time, as compared to conventional precipitation methods. Applications of rare earth compounds are manifold and include high-efficiency lasers, solid oxide fuel cells (SOFC), strong magnets, electric motors and luminescent nanomaterials, so called phosphors. Up to August 2011 there is little information available for rare earth oxides, mainly for yttria and ceria, regarding morphological analysis of the as-synthesised powders and the deagglomeration of primary particles. In order to enhance the latter feature, a new processing step is introduced consisting of sulfation and subsequent calcination of as-synthesised powders.
This thesis is part of a project aiming to produce weakly agglomerated rare earth ox-ide nanoparticles by means of a novel cost and time effective process. Previous studies investigated the combustion synthesis of yttria [MO07]), which has already been synthe-sised successfully by this method. Since rare earth (RE) elements show similar chemical properties as a function of their ionic radii, this study investigates the feasibility to apply the same process to the oxides of Nd, Eu, Gd, Ho and Yb to produce nano-sized powder particles.
3
2
Fundamentals
This chapter shall explain the fundamentals of this project. Principles of combustion synthesis are discussed at first. An introduction to the nature of binary rare earth oxides follows with special attention to phase transformations. The role of sulfation is explained at the end of this chapter.
2.1
Combustion synthesis
Combustion synthesis is a method for obtaining deagglomerated, homogeneous, crystalline and very fine (nano-scaled) powder with a narrow particle size distribution [MKLM08]. Further advantages are its simple handling requirements, reliability, low investment and processing costs and scalability, as compared to conventional ceramic processing, in par-ticular wet-chemical and precipitation methods. In order to initiate the combustion, an appropriate amount of organic fuel has to be mixed with an oxidiser, preferably in an aqueous solution (solution combustion, SC [MED07]). Metal nitrates and glycine are of-ten used, because of low price, availability and low decomposition temperature. Once the mixture is ignited by application of heat through external power sources, the com-bustion is self-sustaining until the fuel is completely consumed and the reaction stops. The quick release of heat during combustion, which takes 2 - 3 seconds, leads to a high synthesis temperature and is accompanied by fast crystal growth. Simultaneously evap-orates a significant amount of gases from the solution. As a consequence is the heat of reaction reduced, which prevents the crystallites from growing extensively. Released gases and directional solidification during propagation of the combustion wave form the typical morphology of elongated grains, which build bridges between pore separated, local accu-mulations of crystallites. High heating and cooling rates result in a foamy structure which is of high purity, high porosity, high defect concentration [YM90] and large surface area [MED07], which can lead to better sintering properties.
The general equation of the reaction of rare earth metal nitrates with glycine can be written as: x · RE(N O3)3 + y · N H2CH2COOH + z · O2 T −−→ x 2 · RE2O3 + 2y · CO2 + 5 2y · H2O + (3x + y) 2 · N2 + f (x, y, z) · residues (2.1)
2.1 Combustion synthesis 4
whereas x and y are variable parameters dependent on desired phase, morphology and microstructure of the product. Parameter z is controlled by the surrounding atmosphere and influences residues of this reaction, e.g. CO, NOxand other organic compounds. The reaction simplifies for stoichiometric combustion. According to the principle of propel-lant chemistry [JAPV81], one can calculate the elemental stoichiometric coefficient φe, which takes into account the oxygen balance of the constituents, by following formula [LBL+03]:
φe=
Σ Coefficient of oxidizing elements in specific formula × valency (−1) Σ Coefficient of reducing elements in specific formula × valency = p
r (2.2)
Reducing and oxidizing valencies of the reactants shall add to zero in order to release the maximum of energy during combustion. Rare earth ions (RE, generally assumed valency +3), carbon (+4) and hydrogen (+1) are considered as reducing elements. Nitrogen (0) is neutral because of complete conversion into molecular nitrogen and oxygen (-2) reacts as the oxidizing element. In this experiment the stoichiometric ratio of the oxidising valencies of the nitrate with respect to the reducing valencies of the fuel is as follows:
φe =
Σ oxidizing valency of the nitrate (−1)Σ reducing valency of the fuel = 1 × 3 + 0 + 9 × (−2)
(−1)[2 × 4 + 5 × 1 + 0 + 2 × (−2)] = 5
3 . (2.3)
In case of stoichiometric combustion the general equation 2.1 is simplified to:
RE(N O3)3 + 5 3 N H2CH2COOH T −−−→ 1 2 RE2O3 + 10 3 CO2 + 25 6 H2O + 7 3 N2 (2.4) As the combustion synthesis consists of glycine (NH2CH2COOH) as fuel and complexing agent and rare earth nitrates (RE(NO3)3) as oxidiser, the glycine-to-nitrate ratio (G/N, also known as fuel-to-oxidiser ratio F/O) gives information about the constitution of the reaction and the availability of oxygen as oxidizing element. The stoichiometric ratio is
G N =
5
9, for there are three nitrate molecules per glycine molecule. A ratio of
G N >
5 9
indicates that the mixture is fuel rich, whereas GN < 59 is called fuel lean and fuel-deficient, respectively. By choosing different ratios one can control phase transformations of rare
2.2 Binary rare earth oxides 5
earth oxides (REO), which lead to a significant influence on the morphology and crystallite size of the powder as stated by [BCT07] and [She10].
2.2
Binary rare earth oxides
Rare earth metals (RE) form a large group of elements, which exhibit similar chemical properties. They consist of 16 and 17 elements, respectively, dependent on the inclusion of scandium. However, it is generally accepted that the term rare earth is applied to yttrium (atomic number: 39) and the 15 lanthanides, from lanthanum (57) to lutetium (71) (table 2.1). One element of the lanthanides (Promethium) has no stable isotope, i.e. it is radioactive and therefore not of particular interest to be synthesised.
A feature of the lanthanides is their decreasing ionic radius with increasing atomic num-ber, the so called lanthanoid contraction effect. It can be explained by looking at their respective electron configuration, at which the 4f orbital is successively filled with electrons from La to Lu with variations in the occupancy of the 5d orbital. While the 4f orbital’s electron density increases, stronger interaction forces between oppositely charged electron shell and nucleus minimise the distance of both. Hence, the ionic radius is decreasing. Also characteristic is the trivalent oxidation state and hence the formation of sesquioxides with the formula RE2O3. Though, for some rare earth elements, oxides with different ion valency can exist (f. ex. Eu2+ and Yb2+) or are even more stable at room temperature than the sesquioxide (CeO2, Tb4O7 and Pr6O11). This can be referred to the stability of the cation, dependent on occupancy of the 4f orbital, which is then either empty, half-filled or full for some rare earth ions. Europium is special, since various oxides are stable at room temperature: EuO (cubic), Eu2O3 (monoclinic and cubic, respectively) and a mixed oxide Eu3O4 (orthorhombic).
The reasons for the inclusion of yttrium to the term rare earth are the formation of a trivalent ion and its ionic radius, which is close to holmium’s (∆rion = 0.1 pm).
Another consequence of the dependency of chemical properties with respect to ionic ra-dius is shown in 2.1. Prometium is not considered here, because of its radioactivity for all isotopes. Furthermore are CeO2, Tb4O7 and Pr6O11 more stable than their corresponding sesquioxide. However, rare earth sesquioxides (RE2O3) crystallise in five different phases (A, B, C, H and X), dependent on temperature and oxygen partial pressure [AKI05]. A-, B- and C-type structures form below ≈ 2000◦C and are stable at room temperature. Above this temperature H-type and X-type structures are formed [AI98]. Light lanthanide oxides, from La2O3 to Nd2O3, crystallise in A-type structure (hexagonal), whereas heav-ier lanthanides, i.e. from Gd2O3 onwards, usually crystallise in C-type structure (cubic). Though, holmia is the first heavy rare earth oxide which does not undergo a transforma-tion until the high temperature phases have been reached, H (hexagonal) and X (cubic), respectively. Rare earth oxides ranging from samaria to dysprosia transform from C-type to B-type structure (monoclinic), which is most prominent for Sm to Gd, because of low transformation temperature. Sesquioxides of Sm and Eu are the most special: Before
2.2 Binary rare earth oxides 6
Table 2.1: Selected properties of rare earths, including effective radii of rare earth ions with oxidation state +3.
Element Electron configuration Oxidation state(s) Effective ionic radius*of RE3+ (pm)
La [Xe] 5d16s2 +3 103 Ce [Xe] 4f15d1 6s2 +4, +3 101 Pr [Xe] 4f36s2 +4, +3 99 Nd [Xe] 4f46s2 +4, +3, +2 98 Pm# [Xe] 4f56s2 +3 97 Sm [Xe] 4f66s2 +3, +2 96 Eu [Xe] 4f76s2 +3, +2 95 Gd [Xe] 4f75d1 6s2 +3 94 Tb [Xe] 4f96s2 +4, +3 92 Dy [Xe] 4f106s2 +4, +3, +2 91 Ho [Xe] 4f116s2 +3 90 Y [Kr] 4d15s2 +3 90 Er [Xe] 4f126s2 +3 89 Tm [Xe] 4f136s2 +3, +2 88 Yb [Xe] 4f146s2 +3, +2 87 Lu [Xe] 4f145d16s2 +3 86 *Data taken from [Sha76] for coordination number CN = 6.
#No stable isotope exists, i.e. prometium is radioactive.
reaching the high temperature phases both oxides transform in the order of increasing temperature from C −→ B −→ A. The B −→ A transition is of second order, i.e. continu-ous, and C −→ A is irreversible, according to [AKI05] and [Mai90], respectively.
Temperatures during combustion synthesis can be either measured by using a pyrome-ter or calculated thermodynamically. The latpyrome-ter method is represented by the so-called adiabatic flame temperature and is expected to reach more than 1200◦C during combus-tion at stoichiometric and fuel-rich combuscombus-tion for all rare earth, according to [BCT07] (Eu2O3 Tad = 1421◦C), [PSPT01] and [LMST08]. It can be deduced from the diagram, that europia is monoclinic and gadolinia undergoes its C → B transformation at the stated temperatures. For fuel lean combustion of Eu2O3 at a G/N-ratio of ≈ 0.33 Be-dekar et al. [BCT07] calculated an adiabatic flame temperature of Tad = 655◦C. Different phases appear, because of formation of organic residues at this temperature , i.e. carbon-ates, hydroxides, oxycarboncarbon-ates, carbohydroxides and carboxyhydroxides, respectively. Though, the temperature achieved by Bedekar et al. seems to be high enough to remove hydroxides.
Turcotte et al. [TSE69], Head and Holley [HHj64] and [HHj65] and Maitra et al. [Mai90] presented data of the decomposition temperatures of rare earth dioxymonocarbonates. RE2O2CO3 show a general trend to form at decreasing decomposition temperatures with decreasing ionic radius of rare earths. A feature of these carbonates is their polymor-phism, similar to the sesquioxides. Transformations are irreversible according to [Mai90] in the order:
2.2 Binary rare earth oxides 7
Figure 2.1: Phase diagram of rare earth sesquioxides (RE2O3) with respect to their ionic radius, adapted from [FT66]. Rare earth oxides analysed in this work are highlighted. For the sake of comparability, yttria was added qualitatively (phase transformation temperature from C → X is ≈ 80◦C higher and its melting
temper-ature is ≈ 25◦C higher as compared to the temperatures shown in this diagram.
I (tetragonal) −→ IA (monoclinic) −→ II (hexagonal)
Phase I and IA might coexist, since IA is described to be a monoclinic distortion of the tetragonal cell [TSE69]. The tetragonal structure of rare earth dioxymonocarbonates was discovered by its similarity to tetragonal Bi2O2CO3. Greaves and Blower [GB88] studied the formation of Bi2O2CO3 and suggested a more complex and larger structure related to an orthorhombic unit cell. However, carbonates of rare earth oxides form layered struc-tures (see fig. 2.2) and decompose at temperastruc-tures as low as 300◦C for Nd and can be stable up to 956◦C for La. Decomposition temperatures and thus stability of carbon-ates depend on the basicity of the corresponding rare earth oxide, as analysed by Maitra [Mai90]. The order of decreasing basicities is proposed as follows:
La > Pr ~ Nd > Sm > Gd ~ Eu > Tb ~ Ho ~ Er > Dy ~ Tm ~ Yb ~ Lu > Ce. Formation of yttrium dioxymonocarbonates was discussed in [MTNY99] and [IMMK05].
2.3 Sulfation 8
Dependent on the chemistry of yttrium carbonate, decomposition temperatures were found to be in the range of 500◦C - 700◦C. This is of particular interest because of expected low reaction temperature of all fuel-deficient combusted powders.
Figure 2.2: Model of the structure of lanthanide, i.e. rare earth, carbonates with chemical formula Ln2O2CO3taken from [AKI05]. Carbonate ions form interlaminar bonds between layers of (LnO)n+n and (Ln2O2)2n+n , respectively.
2.3
Sulfation
The concept of adding sulfate ions before or after combustion synthesis is relatively new. Few articles have been published for example by Ikegami et al. [ILMM02], [ILSH04], Mouzon and Odén [MO07] and more recently Kokuoz et al. [KSK+09]. Their results
have in common, that the effect of sulfation on the morphological appearance of primary particles has yet to be understood. Especially oxysulfur formation on the surface is an interesting aspect to be investigated. All authors agree to the fact, that sulfation inhibits grain growth to an unknown extent until desulfurisation occurs during a heat treatment (calcination and/or sintering). Similar to the formation of carbonates is desulfurisation controlled by the basicity of the corresponding rare earth sesquioxide. With increasing basicity, the desulfurisation temperature of metal sulfates increases [LIMY03].
Grain growth is activated, because of surface diffusion and/or evaporation-condensation processes, if sulfated oxides are heat treated for a prolonged time at high temperatures. On the other hand contribute volume and grain boundary diffusion to densification until surface sulfates decompose. Further benefits of sulfation are related to deagglomeration of primary particles, homogenization of the structure with uniform particle size distribu-tion and spheroidisadistribu-tion of primary particles. The latter causes nearly isotropic surfaces after heat treatment. Though, the amount of sulfation has to be carefully chosen in order to not produce unsinterable powders. However, sulfation seems to promote the synthe-sis of highly appreciable powders for improved sintering and bulk properties with little porosity.
9
3
Experimental procedures
3.1
Materials and sample preparation
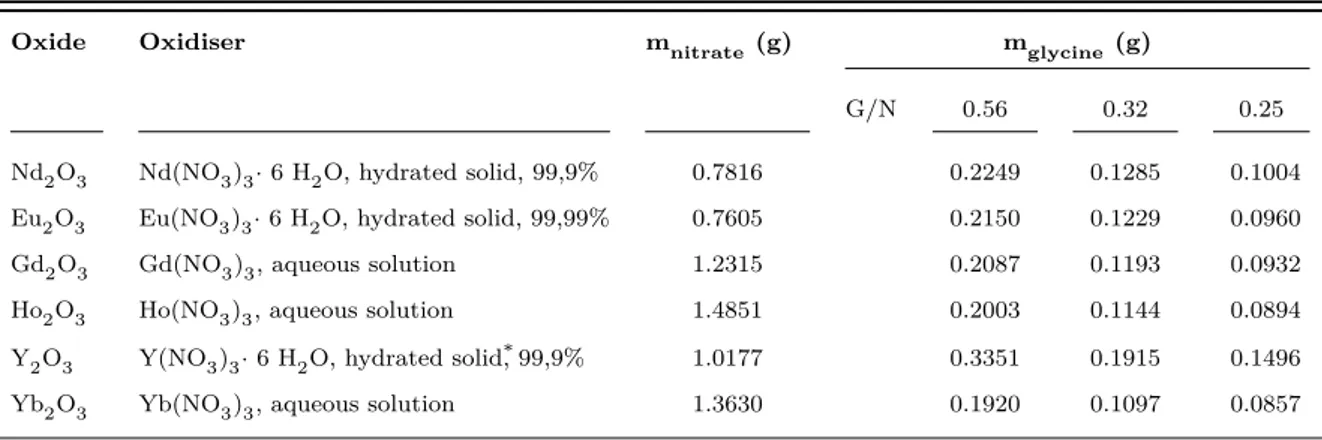
Metal nitrates were used either as hydrated solid or already dissolved in an aqueous solution, shown in table 3.1. Glycine puriss. (Riedel de Häen, Germany) was added for two reasons: as complexing agent and as fuel to ignite the combustion in order to obtain rare earth oxide nanopowders. Since there were no specifications of the rare earth ion concentration of the aqueous metal nitrate solutions available, one gram of the solution was given into an alumina crucible and calcined in a muffle furnace for 4 h at 1100◦C. With the weighed masses of the oxides per gram nitrate solution, it was possible to calculate the required mass of the nitrates to obtain 0.3 g of the final powder.
Table 3.1: Used rare earth nitrates and calculated masses for the synthesis at different glycine-to-nitrate ratios (G/N).
Oxide Oxidiser mnitrate(g) mglycine(g)
G/N 0.56 0.32 0.25 Nd2O3 Nd(NO3)3· 6 H2O, hydrated solid, 99,9% 0.7816 0.2249 0.1285 0.1004 Eu2O3 Eu(NO3)3· 6 H2O, hydrated solid, 99,99% 0.7605 0.2150 0.1229 0.0960 Gd2O3 Gd(NO3)3, aqueous solution 1.2315 0.2087 0.1193 0.0932 Ho2O3 Ho(NO3)3, aqueous solution 1.4851 0.2003 0.1144 0.0894 Y2O3 Y(NO3)3· 6 H2O, hydrated solid*, 99,9% 1.0177 0.3351 0.1915 0.1496
Yb2O3 Yb(NO3)3, aqueous solution 1.3630 0.1920 0.1097 0.0857
*to ensure comparable data to previous studies, yttrium nitrate was mixed with distilled water before stirring
3.1.1 Synthesis of the initial structure
Solution combustion method was used in which the oxidant (rare earth nitrate) was dosed with the respective amount of fuel into a small platinum crucible (table 3.1). Dosed mix-tures containing hydrated solid rare earth nitrates were placed directly into the preheated muffle furnace at 500◦C in air atmosphere. The experimental setup consisted of a stainless steel mesh covering a large platinum crucible, which itself contained the smaller crucible with the mixture shown in figure 3.1a. It is necessary to place a mesh on top of the
3.1 Materials and sample preparation 10
crucible in order to keep the powder flakes in the crucible and not to distribute them in the furnace chamber. However, there is a difference in processing aqueous metal ni-trate solutions. Prior to their combustion, the small platinum crucible was covered with Parafilm M sealing film to prevent the solution from excessive evaporation after dosing. Subsequently,RE2O2CO3 the solution was stirred on a magnetic stirring plate for 30 min-utes to ensure a homogenised solution. The sealing film was taken off and the crucible was placed into the preheated muffle furnace with described setup. Depending on G/N-ratio and oxidant the solutions ignited after 30 to 180 seconds, being visible by an increasing amount of fumes released from the muffle furnace’s exhaust. After further one to two minutes the fumes disappeared and the powder was calcined for 10 minutes to make sure, that the reaction has been completed, i.e. all organic residues were removed. Resulting powder samples were analysed by XRD, SEM and TEM.
(a) (b)
Figure 3.1: Setup of the synthesis: A large platinum crucible containing a smaller one (a) covered by a triple mesh made
of stainless steel (b).
3.1.2 Sulfation and calcination
For sulfation the concentrations of sulfate ions (1, 5, 10 and 50 mole-%) were calculated with respect to the rare earth ion concentration of 0.1 g of the respective powder. The powder was dispersed in aqueous solutions of ammonium sulfate ((NH4)2SO4, 99,95%, Alfa Aesar) followed by drying at 105◦C for at least 2h. After drying, the very fine dispersed, easily lumping powder was homogeneously distributed in an alumina crucible. Subsequent calcination was carried out in a tube furnace (Model Entech ETF 12, Entech Energiteknik AB, Sweden) at 1100◦C for 4 h in an oxygen gas flow of 0.1 l/min. The furnace was heated up at 5◦C/min and cooled down to room temperature at 10◦/min. Samples without additional sulfation were directly placed into the furnace and calcined with mentioned parameters. The flow of excess oxygen gas assists the removal of volatile compounds. Resulting changes in morphology as compared to the initial structure were investigated by SEM. XRD measurements were carried out to calculate the average crystallite size by
3.2 Techniques 11
means of Scherrer’s equation and to understand the influence on phase formation during calcination caused by sulfate addition.
Figure 3.2: Tube furnace Entech ETF 12 with the tube being heated up to 1100◦C. Attached on the right end of the tube
is the oxygen flow inlet.
3.2
Techniques
XRD measurements were carried out on a Siemens D5000 (Siemens, Germany) X-ray diffractometer using Cu Kα radiation with a wavelength of λα1 = 1.5406 ˚A. The analysis
ranged from 5◦ - 70◦ (2θ) with a step size of 0.01◦ and a measuring time of 5 s/step. Back-ground noise and Kα2 superimposition were subtracted from the patterns using an analysis
software for phase identification and crystallite size estimation by XRD line broadening. Quartz was used as an external standard for correction because of instrumental broaden-ing. In order to calculate the mean crystallite size and to give a quick insight into the most relevant region of the pattern, only the main region of interest was scanned by XRD for several samples (2θ for all powders between 27◦ - 34◦).
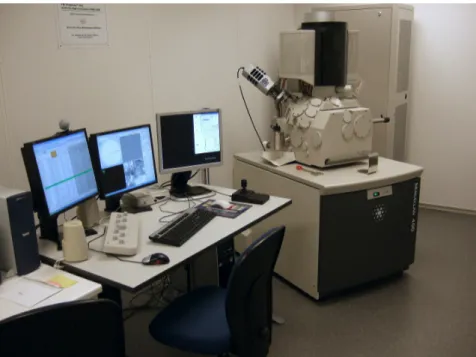
SEM micrographs were observed by means of a FEI Magellan 400 (FEI Company, USA). It is capable of producing extreme high resolution (XHR-SEM) images as fine as 0.9 nm at 1 kV. This low acceleration voltage is needed for this kind of sample to diminish charging effects on the surface, so as to make sputtering unnecessary. Powders with initial structure were dispersed in chloroform and weakly ultrasonicated for five minutes. Calcined powders were also dispersed in chloroform, but a high intensity 130W ultrasonic processor (Model Vibra Cell VCX 130, Sonics & Materials, Inc., USA) helped to disintegrate the powder agglomerates into fine dispersed particles. This powerful technique was used for Ho2O3, Y2O3 and Yb2O3, while Nd2O3, Eu2O3 and Gd2O3 were ultrasonicated by conventional low power method. The intensity of the high-intensity ultrasonic probe ( 3 mm) at an amplitude of 40% was applied for four minutes. A few drops were put on an aluminium stub and dried for five minutes at 53◦C in a drying cupboard. Afterwards, excess powder was blown off and the stub was placed into a plasma cleaner (Harrick, USA) for 10 minutes. Again, excess powder was blown off prior placement of the stub into the SEM analysis chamber.
3.2 Techniques 12
Figure 3.3: Scanning electron microscope FEI Magellan 400
TEM micrographs were recorded on a Philips CM12 operated at 120 kV. This technique enables the possibility of looking through a sample to obtain microstructural and partic-ularly morphological parameters, because of transmission of imaging electrons. Sample preparation as well as imaging were carried out at the ETH Zürich. Images were taken from three regions of interest (ROI) per sample and compared with each other. The most representative ROI was chosen and analysed in detail.
13
4
Analysis of the initial structure
4.1
Observations during and after combustion
syn-thesis
Neodymia solutions showed the most pronounced combustion, if expressed by the amount of fumes and ash generated and powder left in the crucible after synthesis. Europia and gadolinia solutions were combusted less strongly, whereas holmia, yttria and ytterbia showed only faint fumes and no apparent ash. After the combustion of neodymia with a G/N-ratio of 0.56, no powder was left in the small platinum crucible. The reaction was that strong, that a short burst of flames came out of the exhaust and the double mesh was lifted and displaced by a few centimetres. So as to obtain a higher yield of the synthesised powders, the small platinum crucible was put into a larger platinum crucible, which was covered with a self-made triple mesh. With mentioned improvements neodymia yielded ≈ 0.16 g at a G/N-ratio of 0.56, which is still low as compared to a calculated sample mass of 0.3 g after synthesis.
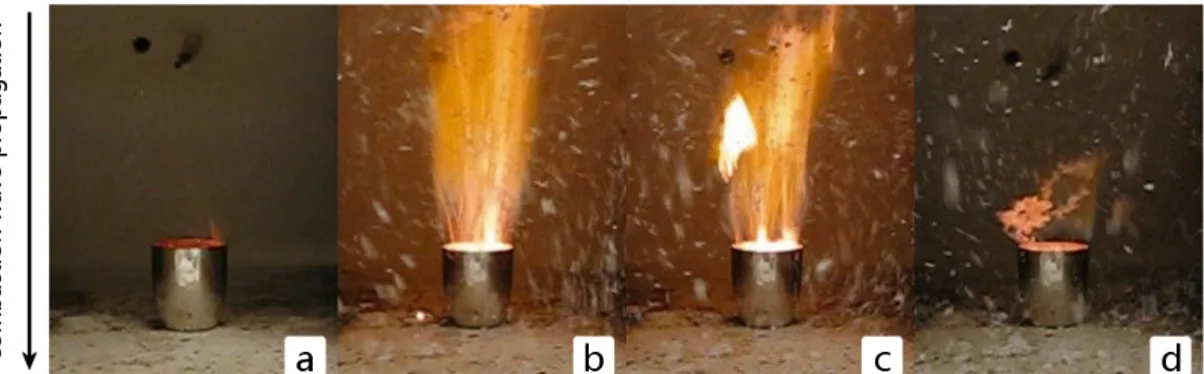
The hereby reported approach of solution combustion is referred to as “thermal explosion” [MAT89]. A spontaneous and self-sustaining reaction takes place at a temperature to which the whole sample solution is heated up. Fig. 4.1 displays an exemplary “thermal explosion” of yttria, which takes a fraction of a second to be propelled after being heated up to 500◦C and lasts for ≈ 2.5 s. In frame c appears a large bright spot of an yttria agglomerate in the flame. It was previously stated, that the combustion of yttria shows only faint fumes and is assumed to be less strong as compared to other powders, but the speed and intensity of the reaction visible in this sequence is remarkably and one can fairly imagine the intensity of neodymia’s combustion.
As indicated in fig. 4.1 the combustion wave propagates in the opposite direction of evolving gases. Fig. 4.2 shows exemplary the influence of the combustion wave propaga-tion and evolupropaga-tion of gases on the morphology and microstructure. The powders solidify directional independent of glycine-to-nitrate ratio. The foamy structure of powder ag-glomerates for both ratios consists of a three dimensional network of pores bordered by primary particles. BET measurements have been carried out by [Leb09] and in a previous project work. Fuel-deficient combusted samples exhibit a seemingly closed porous network on the surface, but the network is open porous visible at fracture surfaces. The latter morphology is also found for stoichiometric combusted samples. Pores and crystallites are
4.1 Observations during and after combustion synthesis 14
Figure 4.1: Photographic sequence taken from a video of the combustion synthesis of yttria. Time difference between first
and last frame is 1.6 s. Frames c and d show large yttria powder agglomerates.
smaller for fuel-deficient ratios as compared to stoichiometric ratio (see fig. 4.5 on page 19 for crystallite sizes). Higher adiabatic flame temperatures and an increased amount of gaseous products during combustion are the reasons for the cellular skeleton obtained at higher G/N-ratio, as mentioned by [She10] and [CLY06]. A common feature of the initial structure of all oxides for stoichiometric ratio is the so-called bamboo-structure [MO07] visible for stoichiometric combustion of ytterbia at high magnification (see mi-crograph on the right side of fig. 4.2b). More detailed description of the morphology and microstructure can be found in section 4.3.
(a) ytterbia after combustion, G/N ratio: 0.25
(b) ytterbia after combustion, G/N ratio: 0.56
Figure 4.2: Visualisation of the influence of combustion wave propagation and G/N-ratio on morphology and
4.2 X-ray diffractometry 15
4.2
X-ray diffractometry
XRD measurements provide information regarding phase, crystal structure, cell parame-ter, strain and texture analysis. In this work, it assists in identifying the present phases and supplies values to determine crystallite sizes. Interesting complications occurred for XRD measurements of holmia produced at a G/N ratio of 0.25. This powder is very dense and even a sample mass of 0.27 g was not enough to carry out an experiment with the standard sample holder used for all other experiments. Therefore, a different sample holder was used, which has no influence on presented results.
In order to keep a comprehensible structure of investigated rare earth oxides, all data are ordered firstly according to the size of ionic radius from large to small, i.e. Nd → Eu → Gd → Ho → Y → Yb. Secondly are individual paragraphs ordered from stoichiometric to most fuel-deficient ratio, i.e. first G/N = 0.56, then 0.32 and 0.25. Identified main crystal structures of all samples, including sulfated/calcined samples and corresponding crystallite sizes can be found in table 5.1 on page 33. The influence of calcination on phase formation is discussed in chapter 5.
4.2.1 Phase identification
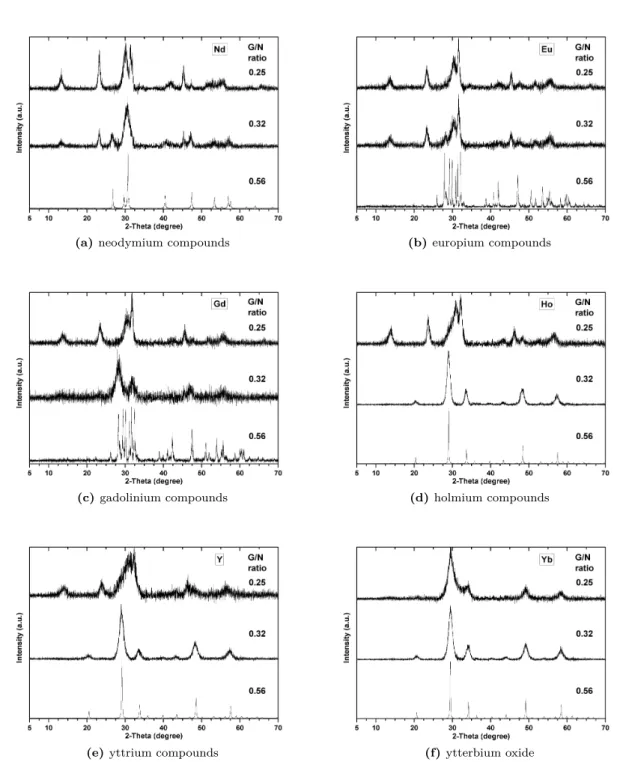
Nd2O3 is the only REO in this work to crystallise in A-type structure (hexagonal, JCPDS card no. 06-0408). Its phase is stable at a G/N of 0.56 (see fig. 4.3a). At 0.32 a mixture of A-type and minimum one carbonate phase can be identified. XRD pattern for the 0.25 sample is consistent with tetragonal and monoclinic carbonate phase (JCPDS card no. 25-0567 and 23-0421, respectively). Since these two phases exist at 0.25 it can be concluded that both also exist at 0.32, because of higher synthesis temperature and therefore greater possibility that a lattice distortion from tetragonal to monoclinic occurs. However, the monoclinic carbonate phase is difficult to identify, being related to its overlapping peaks with either hexagonal A-type structure and tetragonal carbonate phase, respectively. Furthermore it is difficult to identify peaks above 46◦ 2θ, since information from the powder diffraction file (PDF) is limited. Turcotte et al. [TSE69] included patterns of carbonate phases found for praseodymium, which is a light lanthanide with large ionic radius. Simulating a smaller ionic radius of the cation of RE2O3 in a XRD pattern causes a shift to smaller lattice constants (d-spacings) and thus larger diffraction angles. By creating an overlay of Turcotte’s patterns with neodymia patterns one can derive monoclinic structure for diffraction angles larger than 48◦ 2θ.
Eu2O3 exists in two stable phases at a G/N of 0.56, namely B- and C-type (JCPDS card no. 43-1009 for monoclinic and 43-1008 for cubic, respectively). The monoclinic phase is predominant (see fig. 4.3b), whereas cubic Eu2O3 peaks are undoubtedly found at 28.44◦ and 32.95◦ 2θ. Monoclinic Eu2O3 disappears at a G/N of 0.32 caused by insufficient heat to propel its formation during synthesis (see section 2.2 fig. 2.1). Again two peaks related
4.2 X-ray diffractometry 16
to cubic structure are found at 28.44◦ and 47.27◦ 2θ. Cubic europia peaks disappear at
a G/N of 0.25. A crystal structure forms at both fuel lean ratios of 0.32 and 0.25, which cannot be easily identified. The standard pattern for tetragonal Eu2O2CO3 (JCPDS card no. 25-0334) matches all peaks up to 46◦ 2θ (last peak of tetragonal phase is at 45.40◦). But likewise to neodymia, peaks above 46◦ could only be identified by the mentioned overlay procedure. In-depth analysis of XRD-patterns does not support the formation of Eu2+ related structures.
Gd2O3 shows a similar XRD pattern as compared to europia at a G/N of 0.56 (fig. 4.3c). Two phases, B- and C-type, are present, whereas monoclinic structure is predominant (JCPDS card no. 1015). Peaks related to cubic structure (JCPDS card no. 43-1014) are found at diffraction angles of 28.57◦, 33.11◦ and 56.41◦ 2θ. C-type structure is predominant at a G/N of 0.32 and superimposes partly with low intensity peaks of tetragonal Gd2O2CO3 (JCPDS card no. 25-0339). Monoclinic Gd2O3 disappears for both fuel-deficient ratios, which is in well agreement to expected low combustion temperatures and B → C transformation occurring for gadolinia (see fig. 2.1 on page 7). At a G/N ratio of 0.25, the diffraction peak at 31.8◦ 2θ cannot be identified by proposed JCPDS standard pattern of Gd2O2CO3, which quality mark is “questionable”. A comparison between the patterns of gadolinia and europia suggests, that the peak must belong to tetragonal Gd2O2CO3. Information obtained from the Powder Diffraction File is again limited.
Ho2O3 solidifies in C-type structure (JCPDS card no. 43-1018) during combustion syn-thesis of G/N ratios equal to 0.56 and 0.32 (fig. 4.3d). Peaks become broader at 0.32, because of an increasing number of varying lattice planes spacings in the pm range, as com-pared to the lattice spacing at peak intensity (see subsection 4.2.2). Hexagonal Ho2O2CO3 is the only pattern included in the standard pattern database related to holmium dioxy-monocarbonates, but does not fit any measured peaks. Because of chemical similarity due to the lanthanoid contraction, it is assumed, that the similarity to the diffraction patterns of other tetragonal structures of the formula RE2O2CO3 and the overlay with Turcotte’s patterns is sufficient to relate the XRD pattern of synthesised 0.25 sample to tetragonal Ho2O2CO3, with no signs of the existence of a cubic phase.
Y2O3 crystallises in C-type cubic structure (JCPDS card no. 43-1036) at ratios 0.56 and 0.32 (fig. 4.3e). In agreement to the similarity to holmia in ionic radius causing similar chemical characteristics, it is equally assumed, that a tetragonal carbonate structure exists at a fuel lean ratio of 0.25. Though, the PDF include no information about yttrium carbonate.
Yb2O3 crystallises cubic (JCPDS card no. 43-1037) at all glycine-to-nitrate ratios (fig. 4.3f). Ytterbia was subsequently synthesised at lower glycine-to-nitrate ratios than 0.25, which revealed a remarkable effect. Ytterbia crystallises cubic, even at a G/N ratio as
4.2 X-ray diffractometry 17
low as 0.10. Suspected carbonate structure with weak peaks below 25◦ 2θ is revealed
at a G/N ratio of 0.20. Clearly identifiable is this carbonate structure if compared to tetragonal carbonate patterns of other rare earths (see fig. 4.4).
(a) neodymium compounds (b) europium compounds
(c) gadolinium compounds (d) holmium compounds
(e) yttrium compounds (f) ytterbium oxide
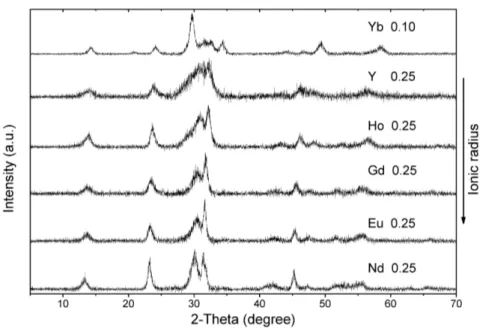
Figure 4.3: XRD patterns of synthesised powders produced at different glycine-to-nitrate ratios.
All analysed rare earths crystallise in a similar pattern at low G/N ratios, proposed to be tetragonal and occasionally monoclinic RE2O2CO3. The tendency to form carbon-ate containing species decreases with decreasing size of the rare earth ion, which is in agreement to the role of basicity found out by Maitra [Mai90]. Since basicity and decom-position temperature are related to each other, data of the decomdecom-position temperatures of RE2O2CO3 by Turcotte and Head and Holley have shown that thermal stability of rare earth dioxymonocarbonates decreases with increasing atomic number. Lower
tempera-4.2 X-ray diffractometry 18
Figure 4.4: Comparison of lowest synthesised glycine-to-nitrate ratio of rare earth compounds reveals similar XRD
pat-terns, suggested to be tetragonal and occasionally monoclinic rare earth dioxymonocarbonate. Because of a difference in ionic size of rare earths accompanied with the contraction of the lattice, the diffraction angle increases for structure-related similar peaks from Nd to Yb.
tures for combustion at low G/N ratios supports the formation of carbonates, for which the reaction temperature is not high enough to be decomposed into sesquioxides. Because of the trend, that neodymia showed the most and ytterbia the least pronounced carbon-ate patterns, it seems most likely that the observed strong combustion of neodymia is not related to the exceptional generation of gases. Moreover, a higher atomic number leads to a larger amount of released gases and lower amount of ash. Gaseous products producing elements, in general carbon and hydrogen, are bonded to oxidised rare earths to form complex structures, for example carbonates and hydroxides. It explains the significant amount of released ash and the low sample mass obtained after combustion synthesis especially for neodymia and to a certain extent for europia.
4.2.2 Crystallite size calculation
During interaction of an incident beam of high energetic X-rays with a crystalline sample, diffraction takes place at distinct angles 2θ. Scattered waves are photons, which number depends on the amount of equally indexed lattice planes of one or more crystals. Photons interact with the measuring system of the counter and detector, respectively, which signal is interpretable by converting it to electrical pulses and can then be evaluated by various software packages. The crystallite size corresponds to the broadening of measured peaks, whereas broader peaks signalise a smaller average crystallite size. If the amount of equally indexed lattice planes with same lattice spacing dlat increases, the peak gains a higher intensity and becomes narrower at corresponding diffraction angle 2θ, i.e. the crystals are larger. Statistically distributed small crystallites show a significant broadening in XRD patterns accompanied with lower peak intensity, because of the fact, that a multitude
4.2 X-ray diffractometry 19
of slightly differing lattice constants similar (in the sub pm range) to the lattice plane spacing at peak intensity occur. Mean crystallite sizes (dcrystal) are calculated from x-ray line broadening, using Scherrer’s equation:
dcrystal =
K · λ
B · cosθ, (4.1)
whereas K is a constant (in this case 0.94) dependent on applied method of calculation (either integral breadth or full width at half maximum), λ as radiation wavelength, cos θ the diffraction angle and B the peak broadening. The latter consists of a sum of strain and crystallite size broadening, which is equal to the difference of line broadening of the observed peak and instrumental broadening. Warren (4.2) delivered a formula to calculate the broadening effect:
B = qB2
obs · Binst2 . (4.2)
With both formulas one can obtain an average value of a sample’s crystallite size distri-bution.
Figure 4.5: Crystallite sizes of as-synthesised powders calculated by X-ray line broadening.
Processes of crystal growth are generally expressed as a function of temperature. Crystals need to reduce their specific surface energy in order to grow, which is mainly caused by a reduction of a material’s concentration gradient concomitant with diffusion of atoms, a thermally activated process. A higher processing temperature leads to larger driving forces and hence promotes crystal growth. Figure 4.5 illustrates, that powders produced with fuel-deficient ratios possesses very small crystallites between 5 - 15 nm. It is related to the provided energy for crystal growth by “thermal explosion”, which is less than the energy provided for cooling, because of the release of gaseous products. An increase in heat generation causes crystals to grow rapidly for combustion at stoichiometric ratios. There is no indication, that phase formation controls the average crystallite sizes. It is solely dependent on glycine-to-nitrate ratio, i.e. the temperature of the combustion, which also depends on the enthalpy of formation of the corresponding rare earth nitrate.
4.3 TEM investigations 20
4.3
TEM investigations
Transmission and scanning electron microscopes are two major instruments in modern sci-ence and industry to characterise the microstructure and analyse morphological details of materials. SEM investigations in previous project works revealed different microstructures and morphologies for combustion synthesis of rare earth compounds at various glycine-to-nitrate ratios. As-synthesised powders are aggregates featuring a three dimensional, highly porous network with fractal morphology [FPBS00]. All powders consist of ag-glomerates of primary particles, which form a chain of nanocrystals acting as walls or junctions between adjacent pores. Porosity itself is found to be dependent on rare earth and G/N ratio. Primary particles are clearly visible for all powders after stoichiometric combustion, which itself leads to pronounced crystal growth with rectangular and some-times cubic shaped crystals. Fuel-deficient combusted powders show a plate-like structure which is in agreement to proposed layered structure of rare earth dioxymonocarbonates (Re2O2CO3).
The following section compares transmission electron micrographs of six rare earths with respect to various glycine-to-nitrate ratios (0.25, 0.32 and 0.56). Table 4.1 illustrates several interesting features:
• qualitative Cell size
• uniformity and qualitative information about crystal size distribution and phase identification obtained from Selected area diffraction (SAD) patterns
• microstructure at high-resolution.
One factor which may have an influence on the powder morphology and crystallite size after calcination is the available space between walls (dark, usually straight strips in the micrographs of the column “cell size”). At the surface of the cell, sulfate ions can adsorb or be absorbed during mixing of ammonium sulfate with the respective powder. Though it has to be said, that absorption is questionable because of the size of sulfate ions. Moreover, smaller cell size should promote densification during calcination, while larger cells might leave large pores, reducing the powder’s density. This depends on the prevailing transport mechanisms during calcination in association with a sulfated surface and is going to be investigated in chapter 5.
Cell sizes reach up to a few hundred nanometres and are largest for gadolinium dioxy-monocarbonate. All carbonate phases of investigated rare earths (Nd, Eu, Gd, Ho, and Y) show larger cells and straight cell walls as compared to cubic structure of ytterbia. This only non-carbonate structure synthesised at G/N = 0.25 consists of distinguishable cells and curved cell walls. Because of transmitting electrons several layers of material are visible for rare earth carbonates. These layers interfere with each other, which makes it difficult to interpret micrographs qualitatively. On the other hand is the field of view of high-resolution images to small to detect and measure large cells, but higher magni-fication gives an insight into structural alignments of atoms visible by Moiré patterns.
4.3 TEM investigations 21
Pronounced patterns are found for Nd and Eu. For the latter are cell walls resolved, which show considerable diffraction fringes. Since the adjacent material to a cell wall is equally in focus and does not show fringes, cell walls consist of highly ordered structures, i.e. a layer of equally oriented lattice planes. Cell walls are dark because electrons cannot transmit through them. This depends on the material’s thickness, its composition and the energy of the electron beam.
Table 4.1: TEM micrographs of rare earth oxides and carbonates, respectively, synthesised at a glycine-to-nitrate ratio of
0.25. Rare earth are ordered with respect to decreasing ionic radius. Columns are designated in terms of analytical feature.
Phase Cell size Selected area diffraction High-resolution G/N = 0.25 Nd2O2CO3 Eu2O2CO3 Gd2O2CO3 Ho2O2CO3 Y2O2CO3 Yb2O3, cubic
Another feature of transmission electron microscopy is the possibility of selecting a specific area of the analysed material and record its diffraction pattern. Selected Area Diffraction (SAD) helps to index patterns, if a single crystal is measured, calculate the crystal size from the width of the Debye rings, analyse the crystallinity (single crystalline, poly
crys-4.3 TEM investigations 22
talline or textured material) and to correlate a microstructure to a certain phase of the compound in combination with XRD.
SAD patterns in table 4.1 are consistent with XRD results of 0.25 samples. Debye rings are qualitatively at the same position as their corresponding peaks in the XRD patterns. SAD images show mostly broad, but distinctive Debye rings, which is typical for a nano-sized polycrystalline material. A multitude of crystals with varying lattice plane constant account for ring formation. Dark areas in the pattern illustrate non-contributing diffrac-tion angles, while bright spots and rings represent a diffracdiffrac-tion angle for which a number of crystals with same and similar lattice plane spacing exist, respectively. Phases found by XRD are related to structures visible by TEM. The displayed pattern of europium dioxy-monocarbonate indicates a barely polycrystalline structure. It is because of diffraction at a single layer of the compound at high magnification, at which few crystals add to the diffraction pattern. Other ROI of Eu2O2CO3 show more characteristic ring systems. The cubic crystal structure is highly symmetrical and thus produces less variation in lattice spacing as compared to various carbonate structures of one compound. Hence, the SAD pattern of cubic Yb2O3 is the most homogeneous and consists of continuous rings with few bright spots.
Likewise to ytterbia’s 0.25 sample, exhibit all 0.32 samples of investigated rare earths distinctive ring patterns (see table 4.2). The rings of SAD images are discontinuous, i.e. contain more regions with dark areas and bright spots, respectively. Lines become narrower, which is usually attributed to larger crystallite sizes. But XRD measurements cannot confirm the latter statement. In fact, there is no apparent trend for the decrease or increase in crystallite size of rare earths, if samples of a G/N ratio of 0.25 are compared with 0.32 samples.
XRD measurements record the diffraction intensity of all present structures of the powder at a given range of 2θ. SAD, by contrast, possesses the important feature to distinguish be-tween certain structures and quickly obtain diffraction patterns with information acquired from all possible Bragg angles. Using this technique, differences in cell sizes are clearly visible by comparing carbonate with its corresponding sesquioxide structure of each rare earth. Cells are considerably smaller for sesquioxides of 0.32 samples and mostly below 100nm in diameter. Carbonate structures of Nd and Eu do not differ significantly with respect to cell sizes of 0.25 and 0.32 samples. Gd2O2CO3 cell size decreases substantially from 0.25 to 0.32 and might be related to the increase in combustion temperature close to the carbonate decomposition temperature. This assumption is supported by the XRD pattern of gadolinia in figure 4.3c, for which the existence of a carbonate phase cannot be conclusively proven. In this case is the carbonate structure nearly transformed into Gd2O3.
More fringes show up at high magnification as compared to 0.25 samples, which indicates an increase in atomic ordering. Grains are visible especially for holmia, yttria and ytterbia. For these three oxides suggest a low decomposition temperatures of rare earth carbonates a restructuring of atoms accompanied by densification and marginal crystal growth during combustion with higher fuel content.
4.3 TEM investigations 23
Table 4.2: TEM micrographs of rare earth oxides and carbonates, respectively, synthesised at a glycine-to-nitrate ratio of
0.32. Rare earth are ordered with respect to decreasing ionic radius. Columns are designated in terms of analytical feature.
Phase Cell size Selected area diffraction High-resolution G/N = 0.32 Nd2O2CO3 Nd2O3, hexagonal Eu2O2CO3 Eu2O3, cubic Gd2O2CO3 Gd2O3, cubic Ho2O3, cubic Y2O3, cubic Yb2O3, cubic
4.3 TEM investigations 24
Powders, which are synthesised at a glycine-to-nitrate ratio of 0.56, show extensive crystal growth (see table 4.3), as has been found out by XRD in section 4.2. In general consist SAD patterns of a multitude of bright spots for all rare earths, which is caused by single crystal diffraction of large crystals (see table 4.3).
Debye rings decrease in visibility for the prevailing sesquioxide structure of Nd, Eu and Gd and disappear completely for Ho, Y and Yb. As known from XRD crystallise eu-ropia and gadolinia in a two phase region, where cubic and monoclinic structures coexist. Though, powder aggregates of cubic gadolinia are not found, a minimum of three different morphologies exist for europia. Two of them are linked to cubic structure. The morphol-ogy of cubic europia marked by [2] in table 4.3 differs in crystal size from monoclinic morphology, whereas smaller crystals are found for the cubic phase. Morphology marked by [1] seems to have crystallised in an intermediate state between G/N ratios 0.32 and 0.56. Resembling structures were identified by SEM analysis in a previous project work. Their formation is attributed to inhomogeneities of heat distribution during combustion synthesis in association with europium’s uncommon chemistry.
Structures of gadolinia, holmia, yttria and ytterbia consist of chains or aggregates of primary particles, which form open networks of relatively large pores as compared to cell sizes of fuel lean combusted powders. Closed cells inside the material are found for cubic europia and neodymia. The cell size differs significantly for europia synthesised at a G/N of 0.56. High resolution images reveal pores in single crystals, which have an influence on transport mechanisms and densification during calcination.
4.3 TEM investigations 25
Table 4.3: TEM micrographs of rare earth sesquioxides synthesised at a glycine-to-nitrate ratio of 0.56. Rare earth are
ordered with respect to decreasing ionic radius from Nd (largest) to Yb (smallest). Columns are designated in terms of analytical feature.
Phase Cell size Selected area diffraction High-resolution G/N = 0.56 Nd2O3, hexagonal Eu2O3, cubic [1] Eu2O3, cubic [2] Eu2O3, monoclinic Gd2O3, monoclinic* Ho2O3, cubic Y2O3, cubic Yb2O3, cubic
26
5
Nanoparticles by sulfation and
cal-cination
The initial structure is unsuitable for further processing, because of its large agglom-erates and pores, which form a complex network. Furthermore are primary particles excessively large (G/N 0.56) and strongly aggregated (G/N 0.32), which cause difficulties during pressing to a green body. Powders with lower G/N, e.g. 0.25, crystallise in a layered structure of rare earth dioxymonocarbonate. Despite their low crystallite size, their plate-like structure is prone to considerable density variations during pressing and sintering, which causes inhomogeneous shrinkage of the green body and thus leads to an unfavourable final product.
A solution is suggested by adding sulfate and a subsequent calcination step at elevated temperatures. Sulfate ions adsorb on all surfaces, also inside cells, and support a separa-tion of primary particles. Sulfasepara-tion decreases the speed of densificasepara-tion processes during calcination, but also promotes grain growth by surface diffusion. Regions between parti-cles are formed resembling a neck while crystals grow. This neck (f. ex. in fig. 5.1) is either consumed by material transport mechanisms or acts as a starting point for grain growth caused by surface diffusion. If the former occurs, particles separate from each other. Therefore is the cell size of interest regarding its possible influence on crystallite size, morphology, especially of the surface, and collapse of the foamy structure.
A comprehensive summary of acquired data is found at the end of this chapter in table 5.1.
5.1
X-ray diffraction analysis
As can be seen in figure 5.2 on page 28 reduces the addition of ammonium sulfate the crystallite size as compared to undoped samples. Smallest crystallite sizes are achieved for fuel-deficient combusted samples with a sulfate concentration below 10 mole-%. It is confirmed that a general trend of smaller crystallite size exists by decreasing the ionic radius of rare earth. Primary particle size averages between 40 to 80 nm. Another trend is set by the formation of sulfate compounds visible in XRD patterns, which decreases with decreasing sulfate addition and decreasing ionic radius. This fact is in agreement to
5.1 X-ray diffraction analysis 27
(a) (b)
Figure 5.1: Neck formation during calcination in (a), which leads to particle separation after high intensity ultrasonication
in (b).
[LIMY03], who found out, that the desulfurisation temperature increases with increasing basicity. Basicity is generally a function of ionic radius and increases with increasing ion size. Following paragraphs discuss grain sizes and phases of the respective powder in detail.
Neodymia consists of hexagonal structure at all G/N ratios. With increasing dopant concentration (> 1 mole-% SO4) sulfate compounds are detectable by XRD. Sulfates are the only species, which are identifiable for doping with 50 mole-% SO4. Nd2O3 powder could not be calcined with a crystallite size below 100 nm at a calcination temperature of 1100◦C. Grains are present, which are larger than 800 nm in one direction. Further experiments at 1000◦C calcination temperature showed no change in crystallite size and sulfurisation. The former effect is attributed to densification, because of volume and grain boundary diffusion, while the latter indicates a high decomposition temperature for sulfate species above 1100◦C. At 900◦C and 1 mole-% dopant addition is the synthesis successful in terms of collapsing structure, no visible sulfate peaks in the XRD pattern and a mean crystallite size below 50 nm. Interestingly contains the XRD pattern of neodymia 0.25 calcined at 900◦C with 1 mole-% SO4 peaks, which are entirely matching the standard pattern of cubic Nd6O11. Further investigations have to be carried out in order to understand this phenomenon.
Europia is calcined at its transition temperature between cubic and monoclinic phase. The latter is prevailing for stoichiometric combusted samples and also exists for fuel lean combusted samples with high dopant concentrations. Hence, sulfate ions stabilise and promote crystallisation of a high temperature phase. Cubic phase is maintained throughout the three G/N ratios, as well as for all dopant additions. Sulfate species are found for any sample containing more than 10 mole-% SO42 –. Similar to neodymia, one experiment was carried out to obtain a decrease in crystallite size. Europia doped with 5 mole-% SO42 – and calcined at 1000◦C averages 33 nm in crystallite size, but peaks of orthorhombic Eu2O2SO4show up. A change of synthesis parameters is suggested in future
5.1 X-ray diffraction analysis 28
(a) neodymium compounds (b) europium compounds
(c) gadolinium compounds (d) holmium oxide
(e) yttrium oxide (f) ytterbium oxide
Figure 5.2: Calculated XRD crystallite sizes after calcination for sulfated and unsulfated samples synthesised at different
fuel-to-oxidiser ratios (G/N). The term compound is used to signify the existence of several phases for the corresponding rare earth. For example consists the neodymium compound with 50 mole-% dopant concentration of various sulfate species. On the other hand are holmium, yttrium and ytterbium oxides only cubic, irrespective of dopant concentration.
5.2 Morphology of sulfate-ion doped and calcined rare earth oxides 29
work. Fine adjustments are possible with either lower dopant concentration between 1 to 5 mole-%, calcination temperatures between 1000 to 1100◦C or a longer dwell time, in order to decompose any sulfate species for europia.
Gadolinia’s XRD patterns also reveal an influence on phase transformation during calcination caused by sulfation. All samples combusted at a G/N of 0.56 and fuel lean combusted powders with a dopant concentration higher than 10 mole-% SO4contain peaks related to monoclinic Gd2O3. Though, the powder is calcined entirely in the cubic phase field according to figure 2.1 on page 7. All other calcined samples show cubic phase only. The effect of sulfation on high temperature phase stabilisation is therefore established for europia and gadolinia. Average crystallite sizes measure 60 to 70 nm for 0.32 and 0.25 samples with SO4 concentrations lower than 10 mole-%.
Holmia, yttria and ytterbia exist in cubic phase at all G/N ratios and dopant con-centrations after calcination. No other phase is present in the XRD patterns. Crystallites average 50 to 60 nm in size for 0.32 and 0.25 samples with dopant concentrations of less than 10 mole-%.
5.2
Morphology of sulfate-ion doped and calcined
rare earth oxides
Stoichiometric combusted powders and calcined with and without any sulfate addition are unsuitable to be processed any further, because of their relatively large starting grain size (fig. 4.5) and unfavourable morphology as can be seen exemplary for ytterbia’s sample at a G/N of 0.56 in figure 5.3. Powder aggregates collapsed, but primary particles are either too large, their shape is irregular or the surface is significantly sulfated with an addition of more than 5 to 10 mole-% SO42 –. Following results are based upon analysis of fuel-deficient combusted powders with special focus on samples with 5 mole-% dopant concentration, which possess best properties.
(a) (b)
Figure 5.3: Unsuitable powder for further processing synthesised at stoichiometric G/N ratio. Figure (a) shows partial
collapse of the initial structure, which is an appreciated process. But at higher magnification in (b) are irregular morphology, multi-modal particle size distribution and strongly sulfated grains visible, which are undesirable for powder synthesis.
5.2 Morphology of sulfate-ion doped and calcined rare earth oxides 30
(a) Nd2O3 (b) Eu2O3 (c) Gd2O3
(d) Ho2O3 (e) Y2O3 (f) Yb2O3
Figure 5.4: Low magnification micrographs of 0.25 samples showing the collapse of the initial structure for all rare earths.
Dopant concentration is 5 mole-%.
(a) Nd2O3 (b) Eu2O3 (c) Gd2O3
(d) Ho2O3 (e) Y2O3 (f) Yb2O3
Figure 5.5: Low magnification micrographs of 0.32 samples showing the collapse of the initial structure. Dopant
concen-tration is 5 mole-%.
Figures 5.4 and 5.5 show the morphology at low magnifications of sulfated, calcined (1100◦C) and ultrasonicated powder for 0.25 and 0.32 samples, respectively. Except from
5.2 Morphology of sulfate-ion doped and calcined rare earth oxides 31
ytterbia 0.32, are all initial structures collapsing, i.e. the calcined powder is not resem-bling the initial structure. It seems, that the chemical stability of cubic ytterbia partially inhibits a collapse of primary particle aggregates. Powders particles with small cation (Ho3+, Y3+ and Yb3+) are homogeneously distributed, which is a benefit of high inten-sity ultrasonication. Agglomerates of powders with large cation are widespread, because of conventional low power ultrasonication.
Figures 5.6 and 5.7 show typical morphologies of primary particles of rare earth oxide precursor powders under high magnification. Spheroidisation occurs with the addition of sulfate ions for all rare earth sesquioxides. The extent of present spherical surfaces in-creases with decreasing cation size, which is consistent with results obtained by Li et. al. [LIMW01]. Dispersion of primary particles increases with decreasing ionic radius. Parti-cle size ranges from 15 to 120 nm for both fuel lean ratios of gadolinia, holmia, yttria and ytterbia. Primary particles of europia reach sizes up to 220 nm. Elongated grain shapes with low aspect ratio and secondary growth patterns are found for neodymia. Grains with various morphologies are present and reach more than 800 nm in size. Sulfated neodymia powders are also prone to excessive surface sulfation, that indicates a high diffusivity of the material. Mass transportation by surface diffusion and/or evaporation-condensation processes play an important role on grain growth, which activity is decreasing with de-creasing cation size.
In general shows the suggested morphological feature “cell size” no conclusive evidence to have an influence on sulfated powder properties.
5.2 Morphology of sulfate-ion doped and calcined rare earth oxides 32
(a) Nd2O3 (b) Eu2O3 (c) Gd2O3
(d) Ho2O3 (e) Y2O3 (f) Yb2O3
Figure 5.6: High resolution SEM micrographs of primary powder particles synthesised at low fuel-to-oxidiser ratio of 0.25.
Dopant concentration is 5 mole-%.
(a) Nd2O3 (b) Eu2O3 (c) Gd2O3
(d) Ho2O3 (e) Y2O3 (f) Yb2O3
Figure 5.7: High resolution SEM micrographs of primary powder particles synthesised at a G/N of 0.32. Dopant
5.2 Morphology of sulfate-ion doped and calcined rare earth oxides 33
Table 5.1: Summary of collected data of rare earth compounds, which are ordered with respect to decreasing ionic
ra-dius. SO4 indicates the presence of sulfate related compounds and CO3 the presence of a carbonate phase. Calcination (calc.) was carried out in a tube furnace at 1100◦C in an oxygen gas flow of 0.1 l/min.
Rare earth oxide G/N ratio Sample treatment Phases by XRD Mean crystallite size (nm)
Nd2O3
0.56
none, initial structure A 43 calcined A 275 5 mole-% SO4+ calc. A + SO4 143 50 mole-% SO4 + calc. SO4
-0.32
none, initial structure A + CO3 5 calcined A 182 1 mole-% SO4+ calc. A 216 5 mole-% SO4+ calc. A + SO4 197 10 mole-% SO4 + calc. A + SO4 190 50 mole-% SO4 + calc. SO4 -0.25
none, initial structure CO3 7 calcined A 165 1 mole-% SO4+ calc. A 182 5 mole-% SO4+ calc. A + SO4 104 10 mole-% SO4 + calc. A + SO4 182 50 mole-% SO4 + calc. SO4 -Eu2O3 0.56
none, initial structure B + C 56 calcined B + C 144 5 mole-% SO4+ calc. B + C 140 50 mole-% SO4 + calc. B + C + SO4 207
0.32
none, initial structure C + CO3 5 calcined C 240 1 mole-% SO4+ calc. C 78 5 mole-% SO4+ calc. C 82 10 mole-% SO4 + calc. B + C + SO4 72 50 mole-% SO4 + calc. B + C + SO4 142 0.25
none, initial structure CO3 5 calcined C 154 1 mole-% SO4+ calc. C 78 5 mole-% SO4+ calc. C 72 10 mole-% SO4 + calc. C + SO4 75 50 mole-% SO4 + calc. B + C + SO4 205 Gd2O3 0.56
none, initial structure B + C 41 calcined B + C 106 1 mole-% SO4+ calc. B + C 100 5 mole-% SO4+ calc. B + C 116 10 mole-% SO4 + calc. B + C 97 50 mole-% SO4 + calc. B + C + SO4 151 0.32
none, initial structure C + CO3 11 calcined C 124 1 mole-% SO4+ calc. C 66 5 mole-% SO4+ calc. C 62 10 mole-% SO4 + calc. B + C 66 50 mole-% SO4 + calc. B + C + SO4 130
5.2 Morphology of sulfate-ion doped and calcined rare earth oxides 34
Rare earth oxide G/N ratio Sample treatment Phases by XRD Mean crystallite size (nm)
Gd2O3 0.25
none, initial structure CO3 15 calcined C 102 1 mole-% SO4+ calc. C 59 5 mole-% SO4+ calc. C 66 10 mole-% SO4 + calc. C 69 50 mole-% SO4 + calc. B + C + SO4 115 Ho2O3 0.56
none, initial structure C 52 calcined C 72 5 mole-% SO4+ calc. C 69 50 mole-% SO4 + calc. C 91
0.32
none, initial structure C 8 calcined C 59 1 mole-% SO4+ calc. C 55 5 mole-% SO4+ calc. C 58 10 mole-% SO4 + calc. C 54 50 mole-% SO4 + calc. C 83 0.25
none, initial structure CO3 5 calcined C 63 1 mole-% SO4+ calc. C 66 5 mole-% SO4+ calc. C 61 10 mole-% SO4 + calc. C 64 50 mole-% SO4 + calc. C 127 Y2O3 0.56
none, initial structure C 35 calcined C 54 1 mole-% SO4+ calc. C 51 5 mole-% SO4+ calc. C 62 10 mole-% SO4 + calc. C 64 50 mole-% SO4 + calc. C 95 0.32
none, initial structure C 6 calcined C 73 1 mole-% SO4+ calc. C 55 5 mole-% SO4+ calc. C 51 10 mole-% SO4 + calc. C 50 50 mole-% SO4 + calc. C 96 0.25
none, initial structure CO3 6 calcined C 74 1 mole-% SO4+ calc. C 53 5 mole-% SO4+ calc. C 51 10 mole-% SO4 + calc. C 53 50 mole-% SO4 + calc. C 99 Yb2O3 0.56
none, initial structure C 47 calcined C 66 5 mole-% SO4+ calc. C 76 50 mole-% SO4 + calc. C 70

![Figure 2.1: Phase diagram of rare earth sesquioxides (RE 2 O 3 ) with respect to their ionic radius, adapted from [FT66].](https://thumb-eu.123doks.com/thumbv2/5dokorg/4955697.136257/9.893.221.670.150.724/figure-phase-diagram-earth-sesquioxides-respect-radius-adapted.webp)
![Figure 2.2: Model of the structure of lanthanide, i.e. rare earth, carbonates with chemical formula Ln 2 O 2 CO 3 taken from [AKI05]](https://thumb-eu.123doks.com/thumbv2/5dokorg/4955697.136257/10.893.242.671.242.470/figure-model-structure-lanthanide-earth-carbonates-chemical-formula.webp)