1(4)
DETRMINING THE OPTIMAL ACCESS DESIGN OF MANAGED
LANES CONSIDERING DYNAMIC PRICING
Moatz Saad
University of Central Florida
4000 Central Florida Blvd, Orlando, Florida, 32816, USA Phone: +1-407-924-2685 E-mail: moatzsaad@knights.ucf.edu
Mohamed Abdel-Aty, University of Central Florida; Jaeyoung Lee, University of Central Florida; Ling Wang, University of Central Florida1, Tongji University2
ABSTRACT
Managed Lanes (MLs) are designated lanes in which the flow of traffic is managed by limiting vehicle eligibility, restricting facility access, or dynamic price tolls. In expressways, MLs play a key role in improving traffic mobility, efficiency, and safety, in addition to generating revenue for transportation agencies. MLs have emerged as an effective dynamic traffic management strategy. In recent years, several major cities in the United States have introduced managed lane systems such as ETLs (Expressway Toll Lanes), HOT (High-Occupancy Toll) lanes, or HOV (High Occupancy Vehicle) lanes. Previous research has indicated that there is an association between the installation of the MLs and the improvement of the traffic operation and safety in expressways.
This study focuses on the design of the weaving segments near the access zones. The access zones usually form weaving segments since on-ramp vehicles want to enter the MLs through the ingress and off-ramp vehicles want to exit MLs through the egress. These on- and off-ramp vehicles will weave with the mainline traffic on GPLs. Figure 1 shows the weaving segments where L1 is the ingress weaving segment length and L2 is the length of the egress weaving segment.
FIGURE 1 Weaving segments near access zones
Microsimulation techniques were developed and applied to determine the optimal accessibility level to maximize system-wide efficiency. Deciding the sufficient length and the location of the weaving access zones was also a principal objective of the research. VISSIM microsimulation was used for developing the network due to its feature of simulating dynamic priced managed lanes. In simulation, the lane choice mimicked driver’s choice behavior at dynamic tolls based on modeling components and algorithms generated in VISSIM. The research consisted of extensive data collection from microsimulation scenarios that included a 9-mile network of a managed lane segment for a main expressway in south Florida (I-95). A total of 32 scenarios were built and tested in VISSIM with
2(4)
different accessibility levels and weaving lengths. Ten simulation runs were applied with different random seeds for each scenario.
The network was well calibrated and validated by comparing the operational measurements for both simulated and field data. Hence, the simulated network replicated the geometric design and the traffic operations. Seven measures of effectiveness were determined to achieve the aim of the study. For the safety measurements, conflict frequency, conflict rate, speed standard deviation, and average time to collision were used to determine the minimum weaving length at the access zones. With respect to the operational measures of effectiveness, travel speed, time efficiency, and average delay were used as performance measurements to determine the optimal accessibility level and weaving decision length.
The Surrogate Safety Assessment Model (SSAM) was adopted to determine the conflict frequency, which is highly correlated with the crash frequency in the field. The vehicle trajectory files from VISSIM were imported into SSAM to obtain the detailed information of the conflicts. Five surrogate measurements were extracted from SSAM to evaluate the safety of the network including TTC, Post-Encroachment Time (PET), Maximum Speed (MaxS), the difference in vehicle speeds (DeltaS), and Maximum Deceleration (MaxD). An ANOVA test was carried out to compare the surrogate measures in MLs and GPLs. The results showed that TTC (F-value=13.24, p-value=0.0003) and PET (F-value=35.66, p-value<0.0001) were higher in the MLs, which indicated that MLs were safer than GPLs. Meanwhile, the maximum speed of the two vehicles in the conflict was higher in the MLs than the GPLs (F-value=61.98, p-value<0.0001). Compared to MLs, GPLs had lower conflict risk with higher MaxD (F-value=6.75, p-value=0.0096). Another significant result was that GPLs had higher conflict angle than MLs (F-value=18.8, p-value<0.0001). This result could have been due to the higher number of lane-change conflicts to rear-end conflicts in GPLs than MLs. Additionally, the results showed no significant difference in DeltaS (F-value=0.04, p-value=0.8476) between MLs and GPLs.
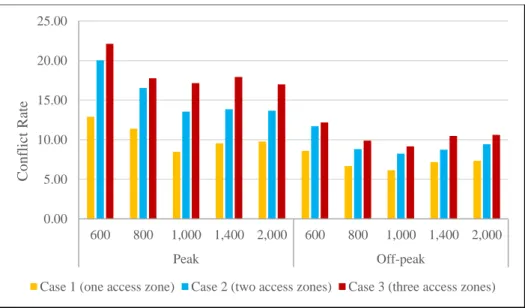
The findings indicated that there was a positive relationship between low risk and the presence of MLs. The results of the conflicty rate revealed that a minimum length of 1,000 feet is the optimal length for the weaving segments near access zones, as shown in Figure 2. Conflict rate reduced in the MLs by 48% and 11% in the peak and off-peak traffic conditions, respectively. Analysis of conflict frequency confirmed the results of the operational analysis that one access zone is the optimal accessibility level.
FIGURE 2 Conflict rate for various weaving lengths (conflict/ 1,000 vehicle-mile per hour)
0.00 5.00 10.00 15.00 20.00 25.00 600 800 1,000 1,400 2,000 600 800 1,000 1,400 2,000 Peak Off-peak C o n flict R ate
3(4) The safety analysis of the access design in MLs was successfully demonstrated. The findings of this study have several important implications for future practice or policy. It is recommended that both access control level and weaving configuration should be taken into account when designing the access openings of MLs for expressways. The study gives recommendations to the transportation agencies for improving the mobility and the efficiency of the MLs. After comparing the surrogate safety measures between MLs and GPLs, it was found that MLs were safer than GPLs since it had higher time-to-collision, higher post-encroachment-time, and lower maximum deceleration. A log-linear model was developed for investigating the safest access zone design that would minimize traffic conflicts. The conclusions of the log-linear model were consistent with other models (Tobit model and Negative binomial model). Analysis of conflicts proposed that one accessibility level is the safest option in a 9-miles network. Additionally, it was found that a length of 1,000 feet per lane change is indeed the optimal length for the weaving segments. Furthermore, from the findings of this study, a weaving length of 600 feet per lane change is not recommended near the access zones of the MLs.
Future research should focus on improving the safety of the MLs. Apart from the operational and safety measurements, driving behavior measurements should be applied in the hopes that they have a significant influence on the network. It can be done by utilizing driving simulator experiments. For future prospects, intelligent transportation systems (ITS) strategies (e.g. connected vehicles, variable speed limit, etc.) should be tested with MLs using simulation technique. Recently, several new designs have been established to connect the ramps with the MLs. New technologies and transportation strategies are being proposed for maximizing the traffic performance in MLs. The active traffic management (ATM) techniques should be tested with MLs using a simulation technology for safety improvement. In addition, one of the new applications of ATM is examining the impact of autonomous vehicles and connected vehicles to enhance the traffic operation performance simultaneously with the safety benefits at the facility. These new strategies may be excellent approaches for improving the traffic safety and operation at MLs since it is responsive to real-time traffic.
REFERENCES
Burgess, C., (2006). HOT Lane Buffer and Mid-Point Access Design Review Report, Washington State Department of Transportation, Olympia, WA. Report: FHWA-WA-RD 651.1.
Caltrans, (2011). Traffic Operations Policy Directive. State of California Department of Transportation. TR-0011.
Cambridge Systematics, I., (2014). I-95 Managed Lanes Monitoring Report.
Dowling, R., Skabardonis, A., Alexiadis, V., (2004). Traffic analysis toolbox volume III: guidelines for applying traffic microsimulation modeling software. Report: FHWA-HRT-04-040.
FDOT, (2012). 95 Express Phase 1 Fiscal Year 2012 Annual UPA Evaluation Report. File Code: 424 Doc ID#21796.
FHWA, (2011). Tolling and Pricing Program.
Fitzpatrick, K., Brewer, M.A., Chrysler, S., Wood, N., Kuhn, B., Goodin, G., Fuhs, C., Ungemah, D., Perez, B., Dewey, V., (2017). Guidelines for Implementing Managed Lanes.
4(4)
Gettman, D., Pu, L., Sayed, T., Shelby, S.G., (2008). Surrogate safety assessment model and validation: Final report.
Gomes, G., May, A., Horowitz, R., (2004). Congested freeway microsimulation model using VISSIM. Transp. Res. Rec. J. Transp. Res. Board 71–81.
Jang, K., Chung, K., Ragland, D., Chan, C.-Y., (2009). Safety performance of high-occupancy-vehicle facilities: Evaluation of HOV lane configurations in California. Transp. Res. Rec. J. Transp. Res. Board 132–140.
Jin, X., Hossan, M.S., Asgari, H., (2015). Investigating the Value of Time and Value of Reliability for Managed Lanes.
Joseph, R., (2013). Managed Lanes Case Studies-A companion to the preliminary Investigation-Impacts of Increasing Vehicle-Occupancy Requirements on HOV/HOT Lanes- Caltrans Division of Research and Innovation.
Nezamuddin, N., Jiang, N., Zhang, T., Waller, S.T., Sun, D., (2011). Traffic operations and safety benefits of active traffic strategies on txdot freeways. Report: FHWA/TX-12/0-6576-1.
Park, B., Qi, H., (2005). Development and Evaluation of a Procedure for the Calibration of Simulation Models. Transp. Res. Rec. J. Transp. Res. Board 208–217.
Perez, B.G., Fuhs, C., Gants, C., Giordano, R., Ungemah, D.H., (2012). Priced managed lane guide. PTV, (2015). PTV VISSIM 7 User Manual. Karlsruhe, Germany: PTV AG.
Schroeder, B., Aghdashi, S., Rouphail, N., Liu, X., Wang, Y., (2012). Deterministic approach to managed lane analysis on freeways in context of Highway Capacity Manual. Transp. Res. Rec. J. Transp. Res. Board 122–132.
Shahdah, U., Saccomanno, F., Persaud, B., (2014). Integrated traffic conflict model for estimating crash modification factors. Accid. Anal. Prev. 71, 228–235.
Venglar, S., Fenno, D., Goel, S., Schrader, P., (2002). Managed Lanes-Traffic Modeling. Report: FHWA/TX-02/4160-4.
Yu, R., Abdel-Aty, M., (2014). An optimal variable speed limits system to ameliorate traffic safety risk. Transp. Res. part C Emerg. Technol. 46, 235–246.