. 5 Ew 45 aetresar s)!" <2, 329 A malo Fe! 4" s r xy
N r 199 A - 1980
Statens véig- och trafikinstitut (VTI) - 581 01 linkoping
ISSN 0347-6030 National Road & Traffic Research Institute - S-581 01 Linkoping - Sweden
Efficiency of Spray Protectors
Tests 1979
1|. . 1 1 1 4 1 l { d. I 1 4 A l l i J i l l 1 1 1 1 I 4 3
The work presented in this final report was sponsored
by:
The National SWedish Board Development of measuring for Technical Development methods, basic equipment
(STU), Stockholm and production of an
illustrative film /
Marknads-Innovator AB, Testing of spray protectors Sundbyberg, Sweden
Monsanto (Deutschland) Testing of spray protectors
GmbH, D sseldorf, West Germany
The National Swedish Road Some data compilation and and Traffic Research Insti- production of a conference tute (VTI), Linkoping paper
The report is also issued in a Swedish version: (Rapporten utges ocksa 1 en svensk version:)
SANDBERG, U: "Effektivitet hos stankskydd.
Mat-ningar 1979". Rapport nr 199, Statens vag och trafikinstitut, Linkoping (1980).
Also produced in this work is a conference paper summarizing the tests 1978 - 1979:
SANDBERG, U: Improved spray protectors for
commercial vehicles An approach to increase traffic safety. The International conference on
Ergonomics and Transport, University of Swansea,
Wales, U.K. (1980).
CONTENTS ABSTRACT SUMMARY 7 7.1 7.2 7.3 7.3.1 7.3.2 7.3.3 7.3.4 7.3.5 7.3.6 7.3.7 7.3.8 7.3.9 BACKGROUND
SPRAY AS A NUISANCE FACTOR IN TRAFFIC WAYS TO REDUCE NUISANCE CAUSED BY SPRAY
LEGISLATION
RECENT TESTING OF NEW SPRAY PROTECTORS MEASUREMENT METHOD
Measurement of visibility
Other measurements
Specification of instruments
Watering of test track
The pavement
Measurement procedure
EXPERIMENTAL PROGRAM Experimental parameters
Test vehicles
Tested spray protectors ST 0 ST 1 GW 1 GW 2 GW 3 M l M 2 M 3 BS VTI REPORT NO. 199A
Page II 10 11 11 12 16 16 16 17 19 19 20 22 22 23 24 25 25 26 27 27 28
8.1 8.1.1 8.1.2 8.1.3 8.2 9.1 9.1.1 9.1.2 9.1.3 9.1.4 9.1.5 9.1.6 9.1.7 9.1.8 9.2 9.3 10 10.1 10.2 10.3 .10.4 10.5 10.6 10.6.1
VTI REPORT NO.
ANALYSIS PROCEDURES
Analysis of spray measurements
Spatial distribution curves of spray The description of spray intensity by a total 120 m average
15 m peak value
The influence of secondary variables. Correction procedure
Subjective estimations from photographs EXPERIMENTAL RESULTS
Measurements
Spatial distribution curves
120 m averages of spray Experimental accuracy
Comparison between 15 m peak and 120
m average values
Speed influence
Influence of ambient conditions
Influence of water depth on protector efficiency
Spray from a passenger car Subjective evaluation
Relation between subjective and objective evaluation methods
Observations from films DISCUSSION
Influence of daylight illuminance and wind
Influence of water depth
Consequencies of the water depth
influence
Subjective response
The relation between subjective and objective evaluation
Results for spray protector types
Type ST 1 and ST 0 199A 30 30 30 31 33 34 38 38 38 38 39 52 54 55 56 58 59 60 61 63 63 63 66 66 66 67 67
10.6.2 Type GW 1 10.6.3 Type GW 2 10.6.4 Type GW 3 10.6.5 Type M 1 10.6.6 Type M 2 10.6.7 Type M 3 10.6.8 Type MB vs BS
10.6.9 Remaining splash and spray
10.7 Measurement considerations. 15 m peak value as opposed to 120 m average
11 OTHER CONSIDERATIONS THAN SPRAY
REDUCTION EFFICIENCY
12 CONCLUSIONS
13 RECOMMENDATIONS
14 REFERENCES
VTI REPORT NO. 199A
67 68 68 68 69 69 69 7O 71 72 74 78 81
by Ulf Sandberg
National Swedish Road and Traffic Research Institute
Linkoping Sweden
ABSTRACT
With the purpose to investigate the efficiency of some new spray protector designs for heavy vehicles, tests have been made of spray generation from four trucks, of which two were equipped with new spray protectors. The experiments were made on an artificially watered test track with l - 1,5 mm water depth at 80 km/h. The intensity of the spray was measured by special measurement equipment, which in principle is measuring the light transmission loss caused by spray in different positions and directions in relation to the vehicle.
Altogether, 10 combinations vehicle/spray protector were tested, including standard types according to
Swedish and British practice. Analysis was made of measurements as well as of photographs and films
illustrating the spray generation. The obtained
efficiency of the spray protectors was consistent and essentially independent of what evaluation method that
was used. The most efficient spray protector gave a
spray reduction of 25 - 30% composed to a standard Swedish spray protector.
The report contains an extensive description of the measurement and evaluation technique and also presents a collection of measured spray propagation curves
behind the vehicle. An analysis is also made of details in the spray measurements and the consequences of this for some of the spray protectors. Based on the results
some recommendations are given concerning possible
improvements in splash and spray protection on heavy
vehicles.
II
Efficiency of spray protectors - Tests 1979
by Ulf Sandberg
National Swedish Road and Traffic Research Institute
Linkoping Sweden
SUMMARY
Splash and spray from vehicles travelling at high
speeds on wet roads has received attention as a
problem with impact on traffic safety, road environ
ment and economy. There are ways to reduce this problem,
one of them being the improvement of spray protectors
on the vehicles.
Reduced visibility due to wet roads has been identified
by an OECD road research group as a traffic safety
problem nearly as important as the reduced skid
resistance. Visibility impairment can be due to several factors, of which splash and spray should be one of the most obvious. In a British study it is recognized that there is a significant potential for accident
savings if splash and spray can be reduced.
The purpose of the work reported here was to study the efficiency of some spray protectors. This study is a continuation of tests made in 1978 now using other vehicles and concentrating on the designs found
effective in the earlier tests.
Tests were performed by repeatedly running a pair of
vehicles over a watered test track; one vehicle being a 3-axle "control" truck with container and equipped with standard protectors according to Swedish practice, and the other being a similar "test" truck equipped with the protectors to be tested. Also tested were a pair of British 4 axle articulated vehicles with semi-trailers loaded with containers. The vehicles were
run at 80 km/h through the test area, watered by an
irrigation pipe system to a water depth of l - 1,5 mm,
around which were placed different types of
measure-ment equipmeasure-ment.
The spray was measured according to a method involving the measurement of the spray-induced reduction of
visibility (light transmission loss through the spray
cloud) transversal to the driving direction as well
as longitudinal l m to the sides of the vehicle. The
reduction of visibility was continously recorded during the vehicle runs, and from this a measure was obtained representing the variation of the spray
intensity at different distances behind and along the
vehicles.
As a complement to the measurements, photographs and
films were produced With the object of enabling a
"subjective" evaluation as well as a detailed study of the splash and spray generating process.
Altogether, 10 different combinations vehicle/spray
protector were tested, some of them being very similar to each other. The two new basic types utilize the
principle of preventing the water droplets hitting the spray protectors to flow out into the air streams, either by "absorbing" the kinetic energy of the drop-lets (type M) or "rectifying" the flow by allowing the droplets to flow through incnmadirection but not
returning (type GW). Additionally, the protection at the upper sides of the tires is extended by using
wide side valances.
In the analysis of the measurements, curves of spatial spray distribution behind and beside the vehicles were produced, as well as overall figures representing the average reduction of visibility for the respective spray protector. Beside these objective methods,
IV
unbiased subjects made subjective estimations of the
spray generation based on the comparison of photographs
of the spray from behind the vehicle.
From the repeated runs of the control vehicle at different occasions, it was possible to calculate
by regression technique the influence of certain ambient conditions like wind, water depth and illuminance
(daylight). Surprisingly, it was found that the
visibility reduction due to splash and spray appears in certain cases to decrease with increased water depth. A discussion of this is included, and it is proposed that a reason might be altered proportions between splash (which is water ejected from the tire-road
interface) and spray ( which is water thrown
centri-fugally from the tire tread). This observation is quite important because from that follows that tests should be made using constant, defined water condi-tions on the road, preferably with both a low and a high water depth. The reason is that the efficiency of spray protectors is influenced by the proportions between splash and spray, and the spray protectors can be effective only for spray.
The results show that:
- The best tested GW type, and the best M types, improvedthe splash and spray reduction by 25 - 30% relative to the standard Swedish protectors mounted
on the same vehicle.
- On the tested British trucks, an improvement of
10 20% was obtained for the M type protector compared to the "standard British" design. It is, however, suspected that the differences in basic vehicle design for the British vehicles might have influenced the result. If so, the new M type was probably misfavoured.
Swedish trucks being similar but not identical. Together with the observation that the bigger
British vehicles generated twice as big visibility reduction as the Swedish, it is concluded that vehicle design other than concerning the spray
protectors is influencing splash and spray considerably.
- Evaluations from measurements were generally fully
compatible with systematic subjective evaluations by a group of subjects studying photographs.
- The tested spray protectors appear to be effective for what they are meant, i.e. suppression of spray
thrown off the tire tread. An exception is the spray
escaping below the mudflaps. Further improvements should be directed towards the reduction of this "below mudflap" spray, as well as side splash from
the tire-road interface. Also, according to the above,
there is a great potential for improvements by
proper vehicle design, mainly by improving the aero-dynamics.
Other characteristics than spray suppression have not been tested here, but different aspects are discussed in the report, and from available information it
appears likely that there are no serious practical
problems connected with using the new protectors. A systematic over-the-road test is, however, recommended.
In order to reduce splash and spray significantly by vehicle modifications, it is probably necessary to use efficient spray protectors, for example of the designs tested here. The efficiency already obtained is not implying that the problem is solved, but should be big enough to motivate the use of the new spray protectors as means of reducing traffic hazards and environmental problems.
In 1978 this institute tested the efficiency of some
recently invented spray protectors for heavy vehicles. The results showed that quite simple measures were able to reduce vehicle spray considerably. An improve-ment around 30 45% in visibility through the spray cloud was possible when using the best type (ref 1). The tests were purposely simplified in some ways to
reduce the cost for this initial study, due to the
risk for negative results. The "simplifications" were: - Prototypes were tested on a flat-bed two-axle truck.
This truck is not very representative of those vehicles fromwhich spray is a great nuisance.
Prototypes were mounted only on the rear axle. The
wheels on the front axle were almost completely covered by enclosures, and it was anticipated that all vehicle spray then was coming from the rear
wheels.
The capacity of the test track watering system
allowed only 90 m to be wet.
- Each spray protector type was tested on different days. Changes day-to-day in ambient conditions could then influence the result, despite trials to control or compensate for this. Better would have been to have a reference vehicle running in parallel to
the test vehicle.
1
The 1979 tests were intended to repeat the tests from 1978 but eliminating the "simplifications" mentioned above. Only the two best types from the previous tests were chosen as test objects. Additionally some variants using the basic principles of the effective types were
tested. VTI REPORT NO. 199A
2 SPRAY AS A NUISANCE FACTOR IN TRAFFIC
"Reduced visibility is nearly as important as decreased skid resistance as a factor in accidents in rain".
This was stated by the OECD Road Research Group in l976 (ref /lO/). Despite the seriousness of spray as
a road accident hazard very little attention has been drawn to this.
Reduced visibility in wet weather can arise from several sources. One is the impairment in visibility directly through the rain. Another is the visibility reduction due to the unfavourable changes in
reflecti-vity and specularity in the presence of road lighting
and vehicle headlights during wet weather. A third source is the generation of water splash and spray from vehicles travelling at high speeds on a wet road.
This work deals with the latter source.
By splash is usually meant the water thrown away in
forward (bow wave) and side direction (side wave) from the tire-road interface. This water consists of relatively large droplets thrown out quite low and
will generally not be caught to a large extent by the
air streams around the vehicle. Thus, only small parts of this will interfere with the drivers height of view.
It may, however, increase to considerable intensity if
the water depth is very high,like<1n a worn road. More severe appears to be the spray thrown out by centrifugal action tangentially from the tire tread
(tread throw) of which great parts hit other vehicle parts and thus constitute a secondary source. The droplets so produced are small and have a greater
height above the road and therefore are easily caught by the air streams. The small droplets have a low
sinking speed and may be persistent in the air wake behind the vehicle for a long time - sometimes this
"tail" can be up to 200 m long.
following negative consequencies on traffic safety:
1. Approaching traffic will face an impaired visibility through the spray before the approach.
2. Approaching traffic will have a sudden and heavy shower on the windscreen. This may cause a reac tion of panic from some drivers not prepared to this, which may result in a braking action giving loss of vehicle control. It may take several
seconds until the windscreen wipers have been
switched on.
3. Vehicles behind the spray-producing vehicle get impaired visibility through the spray in the air as well as through the water-covered windscreen.
The latter nuisance can of course be reduced by
efficient windscreen wipers.
4. Dirty headlights decrease drivers' night time visibility distances.
5. Dirty headlights and rear lights decrease vehicle
conspicuity.
6. Rear windscreen and external rear mirrors get dirty, giving reduced rear visibility.
7. Road signs become dirty and thus less visible. All the mentioned negative consequencies will not only
mean a potential accident risk due to its direct influence, but also an additional stress factor for
the vehicle driver that may have an influence on pert formance and in a way - comfort.
Another effect worth mentioning, is the pollution in the road vicinity. Salt spread on the road for de-icing purposes will be picked up by the tires and thrown out along the roadside as spray. This will
directly influence the flora near the roads. Salt
pollution in the forests can be a great economic load
as damage by insects will increase on salt polluted trees.
Vehicle generated spray is mainly a problem caused
by heavy vehicles but with impact on the light vehicles. The drivers in heavy vehicles are higher above the
road and thus less disturbed by the spray. The spray problem has increased during the last decades due to
increased traffic intensity and speed, bigger vehicles, increased salting and use of dirtproducing studded
tires.
Spray related to traffic accident statistics has not received any particular attention. Here are mentioned a few investigations discussing this matter. The first
is by Forbes (ref /2/) who studied accident statistics
in Michigan, USA, and found that about 20/00 of all
road traffic accidents could be due to splash and
spray. Maycook (ref /7/) found about twice as high rate
(equivalent to 1.3% of all wet-weather accidents) when
he studied records of accidents occuring on Ml, M10 and M45 in Britain. These figures may be invalid for the present traffic situation because they are quite old. Sabey (ref /4/) suggested that there might be as many
as 7000 injury accidents each year in Britain in wet
weather that could be due to impaired visibility caused by splash and spray.
suggests that an improvement in splash and spray
condi-tions of 33% in the U.K. would give a potential of
approximately 2000 fewer accidents per year, which is equivalent to almost 1% of all accidents or 10% of all accidents attributable to wet weather conditions.
3 WAYS TO REDUCE NUISANCE CAUSED BY SPRAY There are ways to reduce spray nuisance:
1. Increase road drainage. A very efficient method is to use a so-called drainage pavement, i.e. an
open-graded asphalt pavement having a porous surface allowing water to run through it vertically. Such
surfaces have been tested for some time now, but not come into any extensive use. Some trials in
Sweden are, however, promising. Observations during rainy weather show that the spray reducing poten-tial is almost 100%. The pavement influence has
been tested in Britain, confirming this statement (ref /5/).
2. Decrease vehicle speed. The speed dependence has
been shown to be approximately cubic, i.e.:
Spray intensity ~ (speed)3.
Spray is generally no problem at or below 60 km/h.
A reduction of maximum speed during rainy weather
is therefore very effective. Effective are, however, not the trials to force drivers to drive slower.
3. Improve vehicle aerodynamics. Less turbulence
around and behind a vehicle will of course pick up less spray and move it a shorter way. The practical reduction potential might be quite big, judged
from results of Weir, (ref /6/).
4. Improve vehicle spray protectors. The practical reduction potential here seems to be at least
30 - 50% according to recent findings. It is of course depending on what the reference is.
The first two methods which give a reduction at the
to accept the drawbacks. However,:itis possibly easier (and faster) to get the two latter methods in
prac-tical use.
4 LEGISLATION
In order to reduce the impact of vehicle-generated
spray, as well as stones and dirt thrown up backwards,
legislative efforts have beenxmmhe,implying the use of fenders and mudflaps. However, these legislated spray protectors have never been scientifically tested
regarding the efficiency. The most "advanced" legisla tion occurs in Sweden. Here it is stipulated that the
spray protectors have the dimensions related in figure
1. In reality, protectors on Swedish heavy vehicles are often much closer to the wheels than sketched in
figure 1, which probably increases the efficiency. In
United Kingdom the legislation says that wings
(mudguards) shall be fitted to vehicles to catch mud or
water thrown up by the wheels, unless adequate protec-tion is afforded by the body of the vehicle. The
methods used to meet the requirement vary, with many trailers relying on the overhang of the body and a simple mudflap hanging down behind the rear wheels.
W.
V' mh
profile of fender
f OI1°W '1 W I "
.
h < %
, I 777//////// // // ////Figure 1. Spray protectors for trucks according to Swedish regulation
that demands vehicles to be equipped with rear wheel
"splash and stone t nxwv protection". A rear mudflap,
or a corresponding body part, is stipulated which gives a maximum unprotected height above road that is 1/3 of
the distance behind the wheel center.
A federal regulation was, however, proposed in 1970 to require a more efficient and complex spray protector
design which was in fact based on research (ref /7/).
The prOposal was, however, withdrawn because the trucking
industry considered it to have a serious drawback,
namely increased brake temperatures during certain driving conditions.
Most other industrialized countries have a legislation
similar to the British and American standards.
lO
5 RECENT TESTING OF NEW SPRAY PROTECTORS
The reason for the attempt to introduce new spray
protectors in USA was that it had been found that a new, complex type was considerably more effective than the simple rear mudflaps (Kamm et al, ref /8/). This work also led to testing of more new inventions in the USA. Eventually it has resulted in the develop-ment of a design that seems to be both simple and
effective and which is a combination of a roof spoiler on the truck cabin and a new water "collection" mate-rial covering some areas adjacent to the wheels; see further refs /9/ and /6/. In Britain, TRRL tested some ideas about spray protection and found that an improve ment of 30% relative to flat rear mudflaps was possible
(Chatfield et al, ref /ll/). However, this effective design was considered to be too complex in relation to its efficiency.
It should also be mentioned that Japanese tests have shown that quite simple devices can reduce spray considerably (Yamanaka & Nagaike, ref /12/).
6 MEASUREMENT METHOD
6.1 Measurement of visibility
The measurements were made on a test track (Mantorp
racing track) where a test vehicle was passing the measuring instruments several times for every tested
case. The propagation of spray was measured as well as a lot of other parameters. An irrigation pipe system (figure 2) watered the test track.
The impact of spray is mainly a visibility reduction,
and therefore it is primarily desirable to measure the visibility in a way as realistic as possible. It is also interesting to know the spray propagation, or spatial distribution at different locations relative to the vehicle. Therefore there are three different instruments ("visibility meters") each measuring the light transmission over a certain distance. Each
instrument consists of a transmitter for light having a frequency spectrum corresponding to daylight, and a detector (receiver) adapted to the spectral
characterist-ics of the human eye. The effort is to imitate the
conditions applicable to the human visual organs as close as possible. Additionally there are electronics for, among other things, filtering and demodulation of the transmitted light signal to make the output
intensitive to any ambient light.
One visibility meter was situated to measure the
visi-bility reduction (i.e. the reduction of light trans mission) over an 8 m distance transversal to the driving direction (transversal measurement). See
figure 2 and 3. The other two meters were situated to measure the visibility reduction parallel to the
driving direction over a 2 m distance (side
measure-ment). The lateral distance to the sides of the vehicle
12
was 1 m. Due to the short distance source-receiver, the spray propagation behind and beside the vehicle can be measured with a resolution of approx 2 m. Thus, the output signal during the vehicle pass-by is
corresponding to a "spray intensity" (represented by the reduction of light transmission over the 2 m long
distance) as a function of distance behind the vehicle,
see figure 29 - 38. The average measuring height was 1.0 m. This is approximately corresponding to the visual height for modern passenger cars.
6.2 Other measurements
Besides the visibility measurements, the vehicle runs
were photographed from a position 65 m from the main instrumentation area at a direction behind the vehicle at a pass-by. As a uniform background, large
"checker-boards" were used, see figure 4.
A cine film was also produced showing, among other
things, comparisons between pass-by for vehicles
equipped with different spray protectors.
Speed was measured by a microcomputerized equipment, which was triggered when the vehicle passed the
position sensors, see figure 2, and then made a computation of the speed. The position signal was used also to trigger the camera and recordings to synchronize the laboratory analysis.
Wind speed and direction were continously monitored by an electronic equipment. The momentary values of wind speed and direction were noted for each vehicle pass. The same was done for the ambient illuminance
measured by a photometer. Water depth was measured on
24 defined positions on the test track (figure 3) by a simple but reliable device shown in figure 5.
VTI REPORT NO. 199A
Figure 2. Sketch of central measuring area
B a k g r un d s t a vl o r ( s c h a c k m o n s t e r ) B a c k g r o un d b o a r d s (c he ck er pa tt er n)
U
U
U a t a in -s a m l i n g s -il N a t n . a v vi n d M e a s . o f wi n d ==*m km G Vat t en t a c k t b a n a , ---t o t a l t 19 0 m We t t e s t t r a c k , in tot a l 19 0 m S n itt t va r s g e n o m s i k t m a t n . o m r éd et S e c t i o n t h r o ugh t h e a r e a f o r vi s i b i l i t y m e a sur e m e n t \k B e va t t n i n g KK AW at er pi pe . .gr ad e 2% S i k t m a tni n g / V i s i b ili t y m e a s . L 8 = Va n s t e r s i d a/ L e f t s i d e RS = R o g e r s i d a /R i g h t s i d e = = M o t t a g a r e /r e c e i ve r T = T va r s r i k t n ./ T r a n s ve r s a 1 [ 2 :3 S a n d a re / s o ur c e CE ) P o s i t i o n sg i va r e / P o s it i o n s e n s o r s (I R li gh t) g g P e r f o rm e r a t b e va t t n in g s r o r (m ed ut l o p p va r j e m e ter ) Pe rfor at ed ir ri gati on pi pe (wa ter out le t ea ch me te r) I: 3 M a t n . a v o m g i vn . b e 1 ys ni n g / M e a s ur . o f a m b i e n t i l l um i n a n c e
l4 QF'
3-
xx
3 ! O-N Xx XX 0 m XX XX-
~>e-OP <f' XX E. o[- x X Ln XX/
Camera \H Bakgrundstavlor Checker boards Siktmatn. omradeVisibility meas. site
2 m mellan matpunkter 2 m between meas. points
Film camera xx x = Matpunkt for vattendjup Water depth meas. point XX Bevattnad teststracka Wet test section
Figure 3.
VTI REPORT NO . 199A
Sketch showing camera position and water depth measurement points
Figure 4. The control vehicle passing the measurement site. Photograph of the same type as used for subjective comparisons
Figure 5. Gauge for measurement of water depth
Figure 6. The texture of the road surface
16
All visibility signals as well as position data were reCorded for later data analysis. During part of the measurements a fast UV paper tape recorder was used to monitor the signals. A block diagram showing the measurement equipment is given in ref /l/, figure 2.
6.3 Specification of instruments
Please refer to chapter 4.3 in ref /l/.
6.4 Watering of test track
The test track was watered by a perforated irrigation pipe system borrowed from Monsanto. From holes in the pipe approximately 1 m apart, water flowed out on the pavement. Due to the cross slope of the pavement, a quite uniform water depth was obtained when the water flowed across the track. Approximately 190 m was watered this way, which should be sufficient to "fill" the spray protectors so that a continuum is reached before the vehicle reached the central measurement section. An average water depth of 1.0 - 1.5 mm was obtained.
6.5 The pavement
The pavement on the test track was asphalt concrete type HABlZT with a relatively unworn surface. See figure 6. This pavement type is very common in Sweden. The absolute amount of spray is probably influenced by pavement type, but for comparisons between spray protectors the road surface is supposed to be
insignificant.
For anyone wanting to compare the texture with other pavements it can be mentioned that it had a "drainage
resistance" of 14.4 dB rel. to l s. In ref/13/ is given a table comparing such values, where it can be seen
that 14.4 is a good compromise between a very rough
and a very smooth pavement. It corresponds to
approxi-mately 0.9 mm of sandpatch-measured texture depth. It
happens to be the same value as for the pavement used in US tests, ref /6/.
6.6 Measurement procedure
Two vehicles were used. One of them the test truck -was tested when using the different new spray protectors.
The other - the "control" truck - was tested when using
its original spray protectors. To have a reference for the comparisons, the test truck was also tested when equipped with its original standard spray protectors. The control truck was always driven in pair with the test truck (either 30 s before or after) to ensure that the same external conditions should prevail for the two trucks. The order of the truck pass-bys as well as the vehicle drivers were changed to have such possible systematic errors eliminated. Thus,ii:was possible to have a constant control (= the control truck test series) during all measurements,enablingcmmmensation of un
intentional variations in test parameters. Therefore all so normalized comparisons between tested spray
protectors should ideally be free from systematic
errors due to changing ambient conditions. The remaining errors could be seen as mainly randomerrors.
In each measurement series (generally one per spray
protector type) 20 - 40 runs were normally made with each vehicle. In total,rmnxathan 700 recorded runs were made.
18
Each run was recorded on a tape recorder for later analysis but a rough check of the look of the spray propagation curves (which were later processed to
figures like figure If7) registered on an oscilloscope and a paper tape recorder,kusmade to detect any obvious defects. Also,v xmiand vehicle speed data were checked. The procedure for selection of accepted measurements was:
1. Wind speed component in driving direction <[i4.0[ m/s
2. Wind speed, side component <2,0 m/s
aunt measured spray intensity in one side channel
must be < 4 times the other channel.
Wind speeds up to <3,0 m/s are, however, accepted if measured spray intensity in one side channel
is not more than 2 times the other channel.
3. Disturbances in the measured curves (very narrow "spikes") must not be visible.
All conditions must be fulfilled at the same time. The selection rules were based on experience of wind influ ence in earlier tests and confirmed by regression tests on the present data. The remaining wind influence is
compensated according to the procedure in chapter 8.2.
Each test series was usually completed in one or two hours. Before and after each series the water depth was measured. The presented values are averages.
For about 2-18 runsx in each test series, photographs
were taken from the camera position in figure 3 (for
type Ml, the film was destroyaiduring rewinding in
the camera).
X 18 per vehicle
EXPERIMENTAL PROGRAM
Experimental parameters
The vehicle speed was 80 km/h, except when the speed influence was tested. The speed was chosen as an
aver-(70 and 90
km/h, ref /1/) and it has also been used in other
(ref /6/I /ll/).
age of the speeds used in the 1978 tests
recent tests
In table 1 are given all relevant data concerning the
ambient conditions, like water depth, illuminance
(daylight) and wind. The maximum values for accepted momentary wind conditions are given in chapter 6.6. Table l. Values of some secondary test variables during
the tests. Averages of all runs used for spray calculations.
Test series water depth. Illuminance 'Wind speed
H g m g
a).
g
"E
E
fe. $4
LE???
9%
a
3:1 as:
as:
Ur.
U mm mm mm 1ux/100 m/s m/s ST 1/ ST 0 1,38 1,32 1,44 608/654 0,8/0,6 0,6/0,8 GW 1/ ST 0 1,26 1,41 1,10 328/309 3,0/2,9 1,2/l,2 GW 2/ ST 0 1,09 1,23 0,95 426/442 2,9/2,6 l,1/1,2 GW 3/ ST 0 1,24 1,52 0,96 83/83 1,8/2,4 l,1/0,8 M 1 / ST 0 1,07 1,26 0,89 408/460 0,4/0,6 -0,l/-0,5 M 2 / ST 0 a 1,18 1,60 0,76 434/484 0/0 -0,7/-0,7 M 2 / ST 0 b 1,09 1,01 1,18 436/438 1,4/l,3 -0,6/ 0,6 M 2 / ST 0 c 1,22 1,21 1,23 650/650 0,7/0,8 0,8/ 0,9 M 3 / ST 0 1,35 1,32 1,38 1/3 ~0,5/4)A9-1,2/ 1,2 MB / BS 1,12 1,10 1,15 600/660 0,4/0,4 1,7/-1,7VTI
Positive for direction left-right rel.
direction
REPORT NO. 199A
20
7.2 Test vehicles
Two pairs of test vehicles were used. One pair consisted
of two 3-axle Swedish trucks; Volvo G89 loaded with an
empty, covered container. They are assigned "ST 0" and "ST 1" respectively. The only visible differences were concerning the standard spray protectors which could differ up to 50 mm in certain distances to the tire and the body (quite "normal" tolerances for in-service
vehicles). Also, on the truck ST 1 (the "test" truck)
8 out of 12 tires were worn 20-30% as compared to ST 0 which had new tires all around. See fig 7 and table
2-3.
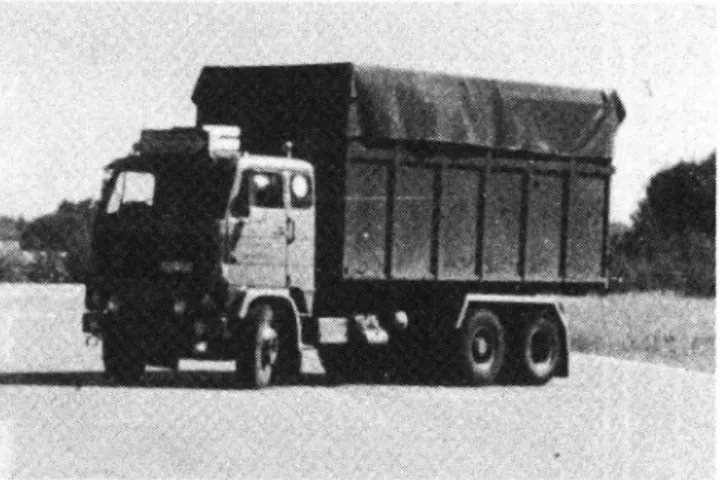
The other pair was two British trucks consisting of a 2 axle tractor and 2 axle semi-trailer with a container. They were meant to be identical except for the spray protectors, but when finally arrived, they showed up to be different in certain respects. The differences can be seen in fig 7 and tables 2 and 3. The difference in aerodynamics - if significant - should be unfavourable to type MB which was higher and had a sloping container, possibly building up a higher pressure below the con tainer. There were also some differences in tire equip-ment, but it is difficult to say if that could have had anyinfluence and.if so, in what direction. The con
tainers were unloaded.
I;
U3 (.0 .1' " _ _ _
-Vehicles BS and MB Vehicles ST1 and STD
Figure 7. The test vehicles
Table 2. Vehicle dimensions
Vehicle STl and STO MB BS
Type Volvo G89 Leyland Leyland
Marathon 2 Marathon 1
Total length m 8,4 14,8 'l4,8
Total max height m 4,1 4,35 4,1
Width m 2,5 2,5 2,5
Container dimensions 6,0x2,7x2,5 12,2x2,9x2,5 12,2x2,8x2,5
Wheel base m 4,5 2,7 2,7
Tandem axle distance 1,4 1,4 1,4
Table 3. Tire data
Vehicle Axle l Axle 2 Axle 3 Axle 4
Dim? 12.00 R 20
11.00 R 20
11.00 R 20
ST 1 Type Michelin XZA Michelin XZY Michelin XZY
Wear 20% 30% 0
Dim.
ST 0 Type As for STl
Wear 0 0 0
Dim. 11 R 22.5 11 R 22.5 9.00-20 9.00-20
MB Type Michelin XZA Michelin XZY Michelin XZZ Michelin XZZ
Wear Estimated as "quite unworn"
Dim. 11 R 22.5 11 R 22.5 11 R 22.5 11 R 22.5
BS Type Dunlop SPlll Michelin Dunlop SPlll Dunlop SPlll Remoulded
Wear Estimated as "quite unworn"
Dimension
xx Tread pattern similar to Michelin XGV and Dunlop SPlll
22
7.3 Tested spray protectors
"Standard Swedish spray protectors", i.e. the original
[equipment of the control truck, see figure 8. They are
meant to comply with the Swedish spray protector regula-tion. Another similar type, but curved to follow close to the tire «circumference is also frequently used on
Swedish trucks. Clearing :mudflaps road *150 mm.
Fig 8. The control vehicle (type ST 0).
Original equipment of the test truck. The design is the same as ST 0. Unintentionally there were some minor
differences in the clearing to tires, vehicle body and
road. Clearing mudflap - road was 2130 mm. As stated in an earlier chapter, the trucks used tires in slightly different wear conditions. All these minor differences could combine to explain the 10% difference in spray intensity reported later.
Fig 9. The test vehicle equipped with standard protec-tors (type ST 1).
24
§w_;
GW stands for the inventors: gustafson and eimar. The type utilizes the normal spray protectors, but with added material (expanded metal grid, mesh size 6x4 mm
according to:
0 Sheets covering the inside of the fenders and the mudflaps. Clearing - 20 mm.
o Added side valances at front and rear wheels
according to figure 10.
0 Sheet between driving and trailing wheels on the bogie.
Clearing mudflaps - road 2150 mm. The principle is that the water droplets are pushed through the sheets and streaming downwards on the inside of the original fender/mudflap, i.e. a kind of "rectifier" effect.
Fig 10. Type GW 1.
3.4 §w_2
The same as GW 1, except that
the plain steel sheet that covers the top and front part
of the bogie tires was omitted. The tires were then c
overed only by the expanded metal grid. See figure ll.
Fig ll. Type GW 2.
7.3.5 GW 3
As GW 2, but the sheet between the rear wh
eels was
omitted.
26
7.3.6
131 i
A design by Monsanto called "Spray guard". The original spray protectors of the test vehicle were replaced by the design shown in figure 12. The material was sheets of polyethylene covered by a blade matrix looking like
"grass" (see fig 14 in ref /l/). Clearing mudflaps
-- road: Front 80 mm, rear 180 mm.
The principle is that the blade matrix captures and absorbs the kinetic energy of the water droplets and
returns the water in free-running streams to the road.
Fig 12. Type M l.
I
N
The same as M 1, except that the rear side valances were cut to match the tire periphery. See figure 13.
This design was tested at three times with different water depths. The tests are then called M 2a, M 2b and
M 2c.
Fig 13. Type M 2.
Same as M 2, except that the rear mudflaps were extended
downwards to about 140 mm above the road surface. VTI REPORT NO. 199A
28
BS stands for British truck, standard protectors. One
of the two British trucks supplied by Monsanto. This articulated vehicle used its original spray protectors and was the reference against which type MB was compared.
Fig 14 a-c. Type BS.
Fig 14 d. Comparison of vehicles BS (left) and MB.
7.3.10 MB
Monsanto spray protectors, Eritish truck. Same type of vehicle as BS except differences explained in chapter 7.2, but equipped with spray protectors of type "Clear Pass" made by Monsanto. The material is identical to that used in type M l-M 3.
Fig 15. Type MB.
3O
8 ANALYSIS PROCEDURES
8.1 Analysis of spray measurements
8 1-1
§pétial_§;§EElEEEiQE-29£Z§§_9£_§E£§y
The spray versus time recordings made at the vehicle runs were playbacked and converted into digital form for the computer analysis. A block diagram showing the analysis instrumentation is given in fig 19 of ref /l/. After correction for non nominal speed according to chapter 8.2, all spray time recordings belonging to the same test series were averaged. A selection proce-dure with defined rules V ns used as explained in
chapter 6.6. The number of useful runs (recordings) in each test series was 8-27, the average being ca 15. Spray versus time is also corresponding to spray versus position relative to the vehicle, as vehicle position is prOportional to time. The spray recordings there-fore enables the estimation of spray intensity as a function of distance from the vehicle. The relation so obtained is called "spray propagation" or "spray
distri-bution curve", andmost results of these calculations
are given in fig l7-26. Spray propagation curves were computed for every measuring position: Transversal, left hand side, right hand side. Additionally both sides were averaged into a new curve called "side measurement", which then normally was used to charac-terize the spray beside the vehicle. The advantage of this, is an increased accuracy and a partial compensa-tion for influence of side winds blowing spray towards
one side.
8.1.2 The description of spray intensity by a total 120 m SYEESH? _ _ _ _ __ _ _ _ . _ . _ _ _ _ _ _ _ _ _ _ __
In order to get overall measures for comparisons of visibility reductions through the entire spray cloud,
the average of each spray propagation curve was
calcu-lated:
X2
E = 1 ° I ' dX
X -X2 l X
l
B = average visibility reduction,(Nitransmission
loss, for each passby s(x) = spray distribution curve
x = distance behind vehicle front end
X1, X2 = limits for the calculation
The total averaging distance XZ Xl was always 120 m.
The starting position was, however, different:
Type of measurement Starting position rel. to
vehicle front end (X1)
All side measurements 0 m
Transv. meas. Swedish trucksx 13 m (= 4,5 m behind rear end)
Transv. meas. British trucksXX 21 m (= 6 m behind rear end) The average can be seen as the average visibility
reduc-tion or transmission loss in the total air volume,
behind and at the sides of the vehicle, swept by the visibility meters during the runs. This volume is illu-strated in fig 16.
The unit for visibility reduction caused by spray,
measured in transversal direction will be [%/8In],
because the measuring distance across the track is 8 m. X All tests except MB and BS
Tests MB and BS
VTI REPORT NO. 199A
Figure 16. 32
E
a
E
ljk-4
Q) m 6 U H U) (5 U H p a03'
3
q >\\\ m,c\
2f
\ \ E : N Ln : .445: \ 1 g\ O
N
U) E: \ U) x\ m o
5
.M .54 \ 3 8i S n
f-J El 2 ...-. [ -.__/ ag; / E \ $232; 0\
a
N
\ t-\ \E
\ V \ \ \ \ \ \ \ \ \ \ \ a N \/ F N _ 9Illustration of the volume swept by the three visibility meters, and used for ana-lysis, during a run. (In reality the meters have fixed positions and the vehicle is moving)
For the side measured spray the unit will be [%/2 m] ,
because the measuring distance (source- sensor) is only
2 m.
By using the formula
-C-d 1-R = Transmission
1-R== e
d = Distance over which
transmission is measured
C = A "constant" influenced by air density, water particle density, and
the size distribution
of the particles it can be shown that the total visibility reduction over 120 m (for side measurement: comprising the entire
spray cloud) called Rtot is:
Rtot = 1--(1--1 2)k k = 60 for side measurement
k = 15 for transversal
measurement
For these measurements the total reductions (transmission
losses) lie in the range 30-60%. The average visibility reductions are given in table 4.
8 1-3
l§_m_9§§5_y§lys
In ref /6/ is used a measuring distance for transmission
loss of 50' (15 m). The maximum value of this during a run is used to represent the spray. Only measurements on the left side are made. The motives for using this
15 m peak value are:
0 60-80% of all visibility reduction is occurring in those 15 m (according to this study).
0 It is quite easy to calculate directly from record-ings without the need for a computer.
34
o It simulates well the visibility seen by an over-taking car driver 10 m behind the spray-generating
vehicle, except for the windscreen effect. The drawbacks are:
0 The 15 m measuring distance meamsthat less resolu-tion is obtained concerning how spray is distributed longitudinally.
o It gives no information about other positions
relative to the vehicle.
0 The maximum value is sensitive to big quantities of splash close to the vehicle but less sensitive to fine spray persistent a long distance behind the
vehicle.
0 It is extremely sensitive to side wind.
As a test, the data obtained in this project were
recal-culated using an averaging distance of 15 m for all
three measurements (two sides and transversal). The maximum total visibility reductions over 15 m have been calculated, and called "15 m peak value".
8.2 The influence of secondary variables. Correction
proce-dure
Variables having a secondary influence on the spray measurements are vehicle speed, water depth, wind speed,
wind direction and ambient illuminance.
The nominal speed was 80 km/h. Deviations from this
will mean a different spray generation. Corrections
for deviations from the nominal speed were included in the analysis.
The correction factor is calculated from:
light transmission loss no(speed)3
This is an approximation founded on both earlier find ings (ref /l/) and results reported in chapter 9.
The measurement program implied that the control truck was run almostsinmltaneouslyv th.the test truck. As there were 9 different test series in which the control truck was used,ealot of similar measurements were made. Ideally, the result should be the same for all the test series concerning the control truck. In practice, there
were,however, statisticalhysignificant differences, e.g.
the average spray reduction in transversal direction
was 2,24% in one test series and 1,74% in another,
notwithstanding the tested equipment was exactly the same. This is clear evidence that there were systematic "errors", as had been expected from earlier experience. Certain secondary variables like wind, illuminance
(daylight) and water depth were impossible to control adequately, so they were measured with the intention to eventually correct for their variations.
As a method for establishing the influence of the second-ary variables, multiple linear regression was used. The measured average for the control truck for each test series was taken as one observation. As dependent vari able was used the visibility reduction (in %) in trans-versal (T) resp. side direction (S). As independent
variables were used
Illuminance B lux
Water depth D mm
. left wheel track water depth in right wheel track Q
Wind speed in driving direction W m/s The result showed (see chapter 9.1.6) that systematic
influence of B, D and W could be traced. Consequently, VTI REPORT NO. 199A
36
corrections were made for variations in those variables between the different spray tests. The corrections were normalized to the conditions given below which were
taken as "ideal": 3.-Reference Corrections condition AT [%/8 m:l AS [%/2 m]
B
60000 lux
5,5-10'6(B 60000)
0,8-10'6(B-60000)
D
1
mm
1,2 (D-l)
O,l3(D-l)
w
0
m/s
0,063-W
0,0l6-W
The residuals from the multiple regression analysis were
also correlated to side wind, but no influence could
+l,2
_l,7 m/s). On the other hand, there is a clear correlation (p<l,5%)
be traced (side wind component was max
between the residuals of the T and S values, so there
is a remaining systematic influence which has not been possible to trace to any measured variable. Supposing the influence is the same for the test and control
trucks within each test series, this systematic error
is eliminated when values are normalized with respect
to the control truck as in table 5.
8.3 Subjective estimations from photographs
A subjective evaluation based on photographs was made with the twofold purpose of classifying the spray
protectors subjectively,eu3well as investigating the correlation between subjective estimations and
objec-tive measurements.
Pairs of photographs were prepared. Every photograph was taken at the same position i.e. from a point 65 m behind the vehicle, see fig 3. Each pair corresponded to a subsequent passing of the control and test trucks with ca 30 s between. Illuminance as well as other
conditions were therefore similar within each pair. VTI REPORT NO. 199A
For each test series, selection of photograph pairs
was based on the same principles as the analysis of measurements, see chapter 6.6. This, together with the availability of photographs (not every run was photo-graphed), resulted in 6 - 10 accepted pairs for each
test series.
10 well educated men with absolutely no previous
knowledge about the spray project were instructed to
judge the "spray intensity" of the left photograph in relation to the right of each pair. Two trucks, or protectors, were thus compared. All details revealing the spray protector type was camouflaged. Only splash and spray ca 0,5 m above road level was visible. The order of photographs (left-right and test series) was
randomized.
The obtained values showed, as ref /l/, that the
subjects judged the ranking between spray protectors consistently but differed in the estimation of the
magnitude of the improvement. To overcome this, a
normalization was made with respect to the reference value of 100% (= both photographs judged similar) and the variability in the judgements between different subjects:
gi Y.- - 100 = (X.. - lOO) -ij ij
s.1
Y.. = the normalized estimation for subject i in13 . . . estimation of spray protector j (%)
ij = the original estimations (%)
si = standard deviation of all estimations by subject i
6i = average standard deviation for all subjects
38
9 EXPERIMENTAL RESULTS
9.1 Measurements
9-1-1
§E§Ei§l_sistri922i92_92£ys§
Figures l7-26 show the spatial distribution along and behind the vehicles as described in 8.1.1. The vertical scale is the visibility reduction,cn:light transmission loss,j11the positions according to fig 1 and 16. The heavy lines in the figures l7- 26 are the curves for
the test truck equipped with standard spray protectors.
The amplitude have beennormalized with respect to
ambient conditions according to 8.2. It means that the
compared curves represent different spray protectors
on the same vehicleXE uihaving similar ambient condi
tions.
9 1-2
l29_m_§ys£s9s§_9£_§9£§y
Table 4 gives the average visibility reduction, or
transmission lOSS;C M Tthe 120 m averaged distances.
The values given are absolute, while in table 5 they have been calculated in relation to the control truck
measurement (ST(f3 in the respective test series. As
discussed in 8.2 this eliminates some systematic errors. A remaining systematic error is the influence of the vehicle, but by using the standard protectors tested
on the test truck (ST 1) as a reference, also this
"error" is eliminated. For a summary of the result, see fig 27, and table 8 in chapter ll.
X Except for MB compared to BS.
Eresrims§22l_§222£§sy
The inaccuracies consist of systematic errors, which
influence is known and controlled, and random errors.
Systematic errors have been eliminated as far as possible according to the procedures described above. Random errors can be estimated from the spread in data
within each test series, and table 4 includes the 95%
confidence limits so obtained. The values given in
fig 27 and table 8 should be about lO% units different in order to be statistically significant on the 5% risk
level.
This estimation of random errors is conservative since the corrections for wind, water depth and illuminance were made on the averaged values. Had they been made directly on the value for each particular run, the resulting random error calculation would have given a considerably smaller errorX. It was however too time consuming to make this recalculation.
X Probably halved
40
[%/8 m]
20 Matning tvars korriktning
T Meas. transversal to driving direction
J c: '1 o 'H m d U) "-1 0153c m H cc m i o.u :5. 10-o.um.: c m . o-H -r'-|r-4 U) Ui H 4 .H O E m c c o -M-H H u u o (D :1 an arc 4 10) cam r V V V V V 1 T I 20 40 60 80 100 I r 12rO [m1 Avstand efter fordon Distance behind vehicle
[%/2 m] Matning langs fordonets sidor 8- Meas. along sides of the vehicle
64 41 J 2.
31:1
M r 1 T I I r:4»
r t r t ; * o 20 4o 60 80 100 120 gAvsténd efter fordon Distance behind vehicle
Figure 17. Sténkutbredningskurvor
Spatial distribution curves for spray --- Standardstankskydd/Standard spray
protectors
Typ/Type ST 0
[%/8 m]
20 Matning tvars korriktning
w Meas. transversal to driving direction
a I o a m 1 m "-1 08 c m .Hg '1 c m Oak: ,5- 10 U-u m.: c m . 0-H Hr m m¢4 . .HO
5c
CO q M-H H.u u o m a . arc «'10) ham 0 20 40 6O 80 100 120 03Avsténd efter fordon
Distance behind vehicle
[6/2 m] Matning langs fordonets sidor 8' Meas. along sides of the vehicle
64
0
20
40
6O
80
100
120
g
Avstand efter fordon Distance behind vehicle
Figure 18. Stankutbredningskurvor
Spatial distribution curves for spray
Standardstankskydd/Standard spray
protectors
Typ/Type GW 1
42 [%/8 m]
20. Matning tvars korriktning
Meas. transversal to driv1ng direction
a o ".1 m I m -r-i me a m . H sc m o.u 5' 10-©.um.£ : m . o-H.a U2 (nu-4 a ".10 E m c c o -m.a H-U u om s . o'o ~m<D cam T I T T I U V U I 20 4o 60 80 100 120 [d
Avstand efter fordon
Distance behind vehicle
[%/2 m] Matning langs fordonets sidor 8' Meas. along sides of the vehicle
61
0 20 4o 60 80 100 120 g
Avstand efter fordon Distance behind vehicle
Figure 19. Stankutbredningskurvor
Spatial distribution curves for spray --- Standardstankskydd/Standard spray
protectors
Typ/Type GW 2
[%/8 m]
Matning tvars korriktning
20 Meas. transversal to driving direction
c: '1 o -.-I m 1 m -.-I 018 a m . a c c m 04H
5
10-6-Hm.: c m . 0-H HH 0 ) mLH . .,.g 0E:
c o -6-H u.» u o m s . 5'0 «'30) ham 0 20 4o 60 80 100 120 QAvstand efter fordon
Distance behind vehicle
[%/2 m] Matning langs fordonets sidor 8' Meas. along sides of the vehicle
6-o
20
4o
60
80
100
120
g
Avstand efter fordon Distance behind vehicle
Figure 20. Stankutbredningskurvor
Spatial distribution curves for spray --- Standardstankskydd/Standard spray
protectors
Typ/Type GW 3
44
[%/8 m]
20 Matning tvars korriktning
l Meas. transversal to driving direction
a O l
a
i
U\E c m 4 H c c m 04H5
lo-U-H m.: c m . o-H Hr i m mu4 .HO5:
c o -M-H H.u u 0 {0:5 . 5'0 «'50) Ac: 0 20 4o 60 80 100 120 EdAvstand efter fordon
Distance behind vehicle
[%/2 m] Matning langs fordonets sidor 8' Meas. along sides of the vehicle
61
o 20 4o 60 80 100 120 g
Avstand efter fordon Distance behind vehicle
Figure 21. Stankutbredningskurvor
Spatial distribution curves for spray Standardstankskydd/Standard spray
protectors
Typ/Type
Ml
[%/8 m]
Matning tvérs korriktning
20W Meas. transversal to driving direction
a I o H m d U] -H m E c m . H c c m
24::
zm lO p.u m.c : m r o-H "-4 .--a U) mu4 . H o E m c c o -6-H u.u u 0 U) :3 . 5's «"1 (1) ham 0 20 4o 60 80 100 120 [m]Avsténd efter fordon
Distance behind vehicle
[%/2 m] Matning langs fordonets sidor 8' Meas. along sides of the vehicle
6.
o 20 4o 60 80 100 120 [m]
Avsténd efter fordon Distance behind vehicle
Figure 22. Stankutbredningskurvor
Spatial distribution curves for spray Standards tankskydd/Standard spray
protectors
Typ/Type M 2a
46
[%/8 m]
20 Matning tvars korriktning
Meas. transversal to driVing direction
a o ".1 m d U) H mE a m r H c c m o.u .54 10-U-U m.: c m o-H -v-|r-4 U) [Du-l d .20 m c c o -m-H u.u u 0 m5 1 9'0 ~ 0) I I o 20 4o 60 80 100 120 b
Avsténd efter fordon
Distance behind vehicle
[%/2 m] Matning langs fordonets sidor 81 Meas. along sides of the vehicle
1
61
o 20 4o 60 80 100 120 g
Avstand efter fordon Distance behind vehicle
Figure 23. Stankutbredningskurvor
Spatial distribution curves for spray Standards tankskydd/Standard spray
protectors
Typ/Type M 2b
47 [%/8 m]
20W Mitning tvars korriktning
Meas. transversal to driving direction
L j us t r a n s m i s s i o n s d a m p n i n g R e d uc t i o n o f l i g h t t r a n s mi s s i o n o 20 4o 60 80 100 120 0d
Avstand efter fordon Distance behind vehicle
[%/2 m] Natning langs fordonets sidor 8* Meas. along sides of the vehicle
6-o 20 4o 60 so 100 120 Dd
Avsténd efter fordon Distance behind vehicle
Figure 24. Stankutbredningskurvor
Spatial distribution curves for spray _ Standards tankskydd/Standard spray
protectors
Typ/Type M 2c
48 [%/8 m]
20 Matning tvars korriktning
Meas. transversal to driving direction
a 1 o -v-i m 1 m H mi c m . a c c m
2*:
:m 10-©.u m.: c m . o-H -HH U) th . .HO5:
c o -M-H H«U u o 01:3 a :ro 4-10) gm 0 20 4o 60 80 100 120 [dAvstand efter fordon
Distance behind vehicle
[%/2 m] matning langs fordonets sidor 8 Meas. along sides of the vehicle
6-o 20 40 6O 80 100 120 g
Avstand efter fordon Distance behind vehicle
Figure 25. Stankutbredningskurvor
Spatial distribution curves for spray --- Standardstankskydd/Standard spray
protectors
Typ/Type M 3
Matning tvars korriktning
Meas. transversal to driving direction
[%/8 m] 20W g 1 O H m d m H owe C0) .4 HS CM 043-! 54 10% "OJ-J 01.: GO . q 0-H «+H m mua . HO
5:
GO -(UH H-H u om s . D'U rad) 1 19. . 0 n [%/2 m] 8. r i T r I t T f i 100 120 [m]Avstand efter fordon Distance behind vehicle
Matning langs fordonets sidor Meas. along sides of the vehicle
Figure 26.
VTI REPORT NO. 199A
40 100 120
[m]
Avsténd efter fordon Distance behind vehicle
Stankutbredningskurvor
Spatial distribution curves for spray
_ Standards tankskydd/Standard spray
protectors Typ/Type MB
50
Table 4. Measured visibility reductions. Values are
norma-lized to 1,0 mm water depth, 80 km/h, 0 m/s wind
speed and 60000 lux illuminance. All comparisons with standard truck ST 0 give statistically signi
ficant differences (<5% risk level) except those
marked "+". Values are expressed as:
Transverse direction: % light transmission loss between points 8 m apart. Average over 4-124 m behind the vehicles.X
Side direction: % light transmission loss between points 2 m apart. Average of left and right side of vehicle. Average calculated over 0-120 m along the sides of the vehicles.
Visibility reduction caused by spray
Meas. direction: Meas. direction:
Spray prOteCtor type Transversal Sides
Average Confidence Average Confidence
[%/8 m] interval [%/2 In] interval
ST 1 2,50 0,14 0,939+ 0,076 ST 0 2,27 0,10 0,860 0,054 GW l 1,74 0,23 0,701 0,108 ST 0 2,26 0,28 0,853 0,086 GW 2 1,85 0,22 0,753 0,084 ST 0 2,31 0,16 0,873 0,075 GW 3 2,05+ 0,20 0,819+ 0,092 ST 0 2,24 0,22 0,835 0,117 M.1 1,84 0,11 0,763 0,060 ST 0 2,28 0,18 0,843 0,044 .M 2 test a 1,95 0,16 0,906+ 0,070 ST 0 2,30 0,11 0,865 0,050 M.2 test b 1,76 0,16 0,657 0,041 ST 0 2,15 0,12 0,840 0,055 M.2 test C 1,92 0,11 0,661 0,043 ST 0 2,20 0,09 0,823 0,068 M.3 1,85 0,08 0,692 0,059 ST 0 2,25 0,09 0,853 0,069 MB 2,14 0,15 1,423+ 0,093 BS 2,58 0,29 1,507 0,139 x MB and BS: 6-126 m VTI REPORT NO. 199A
51
Spray intensity expressed as the quotient
between tested type and control truck (ST 0). Value in side direction is average of left
and right side. Normalized values. Observe
that the high value for M 2, test a, in side direction is due to extreme water depth (see Table 5.
table 1). This is also valid to a certain extent for GW 3 and M 1.
Spray intensity for tested type in Compared spray relation to control truck ST 0
protector types
Meas. direction: Meas. direction:
Transversal Sides ST 1 / ST 0 1,101 1,092 GW 1 / ST 0 0,767 0,822 GW 2 / ST 0 0,802 0,863 GW 3 / ST 0 0,914 0,981 M 1 / ST 0 0,808 0,905 M 2 / ST 0 test a 0,849 1,047 M 2 / ST 0 test b 0,819 0,782 M 2 / ST 0 test c 0,875 0,803 M 3 / ST 0 0,820 0,811 MB / BS 0,829 0,944
Left bar (shadowed): Transversal measurements
Right bar Side measurements
Improvement relative to standard protectors
(%)
30 q 20- : ST() ::13 m011
Figure 27. Improvement in efficiency relative to the standard protectors(=type BS for MB; type ST 1 for the others). Values are based on table 4. M2 is based on the average of tests M 2 b and M 2c
52
9 1-4 QQTEEEE§QE_§§EW§§E_l§_T_E§§E_§E§_£29_T_§Y§£§9§_2§19§§
See fig 28 for typical spray distribution curves when a measuring distance of 15 m is usedx. Considering the
side (S) and transversal (T) measurements, the
follow-ing comparisons can be made:
0 Standard deviation for S15 (15 m peak value) is 10% higher than for 8120 (120 m average value).
0 Standard deviation for T15 is 30% higher than for
T120'
0 If only left side measurements are considered, the
standard deviation increases that much, that most
comparisons are meaningless. This is caused by the combined effect of smaller air volume over which spray is mea ured (15-0,15-O,15 m3 compared to
2 120.0,15-0,15 m3, see fig 16) and the increased
side wind sensitivity (one side instead of two).
0 The correlation between S15 and Slzois excellent,
see fig 29. The relation is: 815 = O,OZ+32,2-S120
R = Correl. coeff. = 0,976
0 Using the 15 m peak values instead of the 120 m
average values does not change the result more than
what is within the random errors, with the excep tion of M l and GW 2 which will score ll% units in decreased efficiency.
X In this case the "measuring distance" of 15 m was simulated by averaging the spray distribution curves
over 15 m.
Matning tvars korriktning
Meas. transversal to driving direction
a o -r-l U) U) -v-i owe CU) -H aa m Q H §.u ,U +5 [6/15m]
E???
20--$r4 4 peak = 16% (DU-l .go m g 12 a o (U-r-l . H+J #0 m s 9'0 4-1 4-10) 'qtz f:=2:==l$======aqh o 20 4o 60 80 100 120 kgAvsténd efter fordon
Distance behind vehicle
Matning langs fordonets sidor Meas. along sides of the vehicle
V sida/l side - --- h sida/r side
so 100 120 g
Avstand efter fordon
Distance behind vehicle
Figure 28. Spatial distribution curves for spray, measuring distance 15 m. Type M2 b, run no. 01
54
(D
I
: . 1 u 120
0.6 0.8 1.0 1.2 1.4 (%/2m)
Fig 29. Correlation between the maximum viSibility reduction measured over 15 m £815) and the average measured over 120 m (8120). Left and right sides averaged.
9-1-5
§E§§§-l§§l2§2§§
It has often been anticipated that spray is related to speed as:
visibility relation \a(speed)eXp'
The speed influence was tested for the test truck(ST l)
which was run at both 70 and 80 km/h. Table 6 gives the result. It can be seen that a speed exponent of 3,0 is a reasonable approximation, which is also in line with ref /l/ where 3,13 was obtained. By studying spatial distribution curves it can be seen that splash (heavy drOplets close to the vehicle) is quite unaffected by speed while spray at longer distances is dramatically affected by speed.
Table 6. Speed influence
visib. reduction at 80 speed visib. reduction at 70 exponent
Transversal measurement 1,48 2,93
Side measurement 1,46 2,83
£2£l2§22§-9£-§@§i§22_992§lfiees
The result frcml the linear multiple regression ana-lysis mentioned in 8.2 was as follows:
Transversal measurement
A statistical significant correlation was obtained
for T an; a function of B, W and D. The influence of
Q was not significant.
Regression equation: T = 3,78-5,5-10-6-B-l,2-D-0,063~W R = 0,96
Residual standard error = 0,06 Standard error of raw data = 0,17
Average T = 2,04
Inclusion of B, D and W decreases the error of T from 0,17/2,04 to 0,06/2,04 3%. The residual error is
approximately equal to that obtained from random
x . . . ~
errors Within a test series (~3%).
Side measurement
A statistical significant correlation was obtained for S as a function of W. B and D gave a weaker correla-tion, but are included to be compatible with the regres
sion for T:
6
Regression equation: S = l,022-0,8-lO_ -B-0,l3 -D-«-0,016'W
R = 0,85
Residual standard error = 0,020 Standard error of raw data = 0,029
Average T: 0,821
Inclusion of B, D and W decreases the error of S from
0,029/0,821 to 0,020/0,821 25%. The residual error
then is of the same magnitude as the random error
X standard deviation of the average
56
within a given test series (which is about 3%). See further the discussion in 10.1.
The influence of side wind was statistically insigni-ficant as long as the conditions in chapter 6.6 when fulfilled, left and right sides were averaged, and concerning entire test series, where the average side wind was maximum 1,7 m/s (see table 1).
9 1-7
Tailgsass-9E_w22§£_§§92h_92_E£92s229£_§ifisisasy
During the several hundred runs that were made with
the heavy vehicles on the watered track, there were
increasingly deeper ruts in the pavement which eventu-ally increased the water depth in the wheel tracks to unwanted values. This led to the decision to move the track laterally to reestablish the correct water depth. The protector types that suffered from the "abnormal" water depth were GW 3, M l and M 2 (only test a). It was noticed that the efficiency in side direction was
influenced negatively by this, which is seen in fig 30, comparing protector type M 2 tested with 1,6 mm water in left track (test a), respectively 1,2 mm in left track (test b). As the spray is more intense for the higher water depth only very close to the vehicle,
the reason is believed to be an excessive generation
of heavy droplets originating from side splash.