http://www.diva-portal.org
Postprint
This is the accepted version of a paper published in IET Software. This paper has been
peer-reviewed but does not include the final publisher proof-corrections or journal pagination.
Citation for the original published paper (version of record):
Ahmed, B S., Gargantini, A., Zamli, K Z., Yilmaz, C., Bures, M. et al. (2019)
Code-Aware Combinatorial Interaction Testing
IET Software
https://doi.org/10.1049/iet-sen.2018.5315
Access to the published version may require subscription.
N.B. When citing this work, cite the original published paper.
"This paper is a postprint of a paper submitted to and accepted for publication in IET
Software and is subject to Institution of Engineering and Technology Copyright. The copy of
record is available at the IET Digital Library".
Permanent link to this version:
IET Research Journals
Submission Template for IET Research Journal Papers
Code-Aware Combinatorial Interaction
Testing
ISSN 1751-8644 doi: 0000000000 www.ietdl.org
Bestoun S. Ahmed
1,2∗, Angelo Gargantini
3, Kamal Z. Zamli
4, Cemal Yilmaz
5, Miroslav Bures
2, Marek
Szeles
21Department of Mathematics and Computer Science, Karlstad University, 651 88 Karlstad, Sweden
2Department of Computer Science, Faculty of Electrical Engineering, Czech Technical University, Karlovo nam. 13, Prague, Czech Republic
3Department of Management, Information and Production Engineering, University of Bergamo, Italy
4Faculty of Computer Systems and Software Engineering, University Malaysia Pahang
5Faculty of Engineering and Natural Sciences, Sabanci University, Istanbul, Turkey
* E-mail: bestoun@kau.se
Abstract: Combinatorial interaction testing (CIT) is a useful testing technique to address the interaction of input parameters in
software systems. In many applications, the technique has been used as a systematic sampling technique to sample the enormous possibilities of test cases. In the last decade, most of the research activities focused on the generation of CIT test suites as it is a computationally complex problem. Although promising, less effort has been paid for the application of CIT. In general, to apply the CIT, practitioners must identify the input parameters for the Software-under-test (SUT), feed these parameters to the CIT tool to generate the test suite, and then run those tests on the application with some pass and fail criteria for verification. Using this approach, CIT is used as a black-box testing technique without knowing the effect of the internal code. Although useful, practically, not all the parameters having the same impact on the SUT. This paper introduces a different approach to use the CIT as a gray-box testing technique by considering the internal code structure of the SUT to know the impact of each input parameter and thus use this impact in the test generation stage. We applied our approach to five reliable case studies. The results showed that this approach would help to detect new faults as compared to the equal impact parameter approach.
1 Introduction
Modern software systems are increasingly getting large in terms of size, functionality, input parameters, and configurations. The differ-ent interaction (combinations) of input parameters or configurations may cause faults while running the system. Kuhn et al. [1] reported many interaction faults in mission-critical and other software sys-tems. Combinatorial interaction testing (CIT) (sometimes called t− way testing, where t is the interaction strength) offers a sam-pling strategy that can effectively and efficiently sift out only fewer interactions to equate the otherwise impossible exhaustive testing of all interactions. To generate the CIT test suite, covering arrays were used to sample the inputs of the SUT based on the input interaction coverage criteria. This approach has been used for input combina-tion and configuracombina-tion testing as a black-box approach. To sample the input parameters in the combinatorial input testing, each row in the covering array represents a complete set of input to the software-under-test (SUT), while each row in configuration testing represents a configuration setting of the SUT [2]. In both cases, the testing pro-cess is done as black-box testing where the internal code is not used during the test generation.
While the black-box approach with the CIT is useful in many applications, not all the test cases are equally effective in finding faults, especially in the input parameter CIT testing [3, 4]. The cur-rent test case generation algorithms do not consider the parameter impact on the SUT. In fact, CIT is generally used as a black-box test-ing strategy. Practically, not all the input parameters have the same impact on the internal code structure of the SUT. One way of defin-ing the effect of a parameter is to consider those parameters that cover more lines of code to have more impact. Considering those parameters to generate or refactor the generated test cases may lead to a more practical CIT.
In this paper, we argue that CIT could be more useful when it also considers the internal code of the SUT. Here, we propose to mix black-box testing with white box testing (i.e., gray-box testing approach) where we extend CIT by reusing the information that is
coming from the code. We introduce our code-aware approach to generate combinatorial interaction test suites. The approach relies on the generation of more effective test suites by considering the internal code structure of the SUT through the feedback from the code coverage analysis. Here, the test generation process relies on a preassessment and analysis of the internal code structure of the SUT to know the sensitivity for each input parameter and thus know-ing the impact of each one of them. By understandknow-ing this impact, then, instead of using uniform interaction strength among the input parameters, we put more focus on those impacted parameters by considering higher or even full interaction strength. Hence, we use mixed strength instead of uniform strength. Our aim is to generate more effective test cases (in term of better fault detection capability and new fault finding) by identifying those input parameters which practically affect the SUT.
The rest of this paper is organized as follows. Section 2 gives the literature background of the CIT and essential concepts of the test-ing and generation algorithms. Section 3 illustrates our method in this paper including the analysis and testing procedures. Section 4 illustrates our empirical investigation of the code-aware combinato-rial interaction testing approach, including the results and discussion. Section 5 discusses possible threats to validity. Finally, Section 6 gives the concluding remarks of the paper.
2 Basic Concepts and Literature
2.1 Basic Concepts
Theoretically, the combinatorial test suite depends on a well-known mathematical object called Covering Array (CA). To represent a test suite, each row in the CA presents a test case and each column represents an input parameter of the SUT. Formally, a CAλ(N ; t, k, v)is an N × k array over (0, ..., v − 1) such that
every B = {b0, ..., bt−1} is λ-covered and every N × t sub-array
contains all ordered subsets from v values of size t at least λ times, IET Research Journals, pp. 1–10
c
The Institution of Engineering and Technology 2018 1
where the set of column B = {b0, ..., bt−1} ⊇ {0, ..., k − 1} [5, 6].
In this case, each tuple is to appear at least once in a CA.
When the number of component values varies, this can be handled by Mixed Covering Array (MCA). A MCA(N; t, k, (v1, v2, ..., vk)),
is an N × k array on v values, where the rows of each N × t sub-array covered and all t interactions of the values from the t columns occur at least once. For more flexibility in the notation, the array can be presented by MCA(N; t, vk1
1 v k2
2 ..vkk).
In real-world complex systems, the interaction strength may vary between the input parameters. In fact, the interaction of some input parameters may be stronger than other parameters. Variable strength covering array (VSCA) is introduced to cater for this issue. A V SCA(N; t; k, v, (CA1, ..., CAk))represents N × p MCA of
strength t containing vectors of CA1to CAk, and a subset of the k
columns each of strength > t [7, 8]. Also, practically, not all the inputs are interacting and having an impact on each other. Some parameters may not interact at all. Here, it is not necessary to cover all the interactions of the parameter. Presenting those parameters even in one test case would be enough.
2.2 Literature and Motivation
CIT used the aforementioned mathematical objects as a base for the testing strategy of different applications. A wide range of appli-cations appeared in the literature. Mainly, CIT used in software testing and program verification. There are many applications in this direction, for example, fault detection, and characterization [9, 10], graphical user interface testing (GUI) [11], model-based testing and mutation testing [12, 13]. There are many more applications of CIT in software testing. Comprehensive surveys about these applications can be found in [14–16]. The concepts of CIT also finds its way to other fields rather than software testing. For example, it has been used in the satellite communication testing, hardware testing [17], advance material testing [18], dynamic voltage scaling (DVS) opti-mization [19], tuning the parameter of fractional order PID controller [20], and gene expression regulation [21, 22].
In most of the applications, the combinatorial interaction test suite is generated by establishing a coverage criterion. Here, the coverage criterion is to cover the t − tuples of the input parameter at least once to generate the CA. A few researchers in the literature consid-ered some other input attributes during the generation in addition to the t − tuple coverage criteria. For example, Yilmaz [2] con-sidered the test case-specific interaction constraints which are test cases related to the configurations. Demiroz and Yilmaz [23] also introduced the cost-aware covering arrays that generate the test cases based on a given cost function by modeling the actual cost of testing in addition to the standard t − tuple coverage criteria.
Almost, in all applications, the SUT is considered as a black-box system by the generation tool. However, in practice, not all the parameters have the same impact on the internal code of the SUT. Logically, each value of the input parameters may have a different impact on the program. Taking into account the code coverage as an example, those parameters’ tuples with higher code coverage may have a higher chance to cause faults. In this paper, we have consid-ered this situation to take the CIT in a gray-box testing approach by analyzing the program internals.
In practice, the sum of individual parameter code coverage may exceed 100%. This is because two (or more) parameters may impact the same code snippet both at the same time. To illustrate this overlapping issue, let’s assume a hypothetical 5-line program and parameters A and B as shown in Figure 1. Both parameters cover three LOC – parameter A covers lines 2 to 4 and parameter B covers lines 3 to 5. Thus, both parameters cover 60% of the code. Com-bined, however, they obviously cannot cover 120% of the code, but they only cover 4 out of 5 lines together, i.e., 80%. One line, or 20% of the code, in this case, is not covered by any parameter. In practice, these lines would be exceptions, loggers, unused code and sometimes also comments.
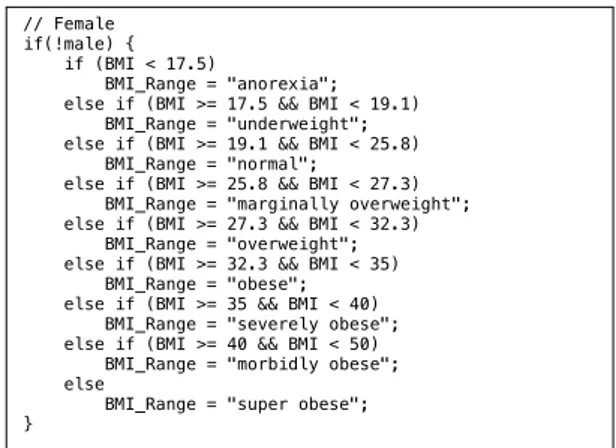
As a practical example, note in Figure 2 the code snippet from the case study (BMI calculator) that we used in this paper. The whole code snippet is affected by the value of the Boolean variable "male" –
Using parameter strength analysis in combinational testing Marek Szeles, CTU in Prague
Page 1 of 14
1 Theory
1.1 Overlaping parameter code coverage strength
The sum of individual parameter code coverages may exceed 100%. This is because two (or more) parameters may impact the same code snippet both at the same time. Let’s assume a hypothetical 5-line program and parameters A and B. Both parameters cover three lines – parameter A covers lines 2 to 4 and parameter B lines 3 to 5. Thus, both parameters cover 60% of the code. Combined however, they obviously cannot cover 120% of the code, but they only cover 4 out of 5 lines together – 80%. One line, or 20% of the code lines in this case, is not covered by any parameter – in practice, these lines would be exceptions, loggers, unused code and sometimes also comments.
Figure 1: Overlapping parameter code coverage demonstration on a hypothetical 5-line program As a practical example, see below a code snippet from the third case study, the “BMI calculator”. The whole code snippet is affected by the value of the Boolean variable male - it is executed only if it is false (i.e. female). However, within it, there is an if-else switch based on the value of the double variable BMI – based on which, different lines of code are activated, effectively changing the value of BMI_Range. Thus, most lines of code in this code snippet are affected by both the variables BMI and male.
// Female if(!male) { if (BMI < 17.5) BMI_Range = "anorexia"; else if (BMI >= 17.5 && BMI < 19.1) BMI_Range = "underweight"; else if (BMI >= 19.1 && BMI < 25.8) BMI_Range = "normal"; else if (BMI >= 25.8 && BMI < 27.3) BMI_Range = "marginally overweight"; else if (BMI >= 27.3 && BMI < 32.3) BMI_Range = "overweight"; else if (BMI >= 32.3 && BMI < 35) BMI_Range = "obese"; else if (BMI >= 35 && BMI < 40) BMI_Range = "severely obese"; else if (BMI >= 40 && BMI < 50) BMI_Range = "morbidly obese"; else
BMI_Range = "super obese"; } • Line 1 Whole program source code • Line 2 • Line 3 • Line 4 • Line 5 Covered by parameter A Covered by parameter B
Fig. 1: Overlapping parameter code coverage demonstration on a
hypothetical 5-line program
// Female if(!male) { if (BMI < 17.5)
BMI_Range = "anorexia"; else if (BMI >= 17.5 && BMI < 19.1) BMI_Range = "underweight"; else if (BMI >= 19.1 && BMI < 25.8) BMI_Range = "normal";
else if (BMI >= 25.8 && BMI < 27.3) BMI_Range = "marginally overweight"; else if (BMI >= 27.3 && BMI < 32.3) BMI_Range = "overweight"; else if (BMI >= 32.3 && BMI < 35) BMI_Range = "obese"; else if (BMI >= 35 && BMI < 40) BMI_Range = "severely obese"; else if (BMI >= 40 && BMI < 50) BMI_Range = "morbidly obese"; else
BMI_Range = "super obese"; }
Fig. 2: As sample code snippet for the Overlapping parameter code
coverage
it is executed only if it is false (i.e., female). However, within it, there is an if-else switch based on the value of the double variable BMI – based on which, different lines of code are activated, effectively changing the value of BMI_Range. Thus, most lines in this code snippet are affected by both the variables BMI and male.
3 Method
For this study, we only consider those software systems which can be tested using the CIT approach. Here, the test suite can be represented as a CA with more than two input parameters. Each parameter has different values. We hypothesize that if we measure the parameter strength based on code coverage, we can figure out how much that input parameter has an impact on the SUT. Larger impact means that the parameter covers more lines of SUT code and thus it is more prone to failures. Hypothetically, those parameters may have better fault detection rates. Let X and Y be two parameters of a program Pand let their code coverage CX> CY.
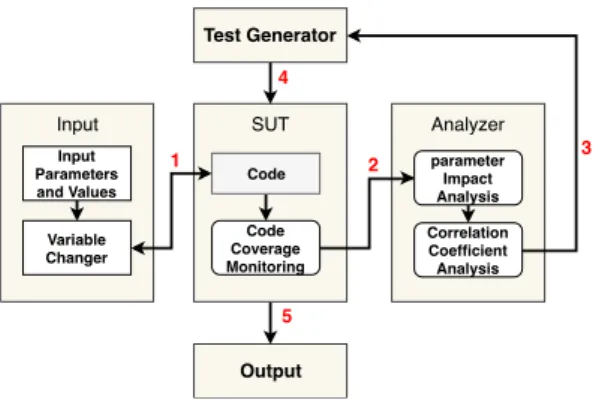
To analyze the parameter impact of each SUT, we have followed several systematic experimental steps. Figure 3 shows these steps.
First (step 1 in Fig. 3) we have identified the parameters and the values and we have called the code with a set of tests. The detail of the test generation method is illustrated in subsection 3.2. Here, we used the conventional t − wise method to generate the set of tests. To avoid the omission of parameters’ values effect on each other, we have tried two different possibilities and combinations of the values. First, we attempted to measure the coverage while we varied the val-ues of a specific parameter and made the rest constant. Second, we also tried different combinations of values. Both approaches lead to the same conclusion as we are using the deviation at the end. Measur-ing the code coverage when we vary the value of a specific parameter (by the Variable Changer in Figure 3) while we make the rest con-stant will lead to conclude the impact of that parameter. However, IET Research Journals, pp. 1–10
2 The Institution of Engineering and Technology 2018c
Auto-generated PDF by ReView
This article has been accepted for publication in a future issue of this journal, but has not been fully edited.IET Software
SUT Code Code Coverage Monitoring Input Input Parameters and Values Variable Changer Test Generator Output Analyzer Correlation Coefficient Analysis parameter Impact Analysis 1 2 3 4 5
Fig. 3: Experimental method
in some situation, the code coverage may be affected by some other values of the other parameters. We considered this situation also to measure the code coverage of two parameters (i.e., pairwise) while making the others constant. Hence, for fair experimental results, we considered all the possibilities of the parameter effects on each other. By measuring the code coverage (step 2 in Fig. 3), we can calculate each parameter impact by measuring the deviation of code coverage when entering different parameter values. For a fair experimental procedure, we used the best and worst code coverage situation as maximum and minimum code coverage. To measure the code coverage, we used an automated scripting framework to moni-tor and measure the impact of each input parameter. To calculate the impact of a parameter, we calculate the code coverage deviation as in Eq 1.
Ip= Cpmax− Cpmin (1)
where Ipis the parameter impact, Cpmaxis the maximum code
coverage of parameter p, and Cmin
p is the minimum code
cover-age of parameter p. The Eq 1 can be used to calculate the impact of pairwise parameters also, which can be used for the correlation coefficient later in Eq 2. To better illustrate the code coverage anal-ysis process, Figure 4 shows a simplified example for a system with three input parameters (X, Y, and Z) where each parameter has two values (1 and 2). For illustration, we assign random numbers to the code coverage for each test case. The aim here is to measure the impact of parameter X. Here, the maximum and minimum code cov-erage of X are 15% and 3% respectively. Parts of these experimental records can be used mutually for the impact analysis of Y and Z also. Here, we consider the pairwise possibilities for the parameter values to consider all the parameters between X and Y, while assigning a constant value to Z (values with "*" sign). To avoid the omission of other values, we also change the constant values for the parameters for each pairwise experiment.
Using this approach to know the impact of the parameters, we can calculate the interaction weight by calculating the correlation of the parameters. For parameters X and Y, the correlation would be as in Eq.2:
Corr(X, Y ) = IXY
IX∗ IY (2)
where IX and IY are the impact of the parameters X and Y
respectively, and the IXY is the impact of both of them. As
men-tioned previously, we have undertaken a careful code coverage monitoring to isolate the effects.
Now, with this correlation, for each tuple of parameters, we create an n × n square matrix, where n is the number of parameters, as in Table 1.
Using the data in Table 1, we can select and device the higher impacted tuples by assigning a partner of each parameter pi, as in
Eq.3.
partner(pi) = arg maxp
j Corr(pi, pj) (3) X Y Z 1 1 *1 1 2 *1 2 1 *1 2 2 *1 X Y Z 1 1 *2 1 2 *2 2 1 *2 2 2 *2 X Y Z 1 *1 1 1 *1 2 2 *1 1 2 *1 2 X Y Z 1 *2 1 1 *2 2 2 *2 1 2 *2 2 Cx 8% 5% 4% 10% Cx 11% 15% 6% 7% Cx 3% 4% 4% 8% Cx 7% 12% 8% 13% Cxmax = 15% Cxmin = 3%
Fig. 4: Code coverage measurement method
Table 1 Conceptual model of parameter correlation mapping
parameter P1 P2 ... Pn
P1 - Corr(P1, P2) ... Corr(P1, Pn)
P2 Corr(P2, P1) - ... Corr(P2, Pn)
... ... ... - ...
Pn Corr(Pn, P1) Corr(Pn, P2) ...
-Note that since the matrix in Table 1 is reflexive and diagonally mirrors itself, the same tuple will be present twice. For example, if the best partner for p1 is p2, then the best partner for p2is p1.
Therefore, this tuple will appear in the matrix both as Corr(p2, p1)
and Corr(p1, p2). Both instances represent the same tuple however.
In practice, one can assign higher interaction strength to not only pairs of parameters, but also a set of three and more. Assigning higher interaction strength to a set of all parameters would result in no comparative change in strength impact between the individual parameter subsets. If one would decide to assign a higher strength to three or more parameters, it can be done in two ways. The first approach is to create a multi-dimensional matrix (n-dimensional for sets of n), and the methodology is the same. Alternatively, it is pos-sible to spot a good set of three candidates in a two-dimensional matrix.
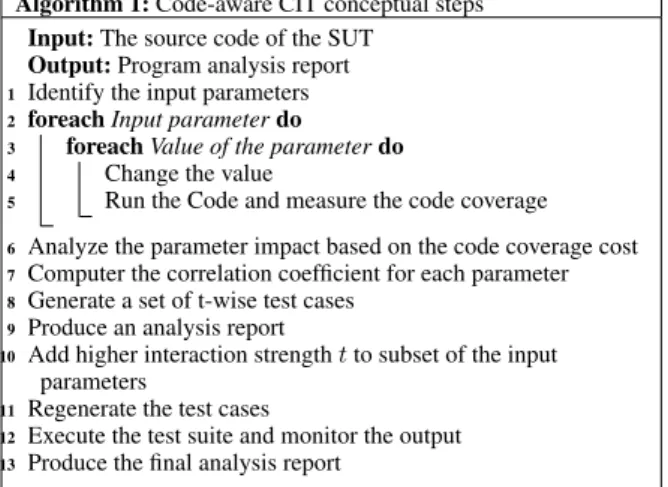
Due to the goal of this paper, we did not pay attention to the execution cost of the test suites. As mentioned previously, we aim to assess the effectiveness of our code-aware CIT approach via an experimental study. Based on this experimental study, these steps can be automated and abstracted to minimize the execution cost for the ease of use in the industry. The pseudo-code in Algorithm 1 describes those essential steps and how they can be executed. The pseudo-code may be used in the future to build a fully automated tool to fulfill these step successfully. We explained the details of the steps we followed in the experiments in the following sub-sections. 3.1 Mutant generation and fault seeding
To analyze the effectiveness of our approach, we generate differ-ent types of mutants to be injected into the subjected programs for experiments. We used µjava∗, the classical java mutation tool, to
generate the mutants. µjava is a mutation system for Java programs. It automatically generates mutants for both traditional mutation testing and class-level mutation testing. µjava can test individ-ual classes and packages of multiple classes. Tests are supplied by the users as sequences of method calls to the classes under test encapsulated in methods in JUnit classes.
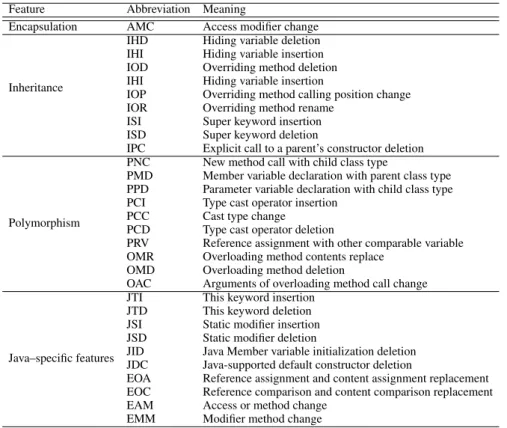
For the fault seeding, we have seeded 35 types of faults, as defined by the µjava documentation. Two levels of faults were used here, method-level faults and class-level faults. Mutants in the
∗https://cs.gmu.edu/ offutt/mujava/
IET Research Journals, pp. 1–10 c
The Institution of Engineering and Technology 2018 3
Algorithm 1: Code-aware CIT conceptual steps Input: The source code of the SUT
Output: Program analysis report
1 Identify the input parameters 2 foreach Input parameter do
3 foreach Value of the parameter do
4 Change the value
5 Run the Code and measure the code coverage
6 Analyze the parameter impact based on the code coverage cost 7 Computer the correlation coefficient for each parameter 8 Generate a set of t-wise test cases
9 Produce an analysis report
10 Add higher interaction strength t to subset of the input
parameters
11 Regenerate the test cases
12 Execute the test suite and monitor the output 13 Produce the final analysis report
Table 2 Types and abbreviation of method-level faults used for the experiments
Abbreviation Meaning
AOR Arithmetic Operator Replacement
AOI Arithmetic Operator Insertion
AOD Arithmetic Operator Deletion
ROR Relational Operator Replacement
COR Conditional Operator Replacement
COI Conditional Operator Insertion
COD Conditional Operator Deletion
SOR Shift Operator Replacement
LOR Logical Operator Replacement
LOI Logical Operator Insertion
LOD Logical Operator Deletion
ASR Assignment Operator Replacement
SDL Statement DeLetion
VDL Variable DeLetion
CDL Constant DeLetion
ODL Operator DeLetion
method-level fault seeding are based on changing operators within methods, or the complete statement alteration. In this analysis, 16 different types are considered. Table 2 shows those method-level faults and the correspondence abbreviations. Mutants based on class-level fault seeding are based on changing operators within methods, or the complete statement alteration. In this analysis, 29 different types are considered. Table 3 shows those class-level faults and the correspondence abbreviations.
3.2 Test case generation
To generate the test cases, we used ACTS3.0∗, the automated CIT tool that contains many algorithms to generate the combinatorial interaction test suites. ACTS is a well-known combinatorial inter-action test generation tool that supports the generation of different interaction strength (1 ≤ t ≤ 6). The tool provides both command line and GUI interfaces. The tool also offers the flexibility to address the interaction strength for different sets and subsets of input param-eters, (i.e., mixed strength and variable strength interaction). To avoid the randomness of the test generation algorithms and to assure fair experiments statistically, we used the deterministic test genera-tion algorithms in ACTS. Since ACTS is a combinatorial testing tool, it requires values of the different input parameters to be tested. Such values were produced by using arbitrary classes of presumed equiv-alence determined by the data type of a parameter and its default value. For example, the values typically tested were the original
∗https://bit.ly/2s2IajU
default value of a parameter, 0, negative input and factor multiples of the value which significantly affected the output, or runtime behav-ior. To assure for reasonable testing runtimes (as described in Section 4, hundreds of mutants were tested for each scenario), no more than five classes of equivalence were used for each parameter.
3.3 Parameter impact analysis
Here, we adopted code coverage monitoring tools in our environ-ment to analyze the code coverage during the first round of test execution. By analyzing the code coverage, we know the impact of the parameters with respect to the code. We adopted Sofya∗Java
bytecode analysis tool for the code coverage analysis. Sofya is a tool designed to provide analysis capabilities for Java programs by uti-lizing the Bytecode Engineering Library (BCEL) to manipulate the class files. We have also used the base JetBrains†IntelliJ IDE for the
code coverage measurement. The first round takes several iterations depending on the input parameters and the value of each one of them. As previously mentioned, the program examine each parameter to identify Cmax
p and Cpminin Eq.1.
4 Empirical investigation
In this section, we illustrate our empirical investigation. Here, five software subjects were used as case studies for the investigation. We first describe these case studies and then the fault injection and code analysis procedures. During this empirical investigation, we aim to answer three main research questions (RQ)s:
• RQ1: To which extent the input parameters affect the internal code of the SUT?
• RQ2: How the input parameters are correlated?
• RQ3: How does the new approach improve the effectiveness of fault detection in the CIT?
4.1 Case studies
We chose five Java-based subject programs for the experiments. Two programs from Software-artifact Infrastructure Repository (SIR)‡
and three programs from other reliable software repositories. These programs are well-known experimental programs used for experi-mental purposes in other research studies. We choose "Replicated workers", "Groovy", "Body calculator§", Searching¶, and
Mort-gagekfor the case studies.
The replicated workers is an implementation of a standardized Replicated Workers problem. In some parallel algorithms, the num-ber of specific computing tasks is not known in advance. To control the allocation of the tasks of the replicated workers, a work pool is used. The replicated workers program has 342 lines of code. The groovy snippet is a part of the core for Apache Groovy, a multi-faceted language for the Java platform. The groovy program has 361 lines of code. The body calculator application/applet is a medical program used for fat percentage, body mass index, Basal Metabolic Rate, Ideal Weight, and Calorie Intake. The body calculator pro-gram has 910 lines of code. The Searching propro-gram implements several sorting algorithms and sorts of a randomly generated input matrix based on a set of constraining input parameters. The search-ing program has 1084 lines of code. The Mortgage program is a GUI implementation of a mortgage amortization table calculator based on several user-defined inputs. The Mortgage program has 1045 lines of code. ∗http://sofya.unl.edu/ †https://www.jetbrains.com/ ‡http://sir.unl.edu/portal/index.php §https://bit.ly/2rrUolM ¶https://bit.ly/2HVxBKJ khttps://bit.ly/2HRZSBP
IET Research Journals, pp. 1–10
4 The Institution of Engineering and Technology 2018c
Auto-generated PDF by ReView
This article has been accepted for publication in a future issue of this journal, but has not been fully edited.IET Software
Table 3 Types and abbreviation of class-level faults used for the experiments
Feature Abbreviation Meaning
Encapsulation AMC Access modifier change
Inheritance
IHD Hiding variable deletion
IHI Hiding variable insertion
IOD Overriding method deletion
IHI Hiding variable insertion
IOP Overriding method calling position change
IOR Overriding method rename
ISI Super keyword insertion
ISD Super keyword deletion
IPC Explicit call to a parent’s constructor deletion
Polymorphism
PNC New method call with child class type
PMD Member variable declaration with parent class type
PPD Parameter variable declaration with child class type
PCI Type cast operator insertion
PCC Cast type change
PCD Type cast operator deletion
PRV Reference assignment with other comparable variable
OMR Overloading method contents replace
OMD Overloading method deletion
OAC Arguments of overloading method call change
Java–specific features
JTI This keyword insertion
JTD This keyword deletion
JSI Static modifier insertion
JSD Static modifier deletion
JID Java Member variable initialization deletion
JDC Java-supported default constructor deletion
EOA Reference assignment and content assignment replacement
EOC Reference comparison and content comparison replacement
EAM Access or method change
EMM Modifier method change
4.2 Experimental procedure
To follow the methodology given in Section 3, we have created two sets of test cases for each case study – one reference set without parameter impact, and another set using our approach by consid-ering the parameter impact. To know the effectiveness, we have seeded faults into the programs. We run each program with and with-out seeded faults to kill the mutants by recognizing the differences. Based on our approach, we then regenerated the test suites by putting interaction strength on those parameters which are correlated more to each other by considering the correlation coefficient, as illustrated in Table 1. For example, if the correlation coefficient of two param-eters A and B is equal to 0.9, it means they are highly correlated to each other, we put the interaction strength on both of them. On another hand, if the correlation coefficient between the two param-eters C and D is equal to 0.1, it means that the correlation is too low between them, we assign a "don’t care" value for both of them. Hence, they will be presented in the test suites, but we don’t care about the full coverage of their values. We run the newly generated test suite to identify the differences in fault detection.
4.3 The seeded faults
As previously mentioned, we have seeded many faults in each sub-jected program for the case study. Using µjava, we have seeded 295 faults into the Replicated workers program, 160 faults into the Groovy program, 1512 faults into Body calculator program, 1584 faults into Searching program, and 35 faults into Mortgage program. Figures 5 - 9 shows the number and the type of all these faults for each subjected program individually.
4.4 Observations
4.4.1 RQ1. Parameter analysis - the effect on the internal code: Based on the method in Section 3, we have analyzed each
Using parameter strength analysis in combinational testing Marek Szeles, CTU in Prague
Page 10 of 17
4.1.3 Fault seeding
Using μjava, a total of 295 faults were seeded in the code. The faults seeded breakdown can be seen in figure 2.
Figure 2: Faults seeded in case 1
4.1.4 Result analysis
Overall, the combinational testing in this case had slightly better results when using the mixed strength test cases. Compared to number of test cases (and runtime), the difference was more stark, as seen in figure 3.
Figure 3: Faults detected by the test suites in case 1
1 4 7 1 45 10 14 16 4 1 7 102 19 64 0 20 40 60 80 100 120 SDL ODL IOD ASRS VDL CDL COI AOIS ROR JSI JSD Mut ant s AOIU AORB PRV Class Met hod 0 50 100 150 200 250 300 Case 1 278 (94%) 266 (90%)
Mut ant s det ect ed
Mix ed st rengt h
St rengt h 2 New t est cases det ect ed by mix ed st rengt h 16
Fig. 5: Type and number of seeded faults into the Replicated Worker
programUsing parameter strength analysis in combinational testing Marek Szeles, CTU in Prague
Page 12 of 17
4.2.4 Fault seeding
Using μjava, a total of 160 faults were seeded in the code. The faults seeded breakdown can be seen in figure 4.
Figure 4: Faults seeded in case 2 4.2.5 Result analysis
Case 2 had similar results as case 1. The mixed strength test suite had slightly better results, with the difference even smaller here, as seen in figure 4.
2 2 2 2 8 4 6 16 21 3 16 40 19 3 16 0 10 20 30 40 AORS COI AORB ROR AOIS AOIU Mut ant s SDL LOI JTI JID CDL JSI JTD VDL ODL
Met hod Class
0 50 100 150 143 (89%) Case 2 146 (91%)
Mut ant s det ect ed Mix ed st rengt h
St rengt h 2 New t est cases det ect ed by mix ed st rengt h 7
Fig. 6: Type and number of seeded faults into the Groovy program
IET Research Journals, pp. 1–10 c
The Institution of Engineering and Technology 2018 5
Table 4 Replicated workers parameter impact analysis
Parameter Name Type Covered LOC Uncovered LOC Examples
num_workers int 30% 51% (1,2,5) num_items int 8% 73% (1,2,5) min float 4% 77% (1,10,15) max float 4% 77% (1,10,15) epsilon float 81% 0% (0.05,0.1,0.25) Using parameter strength analysis in combinational testing Marek Szeles, CTU in Prague Page 14 of 18 4.3.3 Fault seeding For the testing, two scenarios were considered – scenario A included a smaller set of 131 diverse mutants, and scenario B included a larger set of 1512 mutants, which were more streamlined. Scenario A Figure 6: Faults seeded in case 3, scenario A Scenario B Figure 7: Faults seeded in case 3, scenario B 5 6 21 7 9 4 9 4 31 14 21 0 5 10 15 20 25 30 35 SDL Me t h o d AORB AOIU LOI ODL CDL COI COR COD ASRS AOIS Mut a nt s 5 45 4 162 420 876 0 50 100 150 200 250 300 350 400 450 500 550 600 650 700 750 800 850 900 Mut a nt s AOIS ASRS SDL Me t h o d AOIU AORB CDL
Fig. 7: Type and number of seeded faults into the Body calculator
program
Using parameter strength analysis in combinational testing Marek Szeles, CTU in Prague
Page 11 of 14 Fault seeding
Using μjava, a total of 1604 faults were seeded in the code. The faults seeded breakdown can be seen in figure 10.
Figure 10: Faults seeded in case 4
Result analysis
Overall, the combinational testing in this case had slightly better results when using the mixed strength test cases. Compared to number of test cases (and runtime), the difference was more stark, as seen in figure 11.
Figure 11: Faults detected by the test suites in case 4
64 31 170 8 288 4 49 162 185 43 16 54 3 3 1 7 1 4 1 510 0 10 2030 40 50 60 70 80 90 100 110 120 130 140 150 160 170180190 200 210 220230240250260 270 280 ODL 510 JDC JID JSD JSI JTI OAN OMR VDL COI COR AOIU AOIS AORS AORB LOI SDL CDL ROR Mutants AODU Method Class 0 100 200 300 400 500 600 700 800 900 1 000 1 100 1 200 1 300 1 400 1 500 Mutants detected Case 4 1 346 (84%) 1 482 (92%)
Strength 2 Mixed strength New test cases detected by mixed strength
97
Fig. 8: Type and number of seeded faults into the Searching program
Using parameter strength analysis in combinational testing Marek Szeles, CTU in Prague
Page 13 of 14 Fault seeding
Using μjava, a total of 35 faults were seeded in the code. The faults seeded breakdown can be seen in figure 12.
Figure 12: Faults seeded in case 5 Result analysis
Overall, the combinational testing in this case had slightly better results when using the mixed strength test cases. Compared to number of test cases (and runtime), the difference was more stark, as seen in figure 13.
1 1 9 1 4 19 0 1 2 3 4 5 6 7 8 9 10 11 12 13 14 15 16 17 18 19 Mutants EAM LOI AOIU SDL JSI EMM Method Class 0 1 2 34 5 6 7 8 9 10 11 12 13 14 15 16 17 18 19 20 21 22 23 24 25 26 27 28 29 30 31 32 24 (69%) Mutants detected Case 5 32 (91%)
Strength 2 Mixed strength New test cases detected by mixed strength
8
Fig. 9: Type and number of seeded faults into the Mortgage
calculator program
program. As illustrated in Figure 4, we measured the code coverage of each input parameter in the testing framework. We changed the variable of the input parameter and measured the coverage to know the impact of the parameter on the internal code using Eq.1. For the case studies used in this paper, we double check the results also by manual inspection and reviewing the code of each program. Tables 4
- 8 show the empirical results of the parameter impact analysis using the code coverage.
Knowing the effect of each parameter on the program by trying all of its values gives a precise analysis of the sensitivity of the SUT by each one of them. Here, it is clear that not all the parameters have the same impact on the program. For example, the parameters "epsilon" and "num_workers" have more impact on the replicated workers program as compared to other input parameters as they are covering more LOC. Similarly, the parameters "threadCount" and "neck" have more impact on the Groovy and body calculator programs respectively.
It should be mentioned here that the amount of coverage by each parameter gives the number of LOCs that is related only to that parameter and excluding the related LOCs to the other parame-ters. However, there are still common LOCs related to two or more parameter. Hence, we don’t expect to have full coverage of LOCs by only one or even two input parameters. The full coverage of LOCs is not achievable even with all input parameters. This situation is due to different reasons such as poor programming and development practice of the SUT itself.
4.4.2 RQ2. Correlation analysis - the input parameters’ cor-relation: Using the empirical results from parameter impact anal-ysis, we can calculate the correlation among each tuple of input parameters. We used the standard correlation calculation in statis-tics in Eq. 2 to know the interaction weight between the tuples as described in Section 3. Tables 9 - 13 show the correlation among the tuples of input parameters for each case study.
Analyzing the correlation between the tuples of parameters gives a clear understanding of how each value of these parameters are related to each other and the strength of the relationship. We consider a relationship stronger as the value of the correlation approached to "1". Using this criterion for classification, we can categorize the tuples. For example, the parameters "min" and "num_items" in the replicated workers program are highly related to each other as they have correlation value equal to 1. Similarly, the parameters "threadCount" and "concurrentReads" in the Groovy program are highly related to each other. In contrast, the interaction weight (i.e., relationship) between the "num_items" and "epsilon" parameters is weak. As previously mentioned, we can put higher strength or full strength on those highly-related parameters and free the weakly-related parameters, i.e., marking them as "don’t care" value in the test generation tool. Following this approach, we assure that those highly-related tuples will be fully covered in the test suite while the other tuples will appear in the test suite but not fully covered.
Table 14 shows the size of the generated test suite for each case study after and before the consideration of the impact analysis. It is noticeable that the size of the test suite decreased by a few test cases with the Replicated worker and the Groovy case studies. As we can see, for these two case studies there are a few parameters and not all of them are highly related to each other. As mentioned, during the test generation, we assigned "don’t care" values to those parameters. As a result, the fewer (but effective) test cases were gen-erated. Although it is not the aim of our study, this shows that in some cases our approach could also help to generate efficient test cases by generating fewer test cases.
As for the Body Calculator, searching, and Mortgage case studies, there is a higher number of parameters than the other two case stud-ies. As we can see from the results, those parameters are related to each other. As a result, we considered different interaction strength during generation. Hence, the number of test cases goes higher.
IET Research Journals, pp. 1–10
6 The Institution of Engineering and Technology 2018c
Auto-generated PDF by ReView
This article has been accepted for publication in a future issue of this journal, but has not been fully edited.IET Software
Table 5 Groovy parameter impact analysis
Parameter Name Type Covered LOC Uncovered LOC Examples
threadCount int 35% 8% (0,1,2,8)
DEFAULT_INITIAL_CAPACITY int 5% 38% (0,1,100,1000)
DEFAULT_LOAD_FACTOR float 5% 38% (0,1,10,100)
MAXIMUM_CAPACITY int 4% 39% (0,1,100,1000,10000)
concurrentReads long 6% 37% (0,1,10,1000)
Table 6 Body calculator parameter impact analysis
Parameter Name Type Covered LOC Uncovered LOC Examples
male boolean 1% 32% true,false
age int 2% 32% 0,10,20,50 weight int 2% 31% 0,35,60 waist int 1% 32% 0,30,50 hips int 2% 31% 0,15,30 neck int 16% 17% 0,100,200,400 heightArrayNum int 1% 32% 0,1,3,5
Table 7 Searching program parameter impact analysis
Parameter Name Type Covered LOC Uncovered LOC Examples
Epsilon double 38% 15% 0.00,1.00,1E-8
minInt int 29% 24% 0,1,2,10
maxFrac int 28% 25% 0,1,2,10
minFrac int 28% 25% 0,1,2,10
size int 28% 25% 0,10,100
Table 8 Mortgage parameter impact analysis
Parameter Name Type Covered LOC Uncovered LOC Examples
mortgageAmout int 87% 3% 0,1,1000,1000000 mortgageTerm int 85% 5% 0,12,10000 interest double 85% 5% 0,0.10,1.00 startDate int 78% 12% 0,43500,90000 payment double 18% 72% 0,1,1000 extraMonthly double 7% 83% 0,1,1000 extraYearly double 5% 85% 0,1,10000
Table 9 Replicated workers parameter correlation overview
Correlation num_workers num_items min max epsilon
num_workers - 0.947 0.941 0.941 0.739
num_items 0.947 - 1.000 1.000 0.090
min 0.941 1.000 - 1.000 0.047
max 0.941 1.000 1.000 - 0.047
epsilon 0.739 0.090 0.047 0.047
-Table 10 Groovy parameter correlation overview
Correlation threadCount DEFAULT_INITIAL_
CAPACITY DEFAULT_LOAD_FACTOR MAXIMUM_CAPACITY concurrentReads
threadCount - 0.900 0.925 0.923 1.000 DEFAULT_INITIAL_ CAPACITY 0.900 - 0.500 0.556 0.727 DEFAULT_LOAD_ FACTOR 0.925 0.500 - 0.556 0.727 MAXIMUM_ CAPACITY 0.923 0.556 0.556 - 0.600 concurrentReads 1.000 0.727 0.727 0.600
-Table 11 Body calculator parameter correlation overview
Parameter male age weight waist hips neck heightArrayNum
male - 0.40 0.37 0.45 0.33 0.53 0.50 age 0.40 - 0.94 0.37 0.29 0.51 0.80 weight 0.37 0.94 - 0.34 0.27 0.51 0.74 waist 0.45 0.37 0.34 - 0.97 0.58 0.45 hips 0.33 0.29 0.27 0.97 - 0.50 0.33 neck 0.53 0.51 0.51 0.58 0.50 - 0.53 heightArrayNum 0.50 0.80 0.74 0.45 0.33 0.53
-IET Research Journals, pp. 1–10 c
The Institution of Engineering and Technology 2018 7
Table 12 Searching program parameter correlation overview
Correlation Epsilon minInt maxFrac minFrac size
Epsilon - 0.58 0.61 0.61 0.68
minInt 0.58 - 0.68 0.67 0.70
maxFrac 0.61 0.68 - 0.50 0.71
minFrac 0.61 0.67 0.50 - 0.71
size 0.68 0.70 0.71 0.71
-4.4.3 RQ3. Assessment of fault detection - effectiveness of the new approach: As mentioned previously, we have injected different mutants into each program for possible fault detection. The experiments aim to know the effectiveness of our approach to detect new faults as compared to the classical black-box CIT. Fig-ures 10 - 14 show that, in general, the CIT is an effective approach to detect faults. The figures also show that using our approach (mixed strength), we can detect more faults as compared to pairwise (i.e., 2-way) testing. Here, the code-aware CIT can detect more faults by giving interaction strength to those highly correlated parameters that have been measured during the analysis process at the first stage.
As in the case of the replicated worker program in Figure 10, it is clear that there is a 4% higher mutation score as compared to the 2-way test suite. Similarly, we can see the results of the Groovy program in Figure 11. Here, with the new approach, we can detect 16 more faults. Moreover, we can see in Figure 12 that more faults can be detected in the case of the Body calculator program. Here, 138 more faults were detected as compared to the 2-way test suite. As for the case of Searching and Mortgage programs in Figures 13 and 14, more faults detected in with the mixed strength interaction that leads to a better mutation score. Specifically, for the Searching program, 136 new faults were discovered that leads to a 9% better mutation score as compared to the 2-way test suite. Similarly, for the Mortgage program, eight new faults were discovered by the mixed strength test suite, that leads to a 22% better mutation score.
We note that there are still many faults alive and our test suites have not killed them. Practically, it is not possible to kill all the mutants with a combinatorial interaction test suite. Those faults may be killed using some other test generation algorithms as they may not be interaction faults. The alive faults may also be detected by combi-natorial interaction test suites when the interaction strength is greater than two (i.e., t > 2). In this paper, we only aimed to show the effec-tiveness of the new approach. As far as the approach is effective, it can be used with higher strength easily.
If we combine the results from all five case studies, we get an impressive discussion. As can be seen in Figure 15, the code-aware CIT performed better. On average it is better by 3% in mutant detec-tion and by 25% in efficiency (Calculated by detected mutadetec-tions divided by the number of test cases). This is however largely variable based on the nature of the program. In all five cases, the code-aware CIT managed to find new mutants compared to the reference pairwise test suite. The specific number is tied to the total lines of code/mutants used, but in the first and second case studies, there is an efficiency gain of around 17% and 29%, while there is no gain in the last three case studies. However, as shown previously, there are still several new killed mutants that makes our approach effective. In fact, the efficiency is computed by dividing the number of mutants killed by the number of test cases in the test suite. For example, in the case of Body calculator, the input data is 415/1512 = 27% rounded for pairwise and for 516/1512 = 34% for the mixed test suite. The corresponding efficiency is thus 415/19=21.84 and 516/62=8.32. Here, the -62% comes from the relative change between the two efficiencies, i.e., 8.32 − 21.84)/21.8.
5 Threats to Validity
As in other empirical studies, our study is subjected to validity threats. We have tried to eliminate these threats during our experi-ments. We have redesigned the experiments several times to avoid different threats to validity. However, for the sake of reliability, we
outline some a few significant threats that we have faced during our experiments.
Regarding the generalization of our results (i.e., external validity), we have studies only five case studies written in Java, and differ-ent results may be reported for other programs. We used more than one program to validate our approach. Also, we tried to avoid hand-generated seeded faults by using a standard Java mutation tool to assure reliability. The faults injected by the µjava are more realistic faults than the hand-generated faults.
Regarding the effect of other internal factors on our results (i.e., internal validity), there might be other factors responsible for these results that we obtain due to the instrumentation of the case studies’ code. However, we have tried to run the program with and without the instrumentation and also we have double checking our experi-ments and manually reviewing the codes and the obtained results for a few cases. Also, as we illustrated in Section 4.4.1, internally, the parameters may affect each other, and there could be a threat that the effects of parameters were overlapping. We have tried to eliminate this threat by changing the values of the parameters systematically one by. Hence, we assure a fair measure even if it is not presenting the actual effect of that parameter on the code.
6 Conclusion
In this paper, we have presented our new code-aware approach for conducting the combinatorial interaction testing. We showed the results of an empirical study to examine the effectiveness of our approach through five case studies. We first examined the SUT by using a code coverage framework to analyze the impact of each input parameter. Then, we used the correlation coefficient to assess the relationship of the input parameters to each other. Using these assessment and analysis steps, we were able to reconsider the gen-erated test cases by taking those correlated parameters into account. We aim to study this approach experimentally. Although we have automated many steps during our experiments, developing an auto-mated tool to conduct this approach is beyond the scope of this paper. Nevertheless, we have demonstrated an algorithm pseudo-code that can be automated through a tool implementation in the future. This paper could serve as a strong base for a future research direction to develop an automated testing generation tool for the code-aware CIT.
As we can see from the experiments, using the parameter impact analysis can be utilized to generate effective test suites for fault detection. We named this testing process code-aware CIT. Although the fault detection rates and mutation score may vary from a program to another, the results showed that this approach is worth pursuing as another variant of CIT for practical aspects. The results also showed that this approach could be effective to find new faults that cannot be detected by the traditional t-wise testing. Hence, this approach can be treated as a complementary not a substitution of the t-wise testing. In addition to the directions mentioned above, there are many other future directions of code-aware CIT. Examining the effect of the input parameters on the internal code and using this effect as a relationship to generate more effective test cases is essential. One possible direction is to study the impact of the input sequence and sequence-less on the code and the generation process. Using the data flow in the code level and the interaction direction could also be an essential study finding. Shi et al. [24] demonstrated that there is some interest in analyzing the interaction direction at the code level. This could also affect the generation method of the test suite.
IET Research Journals, pp. 1–10
8 The Institution of Engineering and Technology 2018c
Auto-generated PDF by ReView
This article has been accepted for publication in a future issue of this journal, but has not been fully edited.IET Software
Table 13 Mortgage program parameter correlation overview
Correlation mortgageAmout mortgageTerm interest startDate payment extraMonthly extraYearly
mortgageAmout - 0.52 0.51 0.54 0.83 0.87 0.77 mortgageTerm 0.52 - 0.51 0.52 0.81 0.87 0.80 interest 0.51 0.51 - 0.52 0.78 0.85 0.79 startDate 0.54 0.52 0.52 - 0.68 0.21 0.81 payment 0.83 0.81 0.78 0.68 - 0.28 0.78 extraMonthly 0.87 0.87 0.85 0.21 0.28 - 0.92 extraYearly 0.77 0.80 0.79 0.81 0.78 0.92
-Table 14 The size of the generated test suites before and after parameter impact consideration
SUT 2-way mixed
Replicated workers 28 25 Groovy 24 17 Body calculator 19 62 Searching Program 16 48 Mortgage program 15 39 Alive Killed 0 100 200 300 Mu ta n ts 2-way mixed
2-way Mutation Score = 90% Mixed Mutation Score = 94%
Fig. 10: Comparison of the test suite effectiveness for detecting
faults in case of Replicated worker program
Alive Killed 0 50 100 150 200 Mu ta n ts 2-way mixed
2-way Mutation Score = 89% Mixed Mutation Score = 91%
Fig. 11: Comparison of the test suite effectiveness for detecting
faults in case of Groovy program
Alive Killed 0 500 1000 1500 Mu ta n ts 2-way mixed
2-way Mutation Score = 27% Mixed Mutation Score = 34%
Fig. 12: Comparison of the test suite effectiveness for detecting
faults in case of Body calculator program
Alive Killed 0 500 1000 1500 2000 Mu ta n ts 2-way mixed
2-way Mutation Score = 83% Mixed Mutation Score = 92%
Fig. 13: Comparison of the test suite effectiveness for detecting
faults in case of Searching program
Alive Killed 0 10 20 30 40 Mu ta n ts 2-way mixed
2-way Mutation Score = 69% Mixed Mutation Score = 91%
Fig. 14: Comparison of the test suite effectiveness for detecting
faults in case of Mortgage program
Case 1 Case 2 Case 3 Case 4 Case 5
0 20 40 60 80 100 Mu ta n ts 2-way mixed +17.1% +29% -61.9% -63.3% -48.7%
Fig. 15: Overall Efficiency of all the five case studies
7 References
1 R. Kuhn, R. Kacker, Y. Lei, and J. Hunter, “Combinatorial software testing,” Computer, vol. 42, no. 8, pp. 94–96, Aug 2009.
2 C. Yilmaz, “Test case-aware combinatorial interaction testing,” IEEE Transactions on Software Engineering, vol. 39, no. 5, pp. 684–706, May 2013.
3 R. Tzoref-Brill, “Chapter two - advances in combinatorial testing,” ser. Advances in Computers, A. M. Memon, Ed. Elsevier, 2019, vol. 112, pp. 79 – 134.
IET Research Journals, pp. 1–10 c
The Institution of Engineering and Technology 2018 9
4 D. E. Simos, J. Zivanovic, and M. Leithner, “Automated combinatorial testing for detecting sql vulnerabilities in web applications,” in Proceedings of the 14th Inter-national Workshop on Automation of Software Test, ser. AST ’19. Piscataway, NJ, USA: IEEE Press, 2019, pp. 55–61.
5 B. S. Ahmed, T. S. Abdulsamad, and M. Y. Potrus, “Achievement of minimized combinatorial test suite for configuration-aware software functional testing using the cuckoo search algorithm,” Information and Software Technology, vol. 66, no. C, pp. 13–29, Oct. 2015.
6 A. Hartman, Software and Hardware Testing Using Combinatorial Covering Suites. Boston, MA: Springer US, 2005, pp. 237–266.
7 B. S. Ahmed and K. Z. Zamli, “A variable strength interaction test suites genera-tion strategy using particle swarm optimizagenera-tion,” Journal of Systems and Software, vol. 84, no. 12, pp. 2171–2185, Dec. 2011.
8 A. B. Nasser, K. Z. Zamli, A. A. Alsewari, and B. S. Ahmed, “An elitist-flower pollination-based strategy for constructing sequence and sequence-less t-way test suite,” International Journal of Bio-Inspired Computation, vol. 12, no. 2, pp. 115– 127, 2018.
9 C. J. Colbourn and V. R. Syrotiuk, “On a combinatorial framework for fault char-acterization,” Mathematics in Computer Science, vol. 12, no. 4, pp. 429–451, Dec 2018.
10 B. S. Ahmed, A. Pahim, C. R. R. Junior, D. R. Kuhn, and M. Bures, “Towards an automated unified framework to run applications for combinatorial interaction test-ing,” in Proceedings of the Evaluation and Assessment on Software Engineering, ser. EASE ’19. New York, NY, USA: ACM, 2019, pp. 252–258.
11 X. Yuan, M. B. Cohen, and A. M. Memon, “Gui interaction testing: Incorporating event context,” IEEE Transactions on Software Engineering, vol. 37, no. 4, pp. 559–574, Jul. 2011.
12 M. Bures and B. S. Ahmed, “On the effectiveness of combinatorial interaction testing: A case study,” in 2017 IEEE International Conference on Software Quality, Reliability and Security Companion (QRS-C). IEEE Computer Society Press, July 2017, pp. 69–76.
13 J. Tao, Y. Li, F. Wotawa, H. Felbinger, and M. Nica, “On the industrial application of combinatorial testing for autonomous driving functions,” in 2019 IEEE Inter-national Conference on Software Testing, Verification and Validation Workshops (ICSTW). IEEE Computer Society Press, April 2019, pp. 234–240.
14 D. R. Kuhn, R. N. Kacker, and Y. Lei, Introduction to Combinatorial Testing, 1st ed. Chapman & Hall/CRC, 2013.
15 B. S. Ahmed, K. Z. Zamli, W. Afzal, and M. Bures, “Constrained interaction testing: A systematic literature study,” IEEE Access, vol. 5, pp. 25 706–25 730, 2017.
16 C. Nie and H. Leung, “A survey of combinatorial testing,” ACM Computing surveys, vol. 43, no. 2, pp. 11:1–11:29, 2011.
17 S. Y. Borodai and I. S. Grunskii, “Recursive generation of locally complete tests,” Cybernetics and Systems Analysis, vol. 28, no. 4, pp. 504–508, Jul 1992. 18 U. S. Schubert, “Experimental design for combinatorial and high throughput
mate-rials development. edited by james n. cawse.” Angewandte Chemie International Edition, vol. 43, no. 32, pp. 4123–4123, 2004.
19 D. R. Sulaiman and B. S. Ahmed, “Using the combinatorial optimization approach for dvs in high performance processors,” in 2013 The International Conference on Technological Advances in Electrical, Electronics and Computer Engineering (TAEECE). IEEE Computer Society Press, May 2013, pp. 105–109. 20 B. S. Ahmed, M. A. Sahib, L. M. Gambardella, W. Afzal, and K. Z. Zamli,
“Opti-mum design of pid controller for an automatic voltage regulator system using combinatorial test design,” PLOS ONE, vol. 11, no. 11, pp. 1–20, 11 2016. 21 D. E. Shasha, A. Y. Kouranov, L. V. Lejay, M. F. Chou, and G. M. Coruzzi, “Using
combinatorial design to study regulation by multiple input signals. a tool for parsi-mony in the post-genomics era,” Plant Physiology, vol. 127, no. 4, pp. 1590–1594, 2001.
22 D. C. Deacon, C. L. Happe, C. Chen, N. Tedeschi, A. M. Manso, T. Li, N. D. Dal-ton, Q. Peng, E. N. Farah, Y. Gu, K. P. Tenerelli, V. D. Tran, J. Chen, K. L. Peterson, N. J. Schork, E. D. Adler, A. J. Engler, R. S. Ross, and N. C. Chi, “Combinato-rial interactions of genetic variants in human cardiomyopathy,” Nature Biomedical Engineering, vol. 3, no. 2, pp. 147–157, 2019.
23 G. Demiroz and C. Yilmaz, “Using simulated annealing for computing cost-aware covering arrays,” Applied Soft Computing, vol. 49, no. C, pp. 1129–1144, Dec. 2016.
24 J. Shi, M. B. Cohen, and M. B. Dwyer, “Integration testing of software product lines using compositional symbolic execution,” in Proceedings of the 15th Inter-national Conference on Fundamental Approaches to Software Engineering, ser. FASE’12. Berlin, Heidelberg: Springer-Verlag, 2012, pp. 270–284.
IET Research Journals, pp. 1–10
10 The Institution of Engineering and Technology 2018c