i
Mapping the flow Of Apparel in a Wholesale Company
Master’s thesis in Applied Textile Management (15 ECTS credits)
The Swedish School of Textiles
Author: Umair Akash (S104511)
Thesis number: 2012.9.5
Supervisor: Dr. Jonas Stray
i
Acknowledgements
First and foremost, I would like to thank Allah who is the most merciful and beneficial, who gave me the strength and courage during the study.
I would like to show my appreciation to my thesis supervisor – Dr. Jonas Stray for the valuable guidance and advice. He inspired me greatly to work on this thesis. His advices and research direction helped me to get further steps.
I would also like to express my gratitude towards Håkan Torstensson, my course coordinator for his kindness, guidance and support during the program.
Furthermore I would also like to show my appreciation to the staff of Malik Moden GmbH, who gave me a chance to share their valuable information and views. Finally, and most importantly, I would like to thank my parents and my wife, who gave me support during this study.
ii
Abstract
Globalization that diminishes the barriers to trade worldwide has transformed the structure of production and increased the global competition in the textile and apparel industry. Especially, the elimination of quotas on January 2005 has totally changed the whole scenario of the apparel industry. A boom has been noticed in the emerging markets. Buyers shift their maximum orders to the low cost countries to increase their profit margins. China has gained its popularity among the European and American buyers because of the cheap labor and large scales of production and has become the world’s largest exporter of textile and apparel. The traditional competitive factor among the buyers is the lower cost of the product but the changing markets trends and demand volatility pushes the buyers to focus also on quality and lead times in addition to price. Due to the huge competition among the cluster of brands, retailers and wholesalers, lead time is becoming critical as longer lead times increases the risk of bottleneck to sales. China is the most important apparel supplier for the EU (especially Germany, the UK, and France) because it provides the cost benefit to the sourcing companies, but at the same time, it increases the lead times and also has more environmental impact in terms of pollution because of the long geographical distance.
This thesis highlights that there is a remarkable rise of the labor cost in China, noticed for the last couple of years, which has reduced the competitive factor of price while sourcing from China. This is also an upcoming challenge for the whole world with regards to sourcing strategies. Many sourcing companies are shifting their shares away from China in order to achieve their desired profit margins. Turkey may be an alternative sourcing destination for the European apparel buyers and wholesalers because of its competitive labor cost, favorable government policies, flexibility, sustainability, and proximity to Europe. In this thesis, a pilot study is carried out to determine the relationship and effects of lead times on sales. This thesis also describes the effects of relationships among the business partners on the supply chain flow. It is noted through several pilot studies that the organizations who work in collaboration with their supply chain partners can significantly improve their supply chain efficiency by reducing the inventories, markdowns, lead times, lost sales, and increasing forecast accuracy. There are several tools in use for collaboration such as Vendor Managed Inventory (VMI), Electronic Data Interchange (EDI), Just in Time (JIT), Customer Relationship
iii
Management (CRM), and Collaborative, Planning, Forecasting, and Replenishment (CPFR). In this paper the CPFR implementation steps, benefits, and hindrances are discussed in detail.
Key words: Supply chain & logistic management, lead time management, Global
iv
Table of Contents
1 Introduction ... 1
1.1 Problem Statement ... 3
1.3 Research Question ... 5
1.4 Research Purpose and Approach ... 5
1.5 Delimitations ... 6
1.6 Structure of Thesis ... 6
2 Theoretical Framework ... 7
2.1 The Supply Chain ... 7
2.1.1 Description ... 7
2.1.2 Supply Chain Management (SCM) ... 8
2.2 Logistics Management ... 10
2.2.2 Types of Flow in Logistics Management ... 11
2.2.3 Competing Through Logistics ... 12
2.2.4 Forecast Error and Lead Time Relation ... 14
2.3 Lead Time Management ... 15
2.3.1 Time to Market ... 16
2.3.2 Time to Serve ... 17
2.3.3 Time to React ... 17
2.5 Overview of Global Outsourcing ... 18
2.5.1 What is Global Outsourcing ... 18
2.5.2 Types of Global Outsourcing ... 19
2.5.3 Level of Global Outsourcing ... 19
2.5.3 Risks and Disadvantages of Global Sourcing ... 20
2.5.4 Outsourcing Destinations ... 22
2.6 Sourcing Channels and Market Actors ... 30
2.6.1 Sourcing Channels ... 30
2.7 Collaboration... 32
2.7.1 Forms of Collaboration ... 32
2.7.2 Types and Categories of Collaboration ... 33
2.7.3 Business Models Use for Collaboration ... 36
2.8 CPFR (Collaborative Planning, Forecasting and Replenishment) Business Model ... 36
v
2.8.2 Process of CPFR ... 37
2.8.3 Levels in CPFR Collaboration ... 42
2.8.4 CPFR Benefits ... 43
2.8.5 Challenges for CPFR Implementation ... 44
3 Methodology ... 45
3.1 Research Method ... 45
3.2 Selecting a Research Approach ... 45
3.3 Selecting an Appropriate Research Strategy ... 46
3.3.1 Case Study Strategy ... 47
3.3.2 Choosing the Suitable Research Purpose ... 49
3.4 Selection of the Research Method ... 50
3.5 Methods of Data Collection ... 50
3.6 Assessing the Quality of Research Study ... 51
4 Empirical Findings ... 52
4.1 Company Profile ... 52
4.2 Organizational Structure ... 52
4.3 Malik Moden Supply Chain ... 54
4.3.1 Inbound Logistics ... 55
4.3.2 Out-bound Logistics ... 56
4.3.3 Information Sharing ... 56
5 Analysis and Proposed Solutions ... 57
5.1 Lead Time and Forecast error ... 57
5.1.2 Comparison of Forecast error ... 57
5.1.3 Lead time comparison ... 59
5.1.4 Change in the Sourcing Strategy ... 60
5.1.5 Advantages of Changing Sourcing Strategy ... 61
5.2 Current Supply Chain Structure ... 62
5.2.1 New Supply Chain Business Model (CPFR) ... 63
5.2.1 Benefits of New Supply Chain Business Model (CPFR) ... 64
5.2.2 Challenges of Implementing CPFR ... 65
6 Conclusion ... 66
7 Bibliography ... 68
vi
List of Figures
Figure 1: Position of Malik Moden in supply chain ... 6
Figure 2: Activities in supply chain ... 7
Figure 3: Supply chain management framework ... 9
Figure 4: The supply chain in textile and clothing sector ... 10
Figure 5: Relationship between the lead time and the forecast error ... 15
Figure 6 : Shorter life-cycles making timing crucial ... 16
Figure 7: Inventory hide demand ... 18
Figure 8: The Silk Road ... 23
Figure 9: Geographical location of China and sea trade route ... 23
Figure 10: Geographical impacts of Suez Canal ... 24
Figure 11: China’s exchange rate (Yuan per Dollar) ... 26
Figure 12: Geographical location of Turkey ... 27
Figure 13: Comparative delivery times to European Union ... 29
Figure 14: Outwear trade and distribution channels ... 30
Figure 15: The scope of collaboration ... 33
Figure 16: Types of relationships ... 34
Figure 17: CPFR process model ... 38
Figure 18: Key CPFR scenario lead roles ... 41
Figure 19: Deductive approach ... 45
Figure 20: Inductive approach ... 46
Figure 21: Relevant situations for different research strategies ... 47
Figure 22: Organizational structure of Malik Moden ... 54
Figure 23 : Supply chain structure of Malik Moden ... 55
Figure 24: Comparison of forecast error ... 58
Figure 25: Lead time comparison ... 60
Figure 26: Supply chain structure of the Suppliers from China ... 62
Figure 27: Supply chain structure of the suppliers from Turkey ... 62
Figure 28: New supply chain business model ... 64
Figure 29: Delivery note of Malik Moden GmbH for the retailers ... 73
Figure 30: Malik Moden warehouse, a view from outside ... 73
Figure 31: Malik Moden display Site, a view from outside ... 74
Figure 32: Display site of Malik Moden (internal view) ... 74
vii
List of Tables
Table 1: Labor cost per hour in USD ... 25
Table 2: Comparative lead times in European market ... 30
Table 3: Dimensions of the different levels of CPFR ... 43
Table 4: The impact of lead time on markdowns and lost sales ... 57
Table 5: The goods deliveries schedule………..……….59
1
1 Introduction
The sourcing decisions are generally carried out from the “low-cost country” because of the lower manufacturing cost, but due to several factors considering “low cost country” as a foremost cost-mitigation strategy is going to be changed. One reason for this is a shift of low-cost countries to the emerging markets. This shift increases the expectations of the labor for “globally fair” wages, for example the labor cost in China is increasing radically, which will raise the cost of goods produced there, resulting in squeezing the profitability of buyers and therefore they require to revise their sourcing strategy (Berg, Hedrich, Kempft, & Tochterrmann, 2011, p. 4; Ellis, 2008).
The “total supply chain cost” is another reason, due to which low-cost country sourcing is losing the potential. Most of the time the initial cost advantage may be achieved by manufacturing the product in low-cost country, but a “total supply chain cost” perspective provides a sensible approach to making sourcing decisions. The focus of this concept is on total cost of the product including manufacturing and transporting as well as the cost of obsolescence, forced markdowns, and inventory carrying cost (Mattila, n.d., pp. 29-31; Christopher, Lowson, & Peck, Creating Agile Supply Chains In The Fashion Industry, n.d., p. 6).
Mean while, quick response is also considered to be an important competitive factor. Sometimes the trading companies have to respond fast in order to gain an advantage over competitors. For them sourcing from a low-cost country, especially from Asian countries doesn’t make sense because the lead time considerations may actually be of a higher priority than the initial cost of the product, which actually affects the total cost of the supply chain. Due to longer lead times, sourcing companies may experience huge markdowns or lost sales, which is why for sensible sourcing the total costs and lead times are taken into account. For some companies, this may mean that the most profitable is to do nearby sourcing (Ellis, 2008).
At the manufacturing end, it is noted that most of the logistic operations and factors like cost, quality, and lead time are becoming a challenge. The rise of raw material costs makes the criterion of the price tough. The continuous growing and changing of customer demands and preferences, increases the supply chain complexity. Therefore, it is difficult for only manufacturers to deal with the supply and demand
2
challenges by keeping up consideration of the factors like cost, quality and lead time (Ellis, 2008).
The approach of “profitable proximity sourcing” is now under consideration for the trading companies. As it is noted that the term “total supply chain cost” is not just a total landed cost but it also includes the hidden cost like inventory carrying cost, the cost of obsolescence (lead-time cost), and mark downs. The hidden cost and sourcing trends act as indicators due to a number of reasons, such as increase in labor cost; the advantage of sourcing from China in term of low cost manufacturing is reduced and it is almost of same cost to manufacture in Turkey. This enables the sourcing companies to adopt a profitable proximity sourcing strategy, as it becomes more profitable to source from nearby—because the shorter lead times and shorter cycles will provide an opportunity to the sourcing companies to control their inventory and obsolescence costs. The reduction in lead time also increases the forecast accuracy and flexibility of the sourcing companies and also provides a better control over the supply chain (Ellis, 2008).
Supply chains consist of several activities, e.g. planning, forecasting, manufacturing, transporting, retailing, and replenishment. For many years, organizations have been trying to improve the supply chain activities, to achieve an efficient and effective supply chain flow. Generally, it is difficult for a single organization to have absolute control over all of the supply chain functions. Thus, the arm’s length relationship among the organizations, where the focus is to increase individual profit and organizations are trying to cover most of the supply chain processes alone, affects severely the supply chain efficiency. Collaboration provides an opportunity to the organizations, as the supply chains, that are managed through collaboration to integrate supply and demand considerably improves the performance of supply chain in several core areas, including increased sales, improve forecasts, more accurate and timely information, reduced costs, reduced inventory, and improve customer service level (Barratt, 2004). Due to which the importance of Collaboration, Planning, Forecasting and Replenishment (CPFR) becomes even greater, as it provides an opportunity to the organizations to have a complete control over the supply chain functions. CPFR also provides core expected benefits like increased forecast accuracy of demand forecast and replenishment plans, which is necessary to reduce the inventories across the supply chain and achieve high customer service levels by transferring the right products in the right locations, at right time (Whipple & Russell, 2007).
3
1.1 Problem Statement
The apparel industry is a highly competitive business sector and the current sourcing trends to purchase products and materials offshore, has led in many cases to substantially longer lead times and increased the complexity and difficulty to the management and its logistics operations. Most of the time companies gain initial cost advantage particularly in manufacturing, through sourcing from low cost country, but at the same time the effect on lead-times can be severe, as it includes the transportation lead time as well as the delays and variability caused by internal processes at both ends and trading procedures in between. This leads to delay in the supply chain pipeline, due to high inventory level the risk of obsolescence, the markdowns, and lost sales, will increases the forecasting error (Christopher, Lowson, & Peck, Creating Agile Supply Chains In The Fashion Industry, n.d., p. 3). Most of the buyers consider sourcing from China is a solution to gain initial cost advantage. For many years, China was almost always the hands-down answer to all buyers need, but those old times are shifting because of the increase in wages and labor shortage in China. Now buyers are thinking to have a shift in their sourcing strategy (Berg, Hedrich, Kempft, & Tochterrmann, 2011).
Most of the companies operate their supply chains in a traditional way, where the focus is to achieve individual profit and the supply chain functions, e.g. production orders and stock replenishment are carried out without considering the situation at either upstream or downstream supply chain members (Holweg, Disney, Holmström, & Småros, 2005). The lack of collaboration or partnership and communication gap between the manufacturer and the end consumer, increase the complexity and total cost of the supply chain. Developing an effective collaboration among the supply chain partners will reduce cost; improve service, and forecasting (Lambert, Emmelhainz, & Gardner, 1996). Collaboration also helps to reduce supply chain complication because of the balance in supply and demand. Collaborative, Planning, Forecasting, and Replenishment (CPFR) is the supply chain model, gaining popularity because it provides a framework based on collaborative efforts between the value chain partners both upstream and downstream. Companies can increase the efficiency and effectiveness of their supply chain by improving information sharing among the supply and demand chain partners, and by reducing overall costs, inventory cost and therefore increasing the forecast accuracy (Barratt, 2004).
4
Malik Moden GmbH is a small importing wholesale trader’s, located in Dreieich, Germany. There are only seven permanent employees. Three of them are involved in taking the apparel sourcing decisions. The main criterion is to source low price apparel. Therefore, the main focus is to reduce and negotiate on the initial product cost. Since they have a very traditional sourcing approach, they source their continuous and seasonal-basic apparel from the Chinese suppliers, to achieve the low-cost advantage. While sourcing from China, the dimension of speed and other risk are not considered. Sourcing from China provides them an opportunity to gain cost advantage, but on the other hand they have to face a challenge of hidden cost like cost of obsolescence (lead time cost), mark downs, and inventory cost. The long geographical distance between the supplier (China) and buyer (case company) widen the lead time. At the same time, the longer lead times also increase the forecast error of the case company. The lead times, while sourcing from China are 3-4 months and may increase to 4.5-5 months, depending on the variability and postponements from the supplier side. Due to the longer lead times, they have less time to make profit and have higher risk of obsolescence. Thus, they have to experience huge markdowns and lost sales, resulting in the increase of total supply chain cost. In addition, as it is mentioned above, in China the labor cost is increasing, therefore, the case company may face challenges regarding their sourcing strategy and may also lose the benefit of the lower product cost, in the future. Currently they are sourcing their seasonal fashion products from Turkey. Due to the shorter lead times of about 1-1.5 month, the forecast error, markdowns and lost sales percentage is low.
The current supply chain structure with regards to the suppliers from China is very traditional. As the main goal during sourcing is to keep the cost of the product as low as possible, therefore they are usually searching for the new suppliers to gain an initial cost advantage. They have an arm’s length relationship with their suppliers and buyers. The only information shared with their up-stream supply chain members is the purchase order sent by the case company. The other reason, that the case company is facing the dilemma of forecast error, markdowns and lost sales, is due to the lack of information sharing, collaboration and trust among the trading partners.
Fashion is fad and forecasting accuracy does not match the geodemographic conditions currently. In fashion we need to look for the right product, at the right price, at the right quality, right quantity and at the right time to be successful.
5
Companies should make sure that the channels of distribution and supply chains satisfy the demand at all stages. It is very important to have flow of data and product in both ways in the supply chain so that it matches the demand-driven supply and a sustainable system can be developed. By building right integration model of demand and supply chain through sharing of information the companies can reduce the forecast error and minimize stock-outs (Sparks, 2010).
With new tools in supply and demand chain we can develop the right strategies which can fit into fashion industry accordingly.
1.3 Research Question
The above discussion may leads to the following question.
Why are lead time, sourcing strategy, and collaboration considered to be the important factors for an apparel supply chain?
In order to get the answer for the above question in detail, the following two sub-questions are proposed.
How are the current sourcing strategy, buying trends, and lead time affecting the efficiency of Malik Moden (the case company) and how is it improved?
How can the current supply chain structure be improved to get a better control on lead times, markdowns, forecast error and lost sales?
1.4 Research Purpose and Approach
The purpose of the research is to examine and identify the effect of lead time and sourcing strategy over sales and supply chain efficiency of Malik Moden. Therefore, in the analysis part, hypotheses of the factors like, lead time and forecast error are tested to check the relationship of these factors. The author tries to propose some suggestions, alternatives, and new business model to improve forecast accuracy, markdowns, and lost sales, which may help the company to work in more efficient and effective way. The proposed suggestions are based on the author’s analysis, after examining related theories and cases and by understanding the current supply chain and business operations of Malik Moden. The author used a single case study approach, to understand the up and downstream processes, current sourcing strategy, and the business model of the
6
case company. The position of the case company in a supply chain is given below in Figure 1.
Figure 1: Position of Malik Moden in supply chain
1.5 Delimitations
The case study scope is limited to the factors associated with markdowns, forecast errors, and lost sales of companies similar in characteristics to and in similar situations as Malik Moden and how these factors have to manage in order to achieve an efficient flow in a supply chain.
1.6 Structure of Thesis
The thesis report consist of six chapters, the structure of thesis is as follows.
Chapter 1 gives a brief introduction and highlights the aim of this study.
Furthermore, it provides an explanation of the problem assossiated with the company. Then the research questions and the purpose of this study are presented. The chapter ends with the delimatation of the research and the brief outline of the structure of thesis.
Chapter 2 contains the literature review which is related to the topic of this
research and is used to support the analysis.
Chapter 3 explains the research methods and the selection of the single case study,
data collection methods, reliability, and validity of the study.
Chapter 4 provides the empirical findings and a description of the supply chain
structure including inbound and out bound logistics and information sharing policy.
Chapter 5 gives the hypothesis testing of the lead time and forecast error. The
analysis part is based on the empirical findings and the literature review. Furthermore, the author presents the suggestions to resolve current problems faced by the company.
7
2 Theoretical Framework
2.1 The Supply Chain
2.1.1 Description
A supply chain includes the range of functions which starts from basic commodities to selling the final product to the end consumer. One of the most clear, specific definitions available for understanding the supply chain functions is given by Christopher (1998) “…network of organizations that are involved,
through upstream and downstream linkages, in the different processes and activities that produce value in the form of products and services in the hands of the ultimate consumer.”
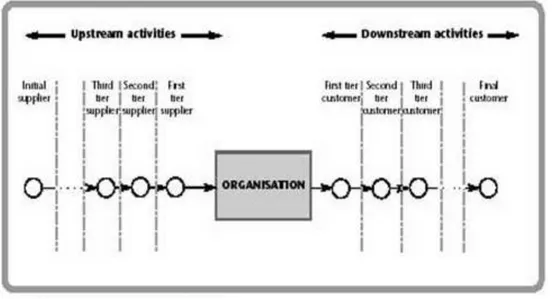
Figure 2 gives the more realistic representation of the supply chain and describes the activities of buyers and suppliers within supply chain, how the final product reaches to the final customer, while passing through different phases and stages. The downstream direction shows the activities which are related to the customers and upstream direction indicate the activities associated to the suppliers (Stadler & Kilger, 2008).
Figure 2: Activities in supply chain
8
2.1.2 Supply Chain Management (SCM)
Supply chain management refers to the handling of the activities and operation of the supply chain. The supply chain activities may include varieties of firms, starting from the processing of raw material to those engaged in wholesaling and retailing. The functions which are to be performed throughout the supply chain include sourcing, procurement, manufacturing, order processing, inventory management, warehousing, and customer service (Bewer & Speh, 2000). Supply chain management may be defined as:
“Supply chain management is the integration in the business processes from end
user through original suppliers that provides products, services and information that add value for customer.” (C. Cooper, M. Lambert, & D. Pagh, 1997, p. 2)
In an integrated supply chain, coordination of logistical activities is effectively extended to encompass source, make, and delivery processes in collaboration with channel partners and suppliers. Intra-firm coordination of sourcing, production, and logistics activities enhances the ability to respond to market volatility by elimination redundant activities and reducing response time by facilitating seamless flow of demand information, supply materials, and finished goods (Bowersox, Stank, & Daugherty, 1999, pp. 558-559).
The focus of an integrated supply chain is to manage relationships, information, and material flow across organizational border to reduce cost and improve the flow (Carter & Narasimhan, 1996).
The firms which are following the concept of SCM find the ways to integrate and improve their logistics, information sharing, operations, and marketing functions with the other entities of supply chain so that information, materials, component parts, and finished goods flow smoothly from the starting point to the end customer at low cost and high service level (Martha & Ram, 1996).
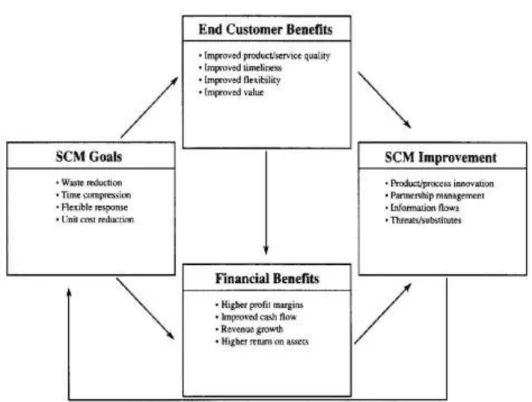
As Figure 3 portrays, the four vital objectives of SCM are: 1) reduction of waste; 2) compression of time; 3) flexible response; and 4) unit cost reduction. These four objectives have been articulated in several contexts related to SCM, which emphasize the significance of both inter-functional and inter-firm coordination (Bewer & Speh, 2000, p. 78).
9
Figure 3: Supply chain management framework [Source: (Bewer & Speh, 2000, p. 78)]
The core of SCM philosophy is that waste reduction and improving the performance of supply chain which can be obtained by coordination and integration of marketing, sourcing, production, logistics, and sales. When production and logistic processes are executed in less lead time, all activities in a supply chain can able to operate more efficiently (Bewer & Speh, 2000, p. 79).
2.1.2.1 Supply Chain of Clothing and Apparel
Industry
The supply chain in the textile clothing and apparel sector is illustrated in Figure 4. The flow of products is indicated by solid lines, while the dotted lines represent the information flow. The direction of arrows indicates the demand-pull-driven system of the supply chain of apparel. Mostly, the flow of information is initiated from the consumer side. The production procedure is carried out on the forecasted demand to provide the desired product at right time and right place. In Figure 4 there are usually several participants to the left of the distribution center. In order to obtain a smooth flow of production, transportation, and logistics, it is important to have
10
logistics, business services, and information sharing among members (Nordås, 2004, pp. 3-4).
Figure 4: The supply chain in textile and clothing sector (Source: (Nordås, 2004, p.
4)
2.2 Logistics Management
Logistics management is the part of SCM that refers to the management of the flow of goods and services between the point of origin and the point of use in order to meet the requirements of customers or corporations. Logistics involves the integration of information, transportation, inventory, warehousing, material handling, and packaging, and even security. Logistics management plays a vital role in satisfying customer’s needs.
Logistics management is defined by the Council of Logistics Management (CLM) as:
“The process of planning, implementing and controlling the efficient, effective flow
and storage of goods, services, and related information from point of origin to point of consumption for the purpose of conforming to customer requirement.”
(Stock & Ellram, 1998, p. 3)
Novack, Rinehart and Wells (1992, p. 236) defines logistics management as: “Logitsics management involves the creation of time, place, quantity, form and
possession utilities within and among firms and individuals through strategic management, infrastructure management, and resource management with the goal
11
of creating products/services that satisfy the customers through the attainment of value.”
In short logistics is defined by Harrison & Van Hoek (2008, p. 7) as:
“The Task of coordinating material flow and information flow across the supply chain.”
There are two types of logistic procedures carried out across the supply chain:
Inbound logistics
Outbound logistics
2.2.1 Inbound Logistics
Inbound logistics deals with the links between the focal form and its upstream (‘buy side’) suppliers (Harrison & Hoek, 2008, p. 10).
2.2.1 Outbound Logistics
Outbound logistics refers to the links between the focal firm and its downstream (‘sell side’) customers (Harrison & Hoek, 2008, p. 10).
2.2.2 Types of Flow in Logistics Management
Many times logistics systems are considered to only involves physical movements done by transportation companies. However, one of the other components is the movement of information (Novack, Rinehart, & Michael V. Wells, 1992). The following are two important components and flows for managing logistics functions, which are clearly stated in the above definitions:
Flow of material
Flow of information
2.2.2.1 Flow of Material
Material moves from the supply side towards the customer side of the supply chain. The main goal is to achieve a continuous flow of materials from source to the customer within the supply chain (Harrison & Hoek, 2008, p. 12). Time is the most critical factor, so the product should flow in a smooth way and the customer desired product will reaches on right time. The important goals of material flow defined by Harrison & Van Hoek (2008, p. 12) are:
12
“The goal is continuous, synchronous flow. Continuous means no interruptions, no
dropping the ball, no unnecessary accumulations of inventory. And synchronous means that it all runs like a ballet. Parts and components are delivered on time, in the proper sequence, exactly to the point they´re needed.”
2.2.2.2 Flow of Information
Flow of information should follow physical flows within a facility. In most of the cases, the information will actually precede the physical flow (Novack, Rinehart, & Michael V. Wells, 1992). Information flow is usually moved from the demand side towards the supply side as well as from the supply side towards the demand side. Now a days, information technology is used for the rapid sharing of information of demand and supply data. The information flow gives a clear picture of the nature of business processes, market growth and end customer’s demand (Harrison & Hoek, 2008).
Information sharing in the supply chain is the sharing of knowledge among partners to serve the end users effectively and efficiently. This sharing of information includes the production status and planning process as well as the changes in the business environment and the objectives of the companies (Lamming, Caldwell, & Harrison, 2004). These information flows between alliance partners may lead to a better coordination of the stock levels (Freedman, 1994). The information sharing is to be done at different levels and stages. The operation integration is shifted towards transaction efficieny improvements; integration at the strategic level requires shared or matching objectives (Lamming, Caldwell, & Harrison, 2004).
2.2.3 Competing Through Logistics
There are various ways through which products compete in the market. Logistics is one of the most vital competitive factors because it supports the availability of product in the market place at the right time. There are three important components which provide advantages to the process of logistics (Harrison & Hoek, 2008, pp. 16-17) which are as follows:
Quality of a product & service
Cost of the product
13
2.2.3.1 Quality of a Product and Service
The primary objective is to provide the desired level of quality product to the end-customer. Quality is the most important factor which affects the supply chain performance. The factors regarding quality may be defects in product, incorrect quantities, and wrong items delivery; all of these factors influence the costumer´s loyalty negatively. Controlling the issues of quality, improves the performance of the supply chain and for the organization it helps to reduce the costs by eliminating waste and errors (Harrison & Hoek, 2008, pp. 16-17).
The quality of service refers to the selecting of the right amount of product quantity in the right sequence, so that the desired amount of goods reaches to the customer (Harrison & Hoek, 2008, pp. 16-17).
2.2.3.2 Cost of the Product
The cost of the product is the most important factor of the supply chain processes. The low manufacturing cost is interpreted as an advantage in a market because of lower prices of the final product. Therefore, the organizations can achieve higher profit margins (Harrison & Hoek, 2008, p. 18).
The prime motive of outsourcing is to reduce the cost of the final product. The Boston Consulting Group (1991) studied more than 100 key companies doing extensive outsourcing procedures and concluded that, “most Western companies
outsource primarily to save on overhead or induce short-term cost savings” (The
Economist , 1991). The low manufacturing and labor cost is the main reason for outsourcing. In Western Europe the labor cost is very high compared to the Far East and even Eastern Europe. As the labor cost plays an important role to produce the product in less cost, countries like China, India, Bangladesh, and Turkey are used mainly for outsourcing by most of Western European buying companies (Mattila, n.d., p. 6).
2.2.3.3 Lead time
Lead time is also one of the main competitive factors among organizations. In today´s highly competitive market place, short lead time differentiates a company from its competitors. The ability to respond quickly enhances export, sales, and revenue. The term, “lead time” normally includes all activities from start to end. It begins, firstly, with the customer order receipt and ends with the customer receipt of the product or services. Everything which involves in between this procedure is
14
the lead time. Lead time refers to the time lag between order placing and receiving it (Nuruzzaman & Haque, 2009).
Total lead time is a combination of time devoted to order processing, to sourcing, and manufacturing items, and to deliver items between the various stages of the supply chain (Nuruzzaman & Haque, 2009). There are two main components of lead time:
Information lead time
Order lead time
2.2.3.3.1 Information Lead time
It is a time which is taken to process an order. The information lead time can be minimized by using a modern and sophisticated communication system among the supply chain partners (Nuruzzaman & Haque, 2009, p. 619).
2.2.3.3.2 Order Lead time
Order lead time is the time it takes to manufacture and deliver the items. This can be reduced by efficient supply chain management (Nuruzzaman & Haque, 2009, p. 619).
The conventional approach to cope with the uncertainty and risks of markdowns and lost sales is by improving the quality of the forecast. In the current market situation, demand volatility and the shorter life-cycle of the products it is difficult to develop a forecasting method which predicts the demand consistently and accurately. Therefore, it is necessary that organizations must focus on lead-time reduction to achieve the maximum efficiency in demand forecasting. Shorter lead-times mean that the forecasting horizon is shorter—hence the risk of error is lower (Christopher, Lowson, & Peck, Creating Agile Supply Chains In The Fashion Industry, n.d., pp. 3-4).
2.2.4 Forecast Error and Lead Time Relation
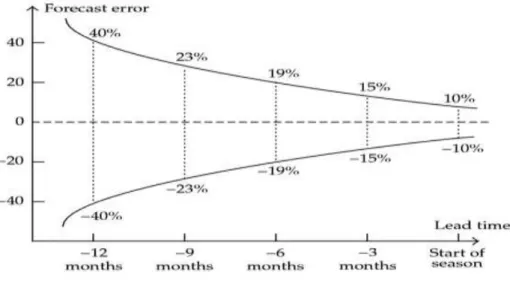
Logistics becomes more dependent on forecast because of long lead times. The lead time has a direct relation with the forecast: The longer the lead time, the further ahead (broader) we need to forecast. The Figure 5 shows the effect of lead times on the forecast error. The forecast error may be positive or negative, which means an organization should face a problem of excess stock or stock out. There is
15
a rule of thumb saying that a reduction of the lead time by 50% will reduce the forecast error by 50% (Christopher & Peck, Marketing Logistics, 2003).
Figure 5: Relationship between the lead time and the forecast error [Source:
(Lowson, King, & Hunter, 1999, p. 94)]
In Figure 5, the central horizontal axis shows the predictions of design and color are made numbers of months ahead of the season and lower curve shows estimates of the forecast error. Generally, there is a basic principle of forecasting: the shorter the lead time, the better the forecast. If lead time is cut down from 12 months to 6 months in an apparel industry, the forecast error squeezes from ±40 percent to ±19 percent. (Lowson, King, & Hunter, 1999, p. 93). In addition, the forecast error grows more linearly as time to forecast increase, forming a familiar shape known as “trumpet of doom” (Song, Yang, & Luo, 2011, p. 8).
2.3 Lead Time Management
Lead time is an important factor that affects the operational cost, service level, and forecast uncertainty in a short-life-cycle-product supply chain (Song, Yang, & Luo, 2010). In business, lead time terminology is commonly used for time required for the processes between supplier and customer: the product passes through several stages and processes and due to which lead time management becomes a crucial aspect. Fisher (1997, p.108) point out that flexibility and speed of the supply system can help to overcome the impact of uncertainty and the speed of the supply chain is depend on the lead time management.
16
Globalization propels the apparel industry to be flexible and responsive in order to gain a competitive advantage of time. Christopher & Peck (2003, pp. 70-71) demonstrate three predominant lead times that must be managed in an integrated and coherent way, which helps the organization to become flexible, responsive, and more profitable. These lead times are:
Time to market
Time to serve
Time to react
2.3.1 Time to Market
Time to market involves the time taken by the company to grasp the situation, making designs accordingly, to achieve the product done, and the time for the product to be served in the targeted market. In any market innovative and timely new product development is the important source of competitve advantage. (Christopher & Peck, Marketing Logistics, 2003).
Companies that are slow to market can suffer in two ways. Firstly, they miss a significant sales opportunity that probably will not repeat. Secondly, the supplier is likely to find that when the product finally arrives in the marketplace, demand is starting to fall away leading to the likelihood of markdowns and lost sales (Christopher, Lowson, & Peck, Creating Agile Supply Chains In The Fashion Industry, n.d., p. 5). The difficulty faced by the organizations that are slow to market is illustrated in Figure 6.
Figure 6 : Shorter life-cycles making timing crucial [Source: (Christopher, Lowson, & Peck, Creating Agile Supply Chains In The Fashion Industry, n.d., p. 5)]
17
The strategy to gear up time to market, is the ability to be as close to the customer as possible. Continuous contact with the customer is a good source to gather ideas, then to respond according to the demand. This also helps to understand the market trends and behaviours which are extremely beneficial for the organizations (Christopher & Peck, Marketing Logistics, 2003).
2.3.2 Time to Serve
The term “time to serve” defined as how long it will take to transfer a customer ´s order into the product or service in the hands of the consumer. This will also give an important competitive advantage due to the shorter order cycles. The quick response to the demand of customer and shorter delivery time makes the supplier more reliable (Christopher & Peck, Marketing Logistics, 2003).
The sourcing which is carried out from offshore required a considerable time, especially the time consumed in preparing documentation, in consolidating full container loads and inbound clearance and transportation (Christopher, Lowson, & Peck, Creating Agile Supply Chains In The Fashion Industry, n.d., p. 6). Therefore, the companies can control their lead times by purchasing the product from nearby.
2.3.3 Time to React
How quick the company can make changes in the activities to react on the changing demand situations (Christopher & Peck, Marketing Logistics, 2003). The key factor for any fashion and clothing company is to keep their lead time as less as possible. A company who can’t serve its product to the customer on a right time can be affected by the problems of markdowns and lost sales.
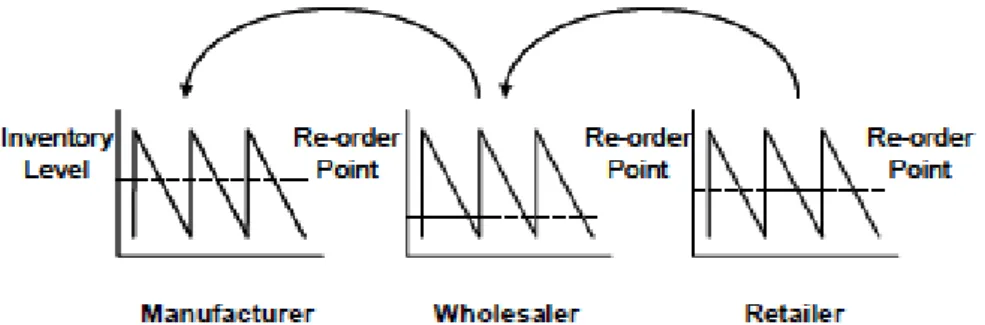
Time to respond has a similar barrier as mentioned in the previous two types of lead time. Some of the companies who focus on getting responsive fail to recognize the fluctuating market demand. A typical apparel supply chain places the order in the form of economic order quantity and add-on reorder quantity implies that the upstream supply chain companies are unable to judge the changing market situations by forecasting as it has to be judged on real time demand. The real demand is what the consumer is purchasing or requesting hour-by-hour, day-by-day. As shown in Figure 7, the upstream members of the supply chain have no real visibility of the final market place, which actually hide the real demand at the upstream side (Christopher, Lowson, & Peck, Creating Agile Supply Chains In The Fashion Industry, n.d., p. 7).
18
Figure 7: Inventory hide demand [Source (Christopher, Lowson, & Peck, Creating Agile Supply Chains In The Fashion Industry, n.d., p. 7)]
2.5 Overview of Global Outsourcing
2.5.1 What is Global Outsourcing
The word outsourcing is made up of two words – ‘out’ and ‘sourcing’. There are different authors which defined the concept of outsourcing, one of the simple definition of outsourcing is as follows:
“…A contracting activity with a third service provider for the management and
completion of a certain amount of work, for a specified length of time, cost, and level of service.” (Oshri, Kotlarsky, & Willcocks, 2009, p. 7)
In industrial society, outsourcing began with manufacturing. The manufacturers began to think of outsourcing the production procedures instead of building their core competencies by controlling all of the supply chain activities vertically. The prime motive behind outsourcing is to get a cost advantage. Outsourcing also helps companies to deliver new products to market more quickly and provide a cost-effective way to stay with the up-to-date technology and latest procedures, and concentrate on improving business ability and increase a global reach (Yu, Yan, & Cheng, 2001, p. 186).
Global outsourcing will help companies to find new sources such as low labor cost, unique materials, and new market opportunities as well as encourage companies to improve their flexibility, through which companies can increase their market shares and profits (Yu, Yan, & Cheng, 2001, pp. 187-188).
19
Globalization and saturated markets increase the levels of competition. Many companies are facing difficulties in mantaining and manufacturing, the range of skills and expertise are needed to compete effectively. The emergance and new entrant of third world countries like China and India has created a competitive environment and due to the developments in information technology, many companies are engaged in the activites of outsourcing, offshoring, and nearshoring, to sustain in a competitive market (Oshri, Kotlarsky, & Willcocks, 2009).
2.5.2 Types of Global Outsourcing
Global outsourcing mainly includes nearby and offshore outsourcing.
In nearby outsourcing the work procedures or service performed by the people in neighboring countries (Kathawala, Zhang, & Shao, 2005, p. 189). Many apparel companies in Western Europe outsource production to Turkey, Czech Republic, and Romania etc (Mattila, n.d.). The benefits are low cost, similar time zones, flexibility and compatibility (Kathawala, Zhang, & Shao, 2005, p. 189).
In offshore strategy companies outsource and conduct their several operations, mostly manufacturing from overseas to compete with potential rivals in terms of cost. The offshore outsourcing has become the main stream of global outsourcing because of the low labor cost, flexible working schedule: 24/7 operating time, and an educated labor (Kathawala, Zhang, & Shao, 2005, p. 189). The western European clothing companies do offshore outsourcing from Asia, normally from China, India, and Bangladesh because of the low labor cost as compared to the Western Europe (Mattila, n.d.).
2.5.3 Level of Global Outsourcing
The outsourcing decision are made on the basis several factors like the price of the product, labor cost or innovativeness. Trent and Monczka (2002) describes the five levels of global outsourcing, which are:
2.5.2.1 Level 1
Local sourcing, there is no reason to go for offshore outsourcing, when the local supplier meets the criteria.
20
2.5.2.2 Level 2
Global outsourcing, is usually performed on an ad hoc or reactive basis. Mostly, the companies go globally for outsourcing because of a lack of suitable local suppliers, or most of the times the competitors have a significant cost advantage.
2.5.2.3 Level 3
In this level, making global sourcing is a part of the sourcing strategy of the firm. The primary focus is to obtain a cost advantage.
2.5.2.4 Level 4
In this level, integration between the global sourcing location occurs, which requires worldwide information system, the personnel with multinational management skills, extensive coordination and information sharing.
2.5.2.5 Level 5
Companies should have integration between the global sourcing location, that are mentioned above and functional department (e.g. sourcing, development, production and marketing). The integration usually includes the coordination and information sharing in the several sets of activities like during the development of new product, establishing the right specification based on customer specification, and during sourcing of items to fulfill existing customer demand.
2.5.3 Risks and Disadvantages of Global Sourcing
Adaptation of outsourcing strategies involves several risks and disadvantages. The organizations with huge outsourcing operation have resulted in loss of critical skills and strength and now become highly reliant on outside organizations, which are their suppliers and manufacturers. The important business operations which are carried out outside the organization evolve into significant threats to the company. The major risk involve, is the security of the confidential data (Oshri, Kotlarsky, & Willcocks, 2009). This is the big danger that Apparel firms in now facing. The numbers of clothing items have surged in the number of counterfeit clothing and accessories. Mostly, the contra-ban items are originating from countries of which the material is outsourced by the retailers (Christine, Louise, Richrad, & Helen, 2005). This is the most critical factor as the buyer´s core competency is the main thing to entry in the marketplace. Sometimes it happens that after attaining
21
expertise, the suppliers may attempt to bypass the buyer directly in the market (Oshri, Kotlarsky, & Willcocks, 2009).
Language is also another challenge related with outsourcing. It is critical and important that the organizations involved in the supply chain can understand each other’s language properly and with a full command. Different time zones, cultural differences and language are definitely the barriers that need careful consideration. The communication barrier may lead to the quality issues which are the most serious factor, which play an important role in creating an image of company among customers (Qudrat-Ullah, 2009).
Lead time is also one of the risks that are associated with global offshore outsourcing. Normally, the lead times of the most of the low cost countries are longer, especially in the Far East (including China, Bangladesh and India). Longer lead times usually associated with transportation from sea (Fitzgerald, 2005). The most important issue of environmental sustainability is becoming more important. Currently, carbon dioxide emissions are considered probably the most relevant criterion for environmental sustainability (Logman). On one hand, offshore outsourcing in China and India provides a solution of low cost product for the buyers of Europe and America but on the other hand, the freight transportation increases the carbon footprint and has an adverse effect on the climate. Due to climate changes, the instability and frequency of “natural disaster” like floods and hurricanes are increasing (Center for Climate and Energy Solutions). According to the concept of Natural Capitalism, sustainability can be achieved by reducing the use of natural resources (John Cairns, 2000). The nearby outsourcing because of the less geographical distance and less transportation between buyers and manufacturers, considerably reduce the carbon footprint as well as lessen the use of natural resources (fossil fuel).
Rottman and Lacity (2006) give a list of risk associated with the outsourcing, includes; the risk related to Business, legal, political, workforce, social, and logistical (J Power, C Desouza, & Bonifazi, 2006).
22
2.5.4 Outsourcing Destinations
2.5.4.1 China as Outsourcing Destination
2.5.4.1.1 Introduction
Since 1994, China has been the biggest textile and apparel exporter in the world, occupying 40% of world export in 2010. China dominates the global low to medium end market through mainly engaging in Original Equipment Manufacturing (OEM). The Chinese textile and apparel market (excluding fibers) shrank by 1.1% in 2009 to reach a value of USD 270 billion. China´s total textile and apparel exports decline 9.65% year-on-year to USD 171 billion in 2009 (EU SME Centre, 2011, pp. 1-3). Meanwhile, the continuous increase in labor cost decreased the attractive profit margin of the outsourcing companies (Berg, Hedrich, Kempft, & Tochterrmann, 2011).
2.5.4.1.2 Geographical Location
China is located in Southeast Asia along the coastline of the Pacific Ocean. China is the world’s third largest country, with an area of 9.6 million square kilometers and coastline of 18,000 kilometers. The border of China is connected with 14 countries—Korea, Vietnam, Nepal, India, Pakistan, Russia, Afghanistan, Tajikistan, Kyrgyzstan, Laos, Burma, Bhutan, Kazakhstan, and Mongolia (12Ju2). There are mainly three modes of transportation are available for trade between China and Europe that are: Road, Seaports, and Airports.
Silk Road was the most enduring trade route of human history, being used for about 1,500 years. The name of the road is also taken from Chinese textile that flowed from the Middle East and Europe, as shown in the Figure 8. Because of harsh conditions, security reasons, and also ships being able to transport commodities faster and cheaper, this trade mode is not more in use (Rodrigue, Comtois, & Slack, 2006, pp. 15-16).
23
Figure 8: The Silk Road [Source: (Rodrigue, Comtois, & Slack, 2006, p. 15)]
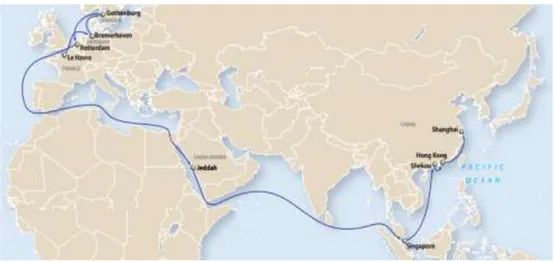
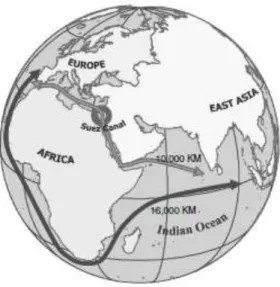
The trade from the sea is usually carried out in China, as it is an economical and faster way to transfer goods as compare to the transportation through road. The trade route is shown in Figure 9 and Figure 10. The trade between China and Europe carried out by using Pacific Ocean and then from Suez Canal till Europe. By using Suez Canal the journey in between Asia and Europe, is reduced by 6,000 km (Rodrigue, Comtois, & Slack, 2006, p. 21). But still approximately a month or more than a month is required to transfer goods from China till Europe.
Figure 9: Geographical location of China and sea trade route (Source:
24
Figure 10: Geographical impacts of Suez Canal [Source: (Rodrigue, Comtois, & Slack, 2006, p. 21)]
The airport transportation as trading mode is expensive and normally not so much used for exporting the large quantity of goods.
2.5.4.1.3 Outsourcing from China is Still Cost effective or
not
China has been the low-cost manufacturing country for the past 20 years. Due to the several factors like lower capital investment, domestic sourcing cost, favorable government policies and low cost of labor, helps China to become a huge manufacturing hub. Since 2008, the cost differential by sourcing from China has narrowed. The global rise of raw material cost and Government policies in China (including currency revaluation and an increase in labor wage) is reducing the profit margins of the sourcing companies (Wright, 2011, p. 8).
According to Harold L. Sirkin, a BCG senior partner “All over China wages are
climbing at 15 to 20 percent a year because of the supply-and-demand imbalance of skilled labor” (Boston Consulting Group, 2011). The increase in the average
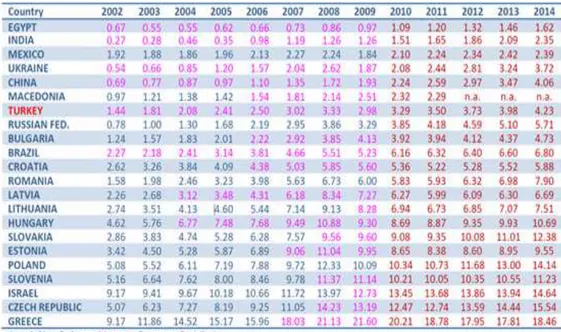
hourly wage rate in China, in the last couple of year is indicated in the Table 1. According to the IMF, China´s labor is now the third most expensive in emerging Asia, after Malaysia and Thailand (Jennings, 2011).
25
Table 1: Labor cost per hour in USD [Source: (Republic of Turkey, Prime Ministry Investment Support and Promotion Agency, 2010, p. 11)]
According to the survey from Berge, Hedrich, Kempf, & Tochtermann (2011, p. 5) “because of the wage increases and capacity pressure, the chief purchasing
officers (CPOs) of leading apparel in Europe and the US moving their sourcing away from China, 54 percent of CPOs plans to decrease their sourcing activities in China up to 10 percent and 32 percent stated that they sought to decrease their share of sourcing in China by more than 10 percent over the next five years.”
In privately owned companies in China, wages are expected to rise 17 percent annually in the next three years. The rapid increase in wages, raise the unit cost of the product as well as end price and margins for the sourcing companies (Wright, 2011, p. 8).
2.5.4.1.4 Drivers of Increasing Labor Cost in China
In China, the increases in wages have been driven by numerous forces. Shortage of skilled workers in Eastern China is one of the factors, as the majority of the manufacturing takes place in eastern China. The cost of living is also rising in the big cities like Shanghai and Beijing. For example, in Oct 2010 the consumer price index (CPI) reached at the record peak level in the last two years (4.4%) (Wright, 2011, p. 11).
Secondly, the increasing education levels among the new generation workers have made it more difficult for companies to negotiate in salaries with the workers
26
(Wright, 2011, p. 11). Workers are also demanding higher salaries by force and insisting to increase the salaries from 15000 Yuan to 2000-2500 Yuan (Yuen & Y. Ang). Mean while, the labor shortage in the coastal regions are impacting the RMG industry in China, as workers are continue moving on to more attractive industries and better jobs (Berg, Hedrich, Kempft, & Tochterrmann, 2011, p. 5).
Thirdly, China’s one-child policy significantly reduced fertility and by keeping it low most years since the 1970s. This is also one of the reasons for labor shortage in China (China manufacturing hourly labor rate, compensation costs impact EMS, 2011).
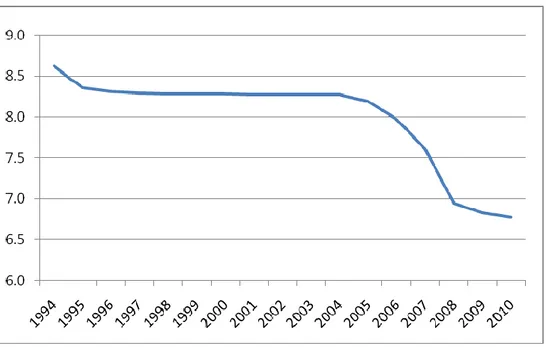
Lastly, the gradual currency appreciation against U.S. Dollar. The Yuan has appreciated by 18 percent since the announcement of China’s move away from its Dollar peg in July 2005, after a decade of fixed uniformity of 8.28 RMB per Dollar, as shown in the Figure 11 (Ceglowski & Galub, 2011, p. 2). This is also one a reasons of increase of labor cost in China.
Figure 11: China’s exchange rate (Yuan per Dollar) [Source: (Ceglowski & Galub, 2011, p. 2)]
2.5.4.2 Turkey as Outsourcing Destination
2.5.4.2.1 Introduction
The Turkish clothing industry is the 6th largest exporter in the world and 2nd largest exporter to the EU. Textiles and clothing is the core of the Turkish economy in
27
terms of GDP contribution, accounting for about 8-10% of the GDP together. There are more than 40,000 textile and clothing companies in Turkey with an estimated workforce of 750,000 employees. In 2011 the total value of clothing exports was US$ 13.5 billion. In Turkey, the established capacity of the woven production is around 1,350,000 tons. In knitted clothing sector T-shirts and pullovers are the most important export product. In 2011, the export of t-shirts and pullovers were US $ 4.3 billion. The EU is the most important market for Turkey´s clothing export. In 2011 Turkey exported clothing of US$ 11 billion to the EU, which is equal to 81.6% of Turkey’s total clothing exports. Germany and the UK are the main markets in EU for Turkey. Clothing export to these countries were US$ 5.2 billion, which is almost the half of Turkey´s clothing exports to the EU (Republic of Turkey -- Ministry of Economy, 2012, pp. 1-3).
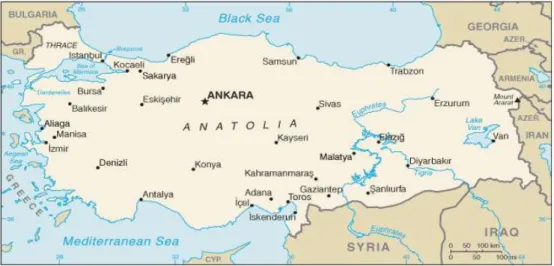
2.5.4.2.2 Geographical Location
Turkey is a Gateway to Europe and Central Asia (Eryuruk, Kalaoğlu, & Baskak, 2011, p. 15). Turkey west of the Bosporus is geographically part of Europe, by bordering the Black Sea, between Bulgaria and Georgia, and they are bordered with Asia from the Aegean Sea and Mediterranean Sea, by Greece and Syria (Central Intelligence Agency [CIA]). Turkey has an importance with respect to the logistic point of view i.e. there are a multi-mode connection facilities: Seaports/Free Zones/Railways/Airports and Truck, between Europe and Middle East, as shown in Figure 12 (Eryuruk, Kalaoğlu, & Baskak, 2011, p. 15).
Figure 12: Geographical location of Turkey ( Source:
https://www.cia.gov/library/publications/the-world-factbook/maps/maptemplate_tu.html) Turkey generally uses about 50% sea and about 35% road transport for foreign trade. Airway transport is rarely used because of high transportation costs
28
(Eryuruk, Kalaoğlu, & Baskak, 2011, p. 15). In the European Union the transportation from the truck is preferred because of its flexibility, availability, cost and ease arrangement (Tan, 2001).
2.5.4.2.3 Turkey Apparel Industry Key Drivers
Knowles (2012) and Ayling (2011) mentioned several advantages that are the key drivers to source from Turkey.
Firstly, the buyers decrease the complexity in buying process, as Turkey offer range of products of clothing, so the buyers can source most of the items within the country (Knowles, 2012).
Secondly, the buyers can also source the activities other than manufacturing because there are certain manufacturers and suppliers offers value-added services like product development and design to their customers (Knowles, 2012).
Thirdly, the country’s proximity to Europe provides fast and responsive supply chain (Knowles, 2012). Turkey has a logistic advantage as compared to other competitors, such as China, India and Pakistan (Eryuruk, Kalaoğlu, & Baskak, 2011, p. 17). The buyers can repeat best-selling styles in season, providing an opportunity to maximize sales and reducing lead time and forecast error as well. The proximity also decreases the carbon footprint, which is usually generated through transportation. Hence, sustainability can also be achieved through proximity.
Ersa Tasoren, former general manager of Tesco International says: “the labor cost
is higher in Turkey than in Bangladesh, Sri Lanka and India, but we have proximity here, together with know-how and Innovation.” Furthermore she says “And you often don’t markdown anything you ship out of Turkey though, because it ships in a week’s time and the lead time is four to six weeks. And you can guarantee there won’t be any markdown on that product because you are quite spot-on with quality, style and color. Interestingly enough, for bulk quantities Turkey is quite competitive, and we often compete head to head with the Far East.” (Ayling, 2011)
Alan Wintanley, executive director for menswear, children wear and beauty mentioned that lead times from China had been slipping and it was taking eight months to receive some products in store from the initial decision. “Producing in
Turkey does dramatically shorten that period, and the cost is actually not that much more than doing in China. And if you want a quality product and you want it
29
quickly, you can repeat in season from Turkey you can´t do that from China.”
(Knowles, 2012)
Lastly, the competitive edge of China is reduced in term of cost, as the labor cost in China in the last couple of year increased and therefore, Turkey is becoming a popular destination for European fashion brands (Ayling, 2011).
2.5.4.3 Lead times Comparison
As it is mentioned above in the key drivers, that one of the key success factors for Turkey is its geographical location. It is located in between Europe and Asia and newly developing markets in Russia. The easy access to Europe is a major advantage over the competitors in the Far East. The main transportation mode is “Truck” as the road system is quite well connected. It takes average four days, for a truck to travel from Istanbul to Germany, which is the largest apparel market for Turkey (Tan, 2001, p. 44).
Ghemawar and Baired (1998) compares the delivery times, including the transportation and production times to the European Union. The comparison shows that Turkey has an edge over the competitors in Asia and Europe, due to shorter manufacturing and transportation lead times (Tan, 2001, p. 45). The comparative delivery lead times to EU is shown in Figure 13.
Figure 13: Comparative delivery times to European Union [ Source: (Tan, 2001, p. 45)
Sung (1994) also provides a lead time comparison between China, Turkey, Far East, and European countries. The table below gives a clear picture that the Turkish
30
apparel exporter has an advantage in European market over the competitors like in China and In the Far East, because of their shorter lead times (Tan, 2001, p. 45).
Source First order Repeat Order
Easter Europe, Maghreb, Turkey, Greece
3-6 weeks 3-6 weeks
Other EC 2-4 weeks 2-4 weeks
China 6-7 months 3 months
Other Far East 4-5 months 3-5 months
Table 2: Comparative lead times in European market [ Source: (Tan, 2001, p. 45)]
2.6 Sourcing Channels and Market Actors
2.6.1 Sourcing Channels
The different sourcing channels with different sales intermediaries are shown in Figure 14. The channels include exporting manufacturers, agents, importing manufacturers, wholesalers, and retailers. It is also possible for the given channel to take over (some of) the function latter, to gain competitiveness (vertical integration).
Figure 14: Outwear trade and distribution channels (CBI, 2009, p. 15)
The different sales intermediaries and their functions in the supply chain are explained in detail below:
31
2.6.1.1 Importing Wholesalers
They are importing and purchasing the products and apparels on their own account; the wholesalers take title to the apparels and are responsible for their further sale and distribution. The wholesaler is familiar with the local market and can provide considerable information and guidance to the exporting manufacturer. The high level of cooperation with regards to the appropriate designs, new trends for the market, material and quality requirement can be obtained by developing the successful working relationship between importing wholesaler and exporting manufacturer. The wholesaler purchases from the manufacturer and stock it at his own risk. They usually cater the specialist shops, department stores and multiple chains (CBI, 2009, pp. 15-16).
2.6.1.2 Importing Manufacturer
Retailers are considering the stages before retailing and make their business vertically integrated and have their own designers to give their own collection a more unique look. Clothing manufacturers are also entering in the retail business by opening their own retail store. This provides them an opportunity to have better control over their outputs and margins (CBI, 2009, p. 16).
2.6.1.3 Agents
The agent is an independent intermediary between the manufacturer and retailer. The agent covers a limited geographical area. They receive a commission from the manufacturer. Most of the agents represent more than one manufacturer. The agents starting to sell from stock, to fulfill their clients short term demands. Stock forming occurs on a consignment basis. Another type of sale agent is buying agent, the buying agency for these types of agents is normally located in supplying country. They usually work on commission basis with different retail organization and brands (CBI, 2009, p. 16).
2.6.1.4 Importing Retailer
They are generally bigger retail organizations with more than 20 outlets, departments and home-shopping companies. They usually import the finished products through their own buyers, mainly from low wage countries and sourcing products made according to their own design. The retailers bypass the domestic wholesaler and manufacturer and this cut out the intermediaries and extra cost (CBI, 2009, pp. 16-17).