Analysis, Characterization
and Application of
Microwave Metamaterials
By
James L Vedral
B.S University of Colorado, Colorado Springs 2009
A dissertation submitted to the Graduate Faculty of the
University of Colorado at Colorado Springs
in partial fulfillment of the
requirements for the degree of
Doctor of Philosophy
Department of Physics
ii
This dissertation for Doctor of Philosophy degree by James L. Vedral
Has been approved for the Department of Applied Physics By
_______________________________________ Dr. Anatoliy Pinchuk, Physics UCCS
_______________________________________
Dr. Randall Musselman, Electrical Engineering United States Air Force Academy
_______________________________________ Dr. Robert Camley, Physics UCCS
_______________________________________ Dr. Tom Christensen, Physics UCCS
_______________________________________ Dr. Zbigniew Celinski, Physics UCC
Vedral, James Ph.D., Applied Science- Emphasis Physics
Analysis, Characterization and Application of Microwave Metamaterials Dissertation directed by Professor Anatoliy Pinchuk
iii
Metamaterials are an extremely fast growing and interesting field of study. The promise of new materials whose constitutive parameters are based on structure inclusions have drawn the interest of thousands and continue to inspire. Despite these promises not much in the way of applied technologies has come from the research.
This thesis is the result of numerous years of work into the characterization and
application of microwave metamaterials. The aim of the research was to develop a design process, characterize fully, and apply metamaterials to some current technology.
The thesis first details the enhanced directivity of a metamaterial slab and a plausible explanation for the phenomenon. It looks into the design process of low loss
metamaterials, and the use of infra-red imaging to help characterize them. Then it details how a metamaterial, the S-shaped split ring resonator, behaves with changes in
polarization and angle of incidence. It details the ambiguity issues that come with constitutive parameter extraction and how to resolve them. The thesis ends with the ongoing work to explore a new metamaterial design and application to millimeter wave notch filters.
iv
Acknowledgments
First and foremost, I have to thank my wife, Molly, for sticking it out with me throughout the endurance trial that is a PhD program. I must thank Dr. Pinchuk for pushing me to continue my studies and advising me throughout the process. I also may have never continued in the program if it was not for Dr. Camley and Dr. Celinski always offering advice and a time to talk about studies and research. Then there is Dr. Musselman and the United States Air Force Academy for giving me opportunities that have bettered myself not only as a scientist but as a human being. Finally, I must thank all the great people I have worked with over the years; Dr. Gozhenko, Dr. Wigle, Mr. Cheol Soo Lee, Dr. Smith, and Mr. David Lee.
v
Table of Contents
Abstract………...iii
Acknowledgements……….iv
Table of Contents……….v
List of Figures………vii
List of Included Articles………..x
Chapter 1 Introduction……….1
Chapter 2: Focusing Effect of a Metamaterial Slab on the Radiation Pattern Produced by a Patch Antenna 2.1 Introduction………7
2.2 Metamaterial Design and Fabrication ………...9
2.3 Experimental Results………...12
2.4 Discussion………....14
2.5 Chapter Conclusion....………..21
Chapter 3: Low-loss Negative Index Metamaterials for X, Ku, and K Microwave Bands 3.1 Introduction………..23
3.2 Design of Microwave Metamaterial(SSRR)………24
3.3 Fabrication of Prism……….27
3.4 Experimental and Theoretical Characterization………...28
3.5 Experimental and Theoretical results for the K-Band Slab……….33
3.6 Infrared Imaging of the Transmitted EM Waves………...………..…37
3.7 Chapter Conclusion...………..39
Chapter 4: Infrared Imaging of Microwave Negative Index Metamaterials 4.1 Introduction……….……….42
4.2 Theory………..43
4.3 Metamaterial Design………46
4.4 Near-Field Infrared Measurements………..48
vi
4.6 Chapter Conclusion………..57
Chapter 5: Polarization-Dependent Transmission through Microwave Metamaterials 5.1 Introduction………..59
5.2 Design………..…60
5.3 Experiment………...62
5.4 Results………..64
5.5 Chapter Conclusion………..70
Chapter 6: Resolving Parameter-Extraction Ambiguities in Inhomogeneous Materials and Metamaterials 6.1 Introduction………..71
6.2 Branch Cut Ambiguity……….72
6.3 Phase Unwrapping………...79
6.4 Parameter Extraction Test………81
6.5 Design and Experimental Set up………..88
6.6 Experimental Results………...89
6.7 Limitations………...94
6.8 Chapter Conclusion………..94
Chapter 7: Exploiting Inhomogeneity in Metamaterials for Radome Application 7.7 Introduction………..96
7.2 Design and Experimental Set Up……….96
7.3 Chapter Conclusion…...………...99
Chapter 8: Millimeter-Wave Tunable Notch Filter 8.1 Introduction………101
8.2 Results………104
8.3 Summary………106
References………108
vii
List of Figures
Fig 2.1: Sample of the metamaterial manufactured at UCCS………11
Fig 2.2: Experimental setup………...13
Fig 2.3: Transmittance and Radiation pattern………....14
Fig 2.4: Calculated Transmittance……….16
Fig 2.5: Theoretical Fit………..17
Fig 2.6: Ray Tracing With Negative Index………..…..19
Fig 2.7: Ray Tracing External Source………20
Fig 3.1: S-Shaped Unit Cell………...25
Fig 3.2: S-Shaped Slab………..27
Fig 3.3: Anechoic Chamber Set Up………...28
Fig 3.4: Experimental vs Simulated Transmission………....29
Fig 3.5: HFSS Simulated E-Field………..30
Fig 3.6: Transmitted Power vs Frequency & Angle………..31
Fig 3.7: Power vs Angle of Refraction………..32
Fig: 3.8: Index of Refraction……….33
Fig 3.9: Experimental vs Simulated Transmission( K-Band)………34
Fig 3.10: Transmitted Power vs Frequency & Angle(K-Band)……….35
Fig 3.11: Power vs Angle of Refraction(K-Band)……….36
Fig 3.12: Index of Refraction(K-Band)……….36
Fig 3.13: IR Test Set up……….37
Fig 3.14: IR imaging at different distances………38
Fig 3.15: Simulated E-Field Intensity vs IR imaging………39
Fig 4.1 Prism Refraction………45
Fig 4.2 Prism with d Spacing……….47
viii
Fig 4.4 IR of Horn Antenna………...50
Fig 4.5: IR Image and Contour………..51
Fig 4.6: IR Images at Different distances*………51
Fig 4.7: Simulated E-Field Intensity vs IR imaging*...……….53
Fig 4.8: IR Image Slide………..54
Fig 4.9: Image Slide Analysis………55
Fig 4.10 (a): Temperature of IR versus Pixel Index………..56
Fig 4.10 (b): Index of Refraction vs Frequency……….56
Fig 5.1: S-Shaped Unit Cell*……….59
Fig 5.2: Metamaterial Slab Construction…..………61
Fig 5.3: Polarization Independent Slabs………62
Fig 5.4: Rotation Explanation………63
Fig 5.5: Experimental Setup………..63
Fig 5.6: Power Transmitted Single Layer………..64
Fig 5.7: Power Transmitted Two Layer……….65
Fig 5.8: Power Transmitted Three Layer………...65
Fig 5.9: Rotation of Single Axis vs Dual………...66
Fig 5.10: Power of Dual Axis Boards Stacked………..67
Fig 5.11: Power Transmitted Angle of Incidence One Layer………...…….68
Fig 5.11: Power Transmitted Angle of Incidence Two Layer…………...………...…….69
Fig 5.12: Power Transmitted Angle of Incidence Three Layer………...…..69
Fig 6.1: Branch Cut Explanation………...73
Fig 6.2: Lorentz Dispersion Electrically Small……….84
Fig 6.3: Lorentz Dispersion Electrically Large……….85
Fig 6.4: Lorentz Dispersion Electrically Large Permeability………85
Fig 6.5: Lorentz Dispersion Electrically Large Same Frequency………..86
Fig 6.6: Drude Dispersion Permittivity with Lorentz Permeability………..86
ix
Fig 6.8(a,b,c): Parameters of the Single(A), Two (B), and Three(C) Layer of ESRR...90
Fig 6.9: Constructed Cell Layers………..91
Fig 6.10: Metamaterial Holder……….91
Fig 6.11: TRM Calibration………...91
Fig 6.12: Transmitted Power 1,2,3 Layer………..92
Fig 6.13: Parameters not Considering Branch Ambiguiety………..93
Fig 6.14: Within Resonance Limitation………94
Fig 7.1: ESRR Unit Cell*………..97
Fig 7.2: Metamaterial Holder and Unit Cells*………..98
Fig 7.3: Measured Power transmitted Compared to Simulated………99
Fig 7.4: Extracted Index of Refraction………101
Fig 8.1: Liquid Crystal Transmission Line………..103
Fig 8.2: Power Transmitted when On/Off………...104
Fig 8.3 Number of Unit Cell Relation to Power………..105
Fig 8.4 Mth Order………106
Fig 8.5 Tunability……….107
*A repeated image used to make referencing the figure easier and self-contained within a chapter.
x
List of Included Articles
1. Victor V. Gozhenko, James Wigle, James Vedral, Brian Hendrix, Anatoliy O. Pinchuk,
Focusing effect of a metamaterial slab on the radiation pattern produced by a patch antenna, Metamaterials (2012) DOI: 10.1016/j.metmat.2012.06.001.
2. David A. Lee, James Vedral, David A. Smith, Randall L. Musselman and Anatoliy O. Pinchuk, Low-loss negative index metamaterials for X, Ku, and K microwave bands, AIP Advances 5, 047119 (2015);
3. David A. Lee, James L. Vedral, David A. Smith, Randall L. Musselman, Anatoliy O. Pinchuk, Infrared imaging of microwave negative index metamaterials, Proc. SPIE 9502, Metamaterials X, 95020K (2015); doi:10.1117/12.2178611
4. James L. Vedral, David A. Lee, Randall L. Musselman, Anatoliy O. Pinchuk,
Polarization-dependent transmission through microwave metamaterials, Proc. SPIE 9502, Metamaterials X, 95020X (2015); doi:10.1117/12.2178992
5. James L Vedral, Randall Musselman, Cheol Soo Lee, Anatoliy O. Pinchuk, Resolving
Parameter-Extraction Ambiguities in Inhomogeneous Materials and Metamaterials. Submitted to:
IEEE Antennas and Propagation
6. James L. Vedral,, Randall Musselman, Anatoliy O. Pinchuk, Ecploiting Inhomogeneity in
Metamaterials for Radome Application, Proceedings of IEEE/ACES Conference 2016 Hawaii
7. James L. Vedral, Randall Musselman, Robert Camley, Millimeter Wave Tunable Band Gap
P a g e | 1
Chapter 1: Introduction
This dissertation completed through the Physics Department at the University of
Colorado Colorado Springs, directed by Dr. Anatoliy Pinchuk. This thesis is divided into chapters that either have been published or have been submitted for peer reviewed publication. Chapters two through seven are in the same order as the publications section previous to this chapter. This first chapter details the specific contributions I made to each research project as well as painting a narrative connecting one chapter to another.
The second chapter, Focusing Effect of a Metamaterial Slab on the Radiation Pattern
Produced by a Patch Antenna, details the experimental results of transmission through a
wire mesh metamaterial based on theory previously developed [1]. The metamaterial slab was tested with a patch antenna and there was a significant increase in directivity
observed. The research presented in chapter two was motivated by findings from other research groups [2,3]. The other groups did not present a satisfactory explanation for the increased directivity and our work presents a unique and plausible cause. In addition to the findings, the second chapter details the design, modeling and construction of the metamaterial under test. We showed that the increased directivity could be tied to a simple idea; the focusing effect was in fact due to attenuation of the electromagnetic waves within the metamaterial. This was groundbreaking at the time because other authors had thought that the focusing effect was purely due to the permittivity of the metamaterial slab being near zero [2,3]. My contribution to the work was two-fold, I modeled the metamaterial design using a commercial software, ANSYST HFSS, and
P a g e | 2 helped take measurements in the anechoic chamber at UCCS. Although this is my
smallest contribution out of all the papers presented in this thesis, it is included due to its importance in the narrative. The research presented in chapter two is not an improvement over current microwave technologies for a very apparent reason; the attenuation that causes the focusing effect is so large that the structure would not be an improvement. This motivated me to begin the search for a metamaterial design that possessed lower attenuation. The search for a less attenuating metamaterial design led to the S-shaped split ring resonator (SSRR) [4].
Chapter three, Low-loss Negative Index Metamaterials for X, Ku, and K Microwave
Bands, details design of a low loss metamaterial slab with the S-shaped split-ring
resonator (SSRR) as its base unit cell. The main goal was to develop a design process for the SSRR with specific constitutive parameters. What made this project very interesting is that although the theory for the SSRR is well defined, it remained very difficult to design and our process showed consistent results [4]. We were able to verify our results with simulations using ANSYS HFSS, a finite element equation solver. Our research also uncovered that a ratio of 0.7 between the height and width of metamaterial unit cell produced a very wide bandwidth of transmission. The bandwidth produced with this ratio was much larger than had been reported previously[4]. To estimate the index of refraction of our metamaterial slab, we used the standard transmission through a prism. In addition to the standard prism retrieval for index of refraction, it was also verified using infra-red near field imaging, which to my knowledge is the first case of this method being used.
P a g e | 3
For this project I designed each metamaterial, modeled them using Ansoft HFSS, I participated in radiation pattern measurements, and helped take IR images. The idea that we could use IR imaging to view the radiation pattern going through metamaterials in the near field was very exciting and led to a full project that is the basis for chapter four. The SSRR unit cell showed a lot of promise for use but needed further understanding as well as a full characterization. The largest downfall of the SSRR is that the design was based on a specific polarization so was thought to be highly anisotropic to changes in
polarization which we fully parameterize and overcome in chapter five.
Chapter four, Infrared Imaging of Microwave Negative Index Metamaterials, explored a novel method for retrieving the index of refraction from a microwave metamaertial slab. Near-field infrared imaging was used to “view” the electric field intensity through a metamaterial prism. The chapter details our process for measuring acquiring the infrared pattern for the metamaterial and relate it directly to electric field intensity. The chapter also verifies that 3-D contour mapping of the infrared images are in agreement with simulated electric field intensities. Traditionally metamaterials have been characterized by observing far-field radiation patterns, whereas the infrared imaging technique allowed for an alternative near field measurement. The infrared imaging used in chapter four could be used to characterize irregular forms of metamaterials, such as gradients, prisms, and conformal surfaces all in the near field.
P a g e | 4 For this project I simulated radiation patterns and took the infrared images used in the findings. I helped design the experiment from start to finish. In addition I helped with the low pass filter to overcome dead pixels on the infrared camera.
Chapter five, Polarization Dependent Transmission through Microwave Metamaterials, presents experimental work with a few goals in mind; first was to characterize how the transmitted intensity through the metamaterial slab changes with adjustments in
polarization and angle of incidence, second was to produce metamaterial designs based on the SSRR that would be polarization independent. We successfully document how the SSRR metamaterial behaves with changes in angel of incidence and polarization. From this documentation we found that the SSRR allows for all frequency bands to pass through when oriented perpendicular to the electric field. This finding allowed for us to create two novel geometries for the SSRR that make it polarization independent. In addition to this, several layers of the metamaterial are tested to see if transmission changes with thickness of the metamaterial. This produced a very confusing result; the transmitted power changed non-linearly with changes in thickness. This is not what one would expect from a homogeneous material, which hints that the SSRR metamaterial is inhomogeneous. If this metamaterial was indeed inhomogeneous then a modified method must be used to retrieve the constitutive parameters.
With the observation that the transmitted power changes non-linearly with thickness, it became apparent that this was in fact an inhomogeneous metamaterials. This in turn
P a g e | 5 meant that the simple Nicholson-Ross-Weir extraction method [5] we had been using to characterize the metamaterial would produce inaccurate results as it assumes
homogeneity. The result s from NRW extraction method produce infinite ambiguities for any constitutive parameter retrieved if the material is inhomogeneous. Chapter six,
Resolving Parameter-Extraction Ambiguities in Inhomogeneous Materials and
Metamaterials, describes the mathematical origin of this ambiguity in extracting the
constitutive parameters [6] as well as describing our novel solution to this problem. We showed that a process that is commonly used in image processing could be applied to resolving the ambiguity for constitutive parameter extraction. In addition, this chapter details the process, advantages, and downfalls of this modified NRW method. After extracting the parameters from several layers of the extended s-shaped split-ring resonator (ESRR) metamaterial, it was seen that although not negative index of
refraction, specific numbers of metamaterial unit cells matched the index of refraction of air. The result from the ESRR metamaterial was very interesting and led to us exploring it further in chapter seven.
Chapter seven, Exploiting Inhomogeneity in Metamaterials for Radome Application, goes into exploring if the ESRR metamaterial could be used in radome design despite being inhomogeneous. It was my goal in this chapter to look at the inhomogeneity as something that we could design with, not around and make use of. Previous chapters demonstrated that the SSRR and ESRR metamaterials are not negative at specific layers and
frequencies and we wanted to make use of this. In chapter seven we find that the ESRR at three layers actually produced a positive material that matched the impedance of air,
P a g e | 6 allowing for no attenuation at specific frequencies. This was a huge success, as it lent credit to using the metamaterial in radome design.
The research into the SSRR and its variants felt fairly exhausted after chapter seven and with interest rising in the millimeter wave bands we began looking at different structured materials. Chapter eight, Millimeter Wave Tunable Band Gap Filter, focuses on research done for a periodic liquid crystal structure. The overall goal of chapter eight was to investigate a new all dielectric metamaterial for use in millimeter wave devices. The work presented in this chapter is only preliminary findings but still show great potential. A simple Bragg reflection model is implemented to create the notch-filter and
surprisingly had extremely good agreement. The chapter details some basic background information and simulated data presenting some initial key results that are being
expanded on beyond the work in this thesis.
In summary, this body of work details research into metamaterials and the search for potential areas of application of this new and interesting technology.
P a g e | 7
Chapter 2: Focusing effect of a metamaterial slab
on the radiation pattern produced by a patch antenna
2.1 Introduction
Meshes made from metallic wires have long been used in various branches of science and engineering. Their applications in optics, radio, and electrical engineering include
diffraction gratings, antenna reflectors, radio telescope dishes, shells of shielded wires, and shield screens (e.g., microwave ovens). Since the end of the 1990’s, meshes have also been considered as a platform for designing artificial media, metamaterials, with predefined effective electromagnetic properties. It has been demonstrated that a mesh of thin metallic wires can produce an effective permittivity, of the Drude type. In this regard, the mesh responds to external electromagnetic radiation like plasma within bulk metals. For plasma, the plasma frequency ( ) is defined by the concentration of free p electrons [7]. For the mesh, however, the plasma frequency is defined only by its
geometric parameters; the mesh periodicity, a , and the wire radius, r . This allows one to
design mesh media with desired values of the plasma frequency, particularly in the p GHz range. Because the mesh permittivity is close to zero near the plasma frequency, and negative below the plasma frequency, mesh metamaterials can be used wherever a small index of refraction, or a transition from transparency to opacity, is a crucial point. For example, proper plasma frequency placement, within the frequency domain, can be used to improve antenna pattern directivity [2, 3].
P a g e | 8
The effect of a mesh metamaterial slab on the radiation pattern of a source placed inside the slab has been examined in [2]. The case of an external source was studied in [3]. In both of the scenarios, antenna directivity improvement was observed, with [3] being much less pronounced than that reported in [2]. Using simple geometric considerations, the antenna directivity effect has been explained in both cases, as a consequence of the refractive index of the slab being close to zero and operating close to the plasma frequency of the slab. Obviously, such an explanation that takes into account only the geometry of refraction on the slab boundaries is not valid for the case of an external source of radiation, as considered in [3]. Furthermore, accounting for the weakness of the effect in the latter case, one can ask if it is possible, in general, to improve the directivity of radiation emitted by an external source and, if so, what is the cause of such
improvement?
In improving radiation directivity using a slab of metamaterial, smallness of the effective refractive index, neff, of the slab is a crucial point [2]. The minimal value of neff is near the plasma frequency, , of the slab. Therefore, it is vital to know the value of p in p order to properly select the proper operating frequency of the slab. The value of can p be estimated either from theoretical calculations, based on the geometrical parameters of the mesh metamaterial, or from experimentally measured data, the transmission spectrum of the slab (()). In the latter case, there are some arbitrary rules for selecting the point
P a g e | 9 of the () spectrum where exists. For example, p corresponds to = 0 in [8] and p to the maximum value in [2].
In this chapter, we experimentally examine the effect of a mesh metamaterial slab on the radiation pattern of an antenna placed near the slab. The measurements are performed within a frequency range covering the plasma frequency, , of the slab. We estimate p
p
value using two methods: Theoretical calculations using mesh geometry parameters, and experimentally via measuring the transmission spectrum of the slab, (). In the latter method, is not defined as a specific point of the spectrum. Rather, it is defined p by approximating the experimental spectrum with a theoretical one calculated for a slab with Drude-like permittivity. The slab’s effect on the directivity of the antenna’s
radiation is determined by comparing the radiation patterns of the antenna with and without the metamaterial. The pattern’s peculiarities due to the slab are explained using simple physical considerations, and by taking into account the attenuation of
electromagnetic waves within the slab, at frequencies close to the plasma frequency of the metamaterial.
2.2 Metamaterial Design and Fabrication
Our sample of a mesh metamaterial has been designed based on the thin wire mesh model [1], as shown in following expression for the plasma frequency:
P a g e | 10 ) / ln( 2 2 2 2 r a a c p (2.1)
where r is the mesh wires’ radius, a is the mesh periodicity, and c3108m/s is the free space speed of light. Eq. (2.1) is derived for a mesh of thin wires assuming the mesh periodicity a is much smaller than the operating wavelength , and the wires’ radius r
is much smaller than periodicity, ar. It should also be mentioned that according to Eq. (2.1), is dependent only on the mesh geometrical parameters and is p
independent of material parameters such as concentration of free electrons, n, and the effective electron’s mass m*, which define the plasma frequency of a bulk material.
The metamaterial sample has been shaped in the form of a slab consisting of six identical plates of sizes 195х195x1.5 mm assembled in parallel at distance of 7 mm from each other (Fig. 2.1). The total slab thickness is 35 mm. The plates are manufactured from conventional electrical boards coated with copper1. Protoboard maker ProtoMat S62 (LPKF Laser & Electronics AG) milled flat copper grids with 0.1 mm thickness and a periodicity of a7.4 mm. The wires’ had a width of d 0.9 mm. These plates were stacked to construct the metamaterial slab. The copper grids are active elements of the metamaterial.
P a g e | 11
Fig. 2.1 Metamaterial Manufactured at UCCS. The metamaterial is six layers in depth and mounted on top of patch antenna with coaxial feed coming out of the backside.
The theoretical value of the plasma frequency calculated from Eq. (2.1) is
6 . 9 ) 2 /(
p p GHz. The corresponding plasma wavelength is
1 . 3 / 2 / p c p c p
cm, where c is the free space speed of light. Regarding our
calculation of , the relative permittivity of the electrical board’s base material was p simply assumed to be 1, and the half-width of the mesh wires was considered as their radius, rd/2. The above mentioned requirement ra is satisfied in our case since
4 . 7
a mm and r0.45 mm. Feasibility of the a requirement depends on the operating wavelength. To achieve minimal values of the slab permittivity, we used radiation with p in our experiments. At the plasma wavelength, we have /a4.2. Formally, one cannot assume a. Nevertheless, previously reported results obtained
P a g e | 12 with = 3.3 to 6.6 [1, 2, 3] give us hope to observe anticipated effects with our slab, /a
as well.
2.3 Experimental Results
We measured the slab transmittance in the frequency range = 7.5 to 12.5 GHz covering the theoretical plasma frequency, p 9.6 GHz. Transmittance measurement
experiments employed a radiating bi-ridged antenna2, and the received system employed a flared waveguide horn antenna. Both antennas were placed 3.0 m from each other, and the slab was located directly in front of the transmission antenna3.
The E-plane radiation pattern (angle distribution of the radiated power) of an antenna, with and without the slab, was measured over numerous frequencies, ranging from 9.8 to 12.0 GHz. Azimuth angle range used was 50 50. All pattern measurements were performed within a microwave anechoic chamber (Fig. 2.2). The effect of the metamaterial slab on antenna directivity is studied for a patch antenna placed at distance 3 m from radiating ridged horn antenna. Representative results of the measurements are shown in Fig. 2.3.
2 HP11966E, bi-ridged antenna.
3 The metamaterial was placed in direct contact with the face of the transmit antenna, but had no DC
P a g e | 13
Fig. 2.2. Experimental setup: The slab of metamaterial in front of a patch antenna (left) within an anechoic chamber. The metamaterial sets on top of a Styrofoam stand, all of which sits on a stand
that is rotated 180o to obtain the antenna pattern.
As one can see from Fig. 2.3a, the slab transmittance changes substantially in the
frequency range 10-12.4 GHz, from 0% to 40%. From Fig 2.3b, it can be seen that use of the slab improves the radiation pattern of the patch antenna at some frequencies making its main lobe narrower, and the side lobes less intensive than the original pattern (black dotted line). Note the radiation patterns with a half power beam width less than 20º, at 10.9 (blue curve) and 11.7 GHz (red curve). At other frequencies, an example at 11.2 GHz (green curve), did not display appreciable improvement of the radiation pattern. In fact, other frequencies displayed a significant degradation in antenna radiation pattern performance.
P a g e | 14 9 10 11 12 0.0 0.2 0.4 Trans mi ttance GHz
Fig. 2.3. (a) Experimental transmittance spectrum of the metamaterial slab. (b) Radiation patterns of the patch antenna with and without the slab at different frequencies. The black dotted line is the antenna pattern for the patch antenna without any metamaterial mounted to it which remained the same across all frequencies measured. The blue line measurement was taken at 10.9 GHz and shows
the most directivity, the red line was taken at 11.7 GHz and the green (which shows near total attenuation) was taken at 11.2 GHz.
2.4 Discussion
The frequency dependence of the slab transmission, as well as the slab effect on the radiation pattern of an antenna can be explained by the frequency dependence of the effective permittivity, , of the slab. For a mesh of metallic wires, eff turns out to be eff of Drude type [1]: i p 2 2 eff( ) 1 , (2.2)
where the plasma frequency, , is defined by (1), and the damping factor depends on p the conductivity of the wires’ material. For a mesh of extremely conductive material, as
P a g e | 15 that normally seen in metals, is of order 0.1p [1]. The effective index of refraction of the slab can be defined from Eq. (2.2) in the usual way: neff effeff . Assuming
1
eff
(nonmagnetic slab4), this becomes
eff eff
n . Like , the effective index eff
eff
n is a complex quantity: neff neff ineff , where neff and neff are the real and
imaginary parts of neff, respectively.
It follows from Eq. (2.2) that properties of the metamaterial change substantially near the plasma frequency, . More specifically, an abrupt transition occurs from a strong p attenuation, when p, to a weak attenuation, when p. Experimentally, the transition should show itself as a substantial increase in the slab’s transmission coefficient. We observe this within the frequency range 10.511.5 GHz, see Fig. 2.3a. Another consequence of Eq. (2.2) is that a mesh metamaterial possesses neff 1
near . This can be used to improve directivity of electromagnetic radiation emitted by p a source placed inside the metamaterial slab [2]. In order to use this effect to the
maximum extent possible, one must select an operating frequency close to but still p greater than . This fact makes the estimation of p a very important problem. p
Estimation of from experimental transmission spectra, (ω), has been performed in p Refs. [1, 2]. In both references, however, corresponds to a different point within the p spectra. In [1], corresponds to transition from minimal transmission to ‘significant’ p
4 FR-4 materials with ½ ounce copper cladding is assumed to have µ
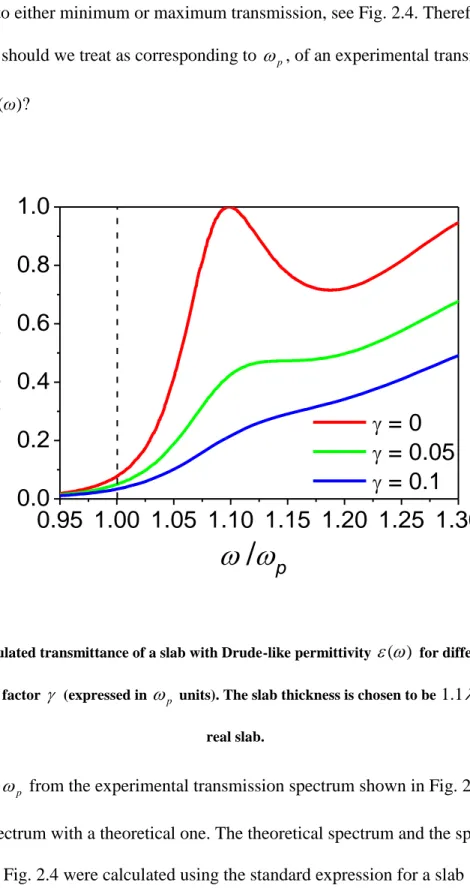
P a g e | 16 transmission. [2] corresponds to maximal transmission. Theoretically, does not p correspond to either minimum or maximum transmission, see Fig. 2.4. Therefore, at which point should we treat as corresponding to , of an experimental transmission p spectrum, (ω)?
0.95 1.00 1.05 1.10 1.15 1.20 1.25 1.30
0.0
0.2
0.4
0.6
0.8
1.0
Trans
mi
ttance
/
p
= 0
= 0.05
= 0.1
Fig. 2.4. Calculated transmittance of a slab with Drude-like permittivity () for different values of the damping factor (expressed in p units). The slab thickness is chosen to be 1.1p, as for the
real slab.
To estimate from the experimental transmission spectrum shown in Fig. 2.3a, we p fitted the spectrum with a theoretical one. The theoretical spectrum and the spectrum displayed in Fig. 2.4 were calculated using the standard expression for a slab
P a g e | 17 transmission coefficient [8] by using the effective permittivity, Eq. (2.2), for the slab material. The slab thickness was assumed to be the same as our metamaterial sample,
5 . 3
d cm. The plasma frequency p 2p, and the damping factor , of the
metamaterial were used as fitting parameters. The best fitting result is shown in Fig. 2.5. The metamaterial parameters estimated from this fit are p 10.5 GHz and 0.065p. The value differs by about 9% from the theoretical value, p p 9.6 GHz, calculated
from Eq. (2.1). Note that the theoretical spectrum (the solid line in Fig. 2.5) is a very good approximation for the experimental one (the dotted line in Fig. 2.55) at frequencies up to 11.5 GHz. It is in this frequency range the transition in the slab transparency occurs, enabling us to define its plasma frequency. It should also be mentioned that the slab transmission at the plasma frequency, (p), is about 5% in both the Figs. 2.4 and 2.5. This result is closer to that in [1], where (p) 0, whereas in [2] (p) = max.
9 10 11 12 0.0 0.2 0.4 Trans mi ttance GHz exp theor p = 10.5 GHz
P a g e | 18
Fig. 2.5. Theoretical fit to the experimental transmission spectrum. The p vertical dotted line marks
the experimentally observed plasma frequency. The value of 10.5 GHz is within 9% of the theoretically predicted value of 9.6 GHz.
Let us now analyze the angle dependence of the radiated power shown in Fig. 2.3b. In Fig. 2.3b, one can see the more directive nature of the main lobes at frequencies of 10.9 and 11.7 GHz, which are somewhat higher than the plasma frequency, p 10.5 GHz;
p
04 .
1 and 1.11p, respectively. Thus, this displays antenna directivity improvement (more directive). At these frequencies, the index of refraction of the slab should be less than 1. Such an improvement was reported earlier [2, 3] and was explained by a specific way in which a transparent slab with neff 1 bends rays incident on its boundaries. That explanation is based on simple geometrical optics consideration. Note, however, that according to geometrical optics, the slab effect on radiation directivity occurs only if the source of radiation is placed inside the slab (Fig. 2.6a). It is this case that was applied in [2]. In the case of an external source, which was applied in [3], as well as in our
experiments, a slab should not affect directivity of the source radiation. After leaving the slab, each source ray undergoes two consecutive refractions at each of the slab
boundaries, resulting in only lateral displacement of each ray (Fig. 2.6b). This fact was not considered in [3]. What, then, is responsible for the slab effect observed in [3], and in our experiments?
P a g e | 19
Fig. 2.6. Effect of a transparent slab with index of refraction less than unity on radiation from a source placed (a) inside and (b) outside the slab. In case (a), radiation is concentrated in directions
around the slab’s normal. In case (b), there is no concentration effect and ray spreading should
occur.
The directivity improvement can be explained, if the following two factors are considered simultaneously: The above mentioned phenomenon of rays bending on boundaries for a slab in which neff 1, and the appreciable attenuation of electromagnetic waves inside the real slab. Indeed, even at frequencies larger than the plasma frequency, p, the real slab is not completely transparent. This is confirmed since the slab transmission magnitude is less than 1; actually, less than 0.4 for our slab in the frequency region in
S S
P a g e | 20 which we are interested. Then, the larger the angle a ray travels at with respect to the slab’s normal, the larger the distance it will travel inside of the slab and, thus, the more attenuated it will experience before exiting the slab, see Fig. 2.7. Stronger attenuation of the peripheral rays manifests as the beam concentration near the slab’s normal. Note also that for an opaque slab neff 0, and we should use neff instead of neff.
Fig. 2.7. Effect of an opaque slab with index of refraction less than unity on radiation from an external source. The arrow thickness is proportional to the intensity of radiation.
It is clear from the above, that the slab’s effect on the directivity of an external source antenna will lessen with increased slab transparency, or index of refraction. We observed both a lesser directivity, as well as a higher transmittance, as the slab’s operating
frequency increases. A decrease in the operating frequency down to results in a p S
P a g e | 21 decrease in the slab’s index of refraction. This is advantageous for the directivity
improvement, as the material attenuation increases. However, the improvement at frequencies extremely close to is hardly distinguishable, due to the very strong p attenuation of radiation inside the slab. Recall that the slab’s transmittance at the plasma frequency is close to 5%. Furthermore, the directivity improvement might be influenced by the interference effects that are well known in optics of thin films, but this is not considered in this chapter, nor is the meta-antenna efficiency factor which will also play a role, but most likely in an increased directivity manner. These effects might be
responsible for the absence of improved directivity, at some frequencies in the examined frequency range where the necessary conditions (neff 1 и neff 0) are seemingly satisfied. All of this makes the directivity effect even more evident within only a narrow frequency range close to the plasma frequency, , of the mesh metamaterial. p
2.5 Chapter Conclusion
We experimentally studied the transmission coefficient frequency dependence, (), of a slab made from a mesh metamaterial, and the effect of the slab on antenna directivity when placed externally near the slab. Measurements were performed in a frequency range near the theoretical plasma frequency, , of the metamaterial. The experimental value p of the plasma frequency was estimated not by using specific points of the () curve, but by approximating the experimental curve with a theoretical one that was calculated for a slab with Drude-like permittivity. The experimental and theoretical values of differ p
P a g e | 22 from each other by approximately 9%. Thus, the theoretical expression for can be p applied not only in the case of cylindrical wires, but also for flat wires. Our experiments confirm previously reported slab effects on antenna directivity at operating frequencies near the slab’s plasma frequency, . However, this effect cannot be explained merely p by the fact that the effective index of refraction of the slab neff is less than 1, with
p
. We attribute the effect also to the attenuation of the electromagnetic wave inside the slab, among other issues not detailed within this chapter. We predict that the
frequency range in which the effect is pronounced should be quite limited. This
prediction is due to the fact that the effect vanishes in the case of both strong attenuation (at close to ) and weak attenuation (at p far from ), again along with other p issues not detailed within this chapter. Our results can be used in designing novel emitting and reception systems for which spatial or frequency discrimination is an important requirement.
P a g e | 23
Chapter Three: Low-loss Negative Index
Metamaterials for X, Ku, and K Microwave Bands
3.1 IntroductionThe research resented in chapter two was interesting but the large loss defeated many potential uses. To make this technology viable, loss needed to be lowered and a design process needed to be solidified. Recent research has shown some improvement in the design of metamaterials [18]. Metamaterials that have low insertion losses, wide bandwidths, and multi-frequency responses are prime candidates for use in microwave applications. The main objective of this chapter was to develop a design process for low-loss, wide bandwidth microwave metamaterials. Another issue with microwave negative index metamaterials (NIMs) is the mismatch between theoretical and experimental responses. For example, errors in center frequency of NIM pass-band filters are often unacceptable for practical applications. The second goal of this research was to achieve a better agreement between the theory and experiment by combining near-field imaging of electromagnetic waves (EM) and standard transmission measurements of the S21 to simulations. Finally, our goal was to design several metamaterial samples in different microwave bands to validate frequency scaling of the design process.
We used a commercial finite element method solver, ANSYS HFSS, and near-field infrared imaging, to adjust the parameters as described in Sections 3.2 and 3.5. These tools are essential in validating the propagation modes within the NIMs and their
P a g e | 24 corresponding EM fields. In this chapter, we present the experimental and theoretical results obtained for low-loss, wideband, high-fidelity NIMs for applications in the X (8-12.5 GHz), Ku ((8-12.5-18 GHz), and K (18-27 GHz) microwave bands. Specific design constraints were introduced to improve operational bandwidth, and a dielectric with a low loss tangent was used to lower the insertion loss.
3.2. Design of Microwave Metamaterials
Currently, there are several different designs of metamaterials based on of S-shaped split ring resonators (SSRR), as summarized recently by [19] . Accordingly, due to its low-pass and wideband characteristics, we selected the SSRR as a unit cell for our NIM designs. The magnetic permeability of a unit cell is a function of the geometrical parameters of the cell and is given by [4]
� = − +� −� ��� ��� – +� , (3.1) where: = � �� � � �� −� �� � ��� = � ��� −���� ��� = � ��� − � ��� ��� −���� ��� ,
P a g e | 25
� = �ℎ + � ℎ
− (3.2)
The parameters a, b, h, c, d and l are the geometrical parameters shown in Fig 3.1; � is the resistance of the metallic strips in each loop; is the fractional area of the surface covered by the loop in the S shape.
Eqns. (3.1) & (3.2) were used to estimate the resonance frequency of the cell while minimizing its electromagnetic losses. In addition, we used geometrical constraints on the metal (copper) portion of the unit cell. The dimensions of the unit cell and the spacing and thickness of the board are important design parameters as shown in Fig. 3.1. We selected the thinnest (0.508 mm) commercially-available board for use in our final designs.
Fig 3.1. (left) Example of HFSS simulation of SSRR with E-field and H-field orientation and wave propagation (k) direction; (right) unit cell with conventional dimensions labeled.
d l
P a g e | 26 The size constraint of the unit cell was that each dimension for both designs had to be less than one-fifth of the wavelength (/5). The prism materials consisted of 120 equally-spaced boards. The dimensions of the metamaterial cell are summarized in Table I. The model was extended to arrays of unit cells in order to simulate transmission in NIM flat slabs and prisms. The rationale for these constraints in the design of the K-band was to ensure that the material would be less sensitive to the orientation of incident power and for ease of manufacturing.
Table I. Geometrical parameters of the SSRR Unit Cells
3.3. Fabrication of Prisms
The metamaterial boards were fabricated commercially by CircuitsWest, Inc. using RO4003C with uniformly-sized unit cells arranged in regular arrays on both sides of the board with 10 unit cells in the direction of propagation of the electromagnetic waves and 50 unit cells in the perpendicular direction, as shown in Fig. 3.2. The uniform-sized boards were assembled into a slab by using a holder with equally-spaced slots. The slabs of material were characterized for their transmission and reflection coefficients (S-parameters) in the near-field by holding all components stationary on a bench and using
SSRR Design Parameter (mm)
Band
a
b
h
w
c
d
l
X-Ku
5.2
4.0
5.0
2.8
0.4 0.51 2.0
P a g e | 27 two microwave feeds and a network analyzer. After testing the S-parameters with the uniform slabs, the boards were cut into stair-step prisms to test the refraction of the electromagnetic waves.
Fig 3.2. (a) Photographs of the metamaterials with S-shaped, split-ring resonators; (b) K-band board and X-Ku prism with a 8.1 degree pitch; (c) K-band prism 13.6 degree pitch. Each prism achieved a maximum length in the direction of propagation with ten S-shaped unit cells. Each prism had eight stair stepped sections.
These angle and frequency-dependent characterizations were conducted in an anechoic chamber at the U.S. Air Force Academy (USAFA). Fig. 3.3 shows the metamaterial being tested in the anechoic chamber and on the benchtop using the Agilent 8753ES network analyzer. In this setup, the tripod holding the microwave receiving antenna rotated ~ 180 degrees, while the material being tested was held in an absorbing foam window. The material was stationary on top of a Styrofoam box with floor supports above the rotating platform. Transmission measurements were recorded over a semicircle of the receiving antenna. The distance from the transmitter to the receiver was 9.14 meters, ensuring the far-field measurement conditions.
P a g e | 28 Transmitting Antenna Receiving Antenna Agilent Network Analyzer Rotating Platform Prism Foam Oo -90o +90o Not to scale
Fig 3.3. Diagram of the anechoic chamber (left) and photo of the test setup (right), which was used to test the metamaterials. The left side shows a sketch of the anechoic chamber with the rotating pedestal on which the sample was mounted. The distance between the transmitting antenna and the
sample was 9.14 m. The distance, d, between the sample and the receiving antenna was 0.76 m.
3.4. Experimental and Theoretical Characterization of the Metamaterials
Fig. 3.4 shows far-field experimental and simulated transmission spectra (S21),
vertically-polarized incident electromagnetic wave through the uniform slab of metamaterial. Within the target frequency (12-13 GHz), the slab of metamaterial had a high transmission band with less than 5 dB attenuation. The HFSS simulation results
compared fairly well with the experimental transmission spectra, with the transmission band around 11.5-13 GHz, with the negative index beginning about 12.5 GHz and
P a g e | 29 occurring at higher frequencies. The model and experimental result on the high-frequency (negative index) side of the pass-band indicate good agreement.
Fig. 3.4. Comparison of the experimental measurements and HFSS theoretical simulation (dotted curve) of the transmission S21 through the homogeneous slab of metamaterial designed for the X-Ku
band. The vertical dashed line indicates the positive and negative index of refraction sides for the transmission; the dashed vertical line delineates the positive and negative indices of refraction.
After measurements of the transmission through the slab, several ‘stair-step’ prisms were modeled to estimate index of refraction for selected frequencies. Accordingly, a X-Ku uniform slab was cut into a prism to prove directly the negative refraction of a plane electromagnetic wave transmitting through the prism. An example of a simulation of transmission through prism is shown in Fig. 3.5, with a diagram of the prism.
-40 -35 -30 -25 -20 -15 -10 -5 0 8 10 12 14 16 18 dB Frequency [GHz] S21 HFSS S21 Experimental Negative n<0 Positive n>0
P a g e | 30
Fig 3.5. An HFSS simulation (left) at 12.5 GHz through an extended material array transmission
through a prism (right) is shown. The ‘stair-step’ prism was created by eliminating one cell depth per
step. Transmitted energy through the prism is considered positive or negative depending on which side of normal surface of the prism. At 12.5 GHz, as shown the index transitions to negative.
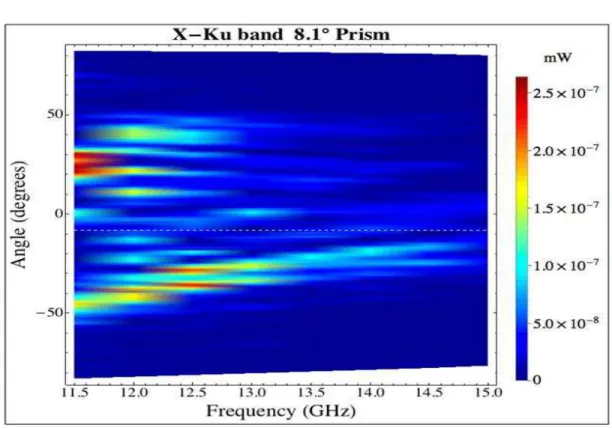
An 8.1o prism was next constructed and was inserted into a window of microwave-absorbing foam and held stationary while the receiver was rotated in a semicircle, as depicted in Fig. 3.3 of the anechoic chamber. This process was repeated at different frequencies across the X-Ku band (8-18 GHz) to generate spectral-spatial measurements, as shown in Fig. 3.6. Negative angles indicate negative indices of refraction.
P a g e | 31
Fig 3.6. Experimentally-measured intensity of the transmitted wave as a function of the frequency and angle. The angle is measured relative to the normal of the prism so negative angles correspond to a negative index of refraction whereas the positive angles correspond to a positive index of refraction.
Fig. 3.7 shows the experimentally-measured power of the electromagnetic wave refracted at the back surface of the prism at different angles relative to the normal to the surface. The measurements were performed at different frequencies in the X-Ku range. Negative angles of refraction correspond to negative indices of refraction according to the Snell’s law, i.e., � sin � = � sin � , where � is the index of the metamaterial, � = . is the index of air, � is the angle of incidence inside the prism (which is equal to the angle of the prism), and � is the measured angle of refraction, which corresponds to the measured angle of peak transmission plus the angle of incidence inside the prism. The measurement of power-angle transmission with the most pronounced negative refraction
P a g e | 32 occurred between 12.5 and 15 GHz. For instance, at 13.75 GHz the data indicated a peak transmission power at about -22o, as shown below.
Fig 3.7. Experimentally-measured power as a function of the angle of refraction of a vertically-polarized electromagnetic wave (the frequency 13.75 GHz,) by the prism. The peak at -22 degrees
relative to the normal to the surface of the prism indicates negative refraction by the prism.
Fig. 3.8 shows the negative index of refraction of the X-Ku prism calculated by using Snell’s law. For instance, the index of refraction was � ≅ −3. at 13.5 GHz with a negative index well over a 2-GHz band. Further, the insertion loss measured for the X-Ku material was 1.69 dB/cm or, equivalently, 0.42 dB/cell, which was comparable to previous SSRR designs. Overall, the results of the X-Ku measurement showed a negative index with modest insertion loss. The positive indices below frequencies of 12.5 GHz are indicated by the blue line with pronounced peak prior to sign transition; the negative indices are indicated by the red line.
-80 -60 -40 -20 0 20 40 60 80 100 0 0.5 1 1.5 2 2.5 3 3.5 4 4.5 5x 10 -7 Degrees P ow er m W 1375 MHz
P a g e | 33
Fig 3.8. Experimentally-determined indices of refraction of the metamaterial fabricated for the X-Ku band (blue line shows positive indices; red line shows negative indices). This was determined by taking the maximum intensity observed at a given frequency and assuming that is the refracted
beam.
3.5 Experimental and theoretical results for the K-band slab
The specific design resonance frequency of 18-20 GHz had a target negative index sub-band of 20.25 to 21.25 GHz. The sub-sub-band corresponded to an existing satellite signal of interest, which may be explored in future investigations. As stated previously, a slightly different design method was used in the K-band to impose symmetry on the unit cell and uniform active area constraints. As seen in Fig 3.9, the simulated and experimental data showed somewhat different bandwidths but better agreement than had been seen for the X-Ku band material in Fig 3.4 or from other authors [4]. The simulated data predicted a band pass region (when attenuation less than -3dB) from 19.6 GHz to 21.2 GHz. The
8 9 10 11 12 13 14 15 -5 -4 -3 -2 -1 0 1 2 3 4 5 GHz In de x of R ef ra ct io n
P a g e | 34 experimental results gave much wider band pass region of 18.7 GHz to 21GHz, this result is very welcomed but an oddity as to why they do not agree.
Fig 3.9. Comparison of the HFSS simulation (dotted blue line) and experimental (red) transmission through K-band (20 GHz) metamaterial: The positive to negative index transition is indicated with a
vertical dashed line near 20 GHz.
Fig. 3.10 shows a predominantly positive index material for frequencies under 20 GHz and becomes predominately negative index between 20.25 to 21.25 GHz. A fundamental transition occurred near that frequency. The power that was transmitted through positive angles at lower frequencies shifted to negative angles; the material became a
P a g e | 35
Fig 3.10. The experimentally-measured intensity of the transmitted electromagnetic wave is shown as a function of the frequency and angle relative to the normal surface of the prism
Fig. 3.11 shows the transmission measurements at 21 GHz (K-band). At this frequency, the data indicated that the peak transmission power occurred at about -40°. The insertion loss for the K-band was measured to be 0.95 dB/cm or, equivalently, 0.285 dB/cell. We attributed the modest reduction in insertion loss over similar SSRR unit to the increased homogeneity due to unit cell symmetry of the design, but further analysis is needed to confirm this assumption. The insertion loss, is nearly one dB less than had been previously observed [4].
Fig. 3.12 shows that the index values that were measured for a 12.5o prism. In the figure, the positive index of refraction in this dataset is on the lower frequency side of the center frequency, while the negative index is on the high frequency side.
P a g e | 36
Fig 3.11. Experimentally-measured absolute power as a function of the angle of refraction of the vertically-polarized electromagnetic wave (frequency = 21 GHz, K-band) by the metamaterial prism.
The peak at -40 degrees relative to the normal to the surface of the prism indicates negative refraction by the prism.
Fig 3.12. Experimentally-determined index of refraction of the metamaterial fabricated for the K band: Positive indices in blue; negative indices in red. This was calculated by assuming the maximum
power transmitted power at any frequency corresponds to the refracted beam.
-1000 -80 -60 -40 -20 0 20 40 60 80 100 0.5 1 1.5 2 2.5 x 10⁻¹⁰ Degrees mW K/Ka @ 21 GHz P o w e r mW 19 19.5 20 20.5 21 21.5 -3 -2 -1 0 1 2 3 4 GHz In de x of R ef ra ct io n
P a g e | 37 3.6. Infrared Imaging of the Transmitted EM Waves
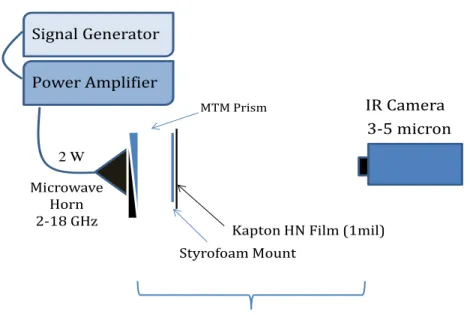
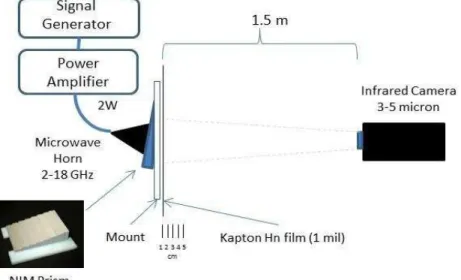
Infrared imaging is a proven experimental tool for studying EM waves.[20] Imaging the EM fields as they exit the prism is an additional means of comparing the output of models and experimental measurements, which might well reveal microwave modes, as in the waveguides. The equipment setup shown in Fig 3.13 uses an IR camera (3-5 microns) to capture images projected on Kapton™ HN film at graduated distances of 10, 20, 30, 40, and 50 mm.
Fig 3.13. Test setup for IR imaging of EM fields, Kapton HN Film is not conductive enough to perturb the field.
Our analysis indicated that a thermal contrast range of 5.24 oC was possible in the infrared based on a power of 2 W, an area of 12 in2, and Kapton film-specific heat specifications. Fig 3.14 shows a few calibration images (21-26 oC) through the X-Ku metamaterial that show lobes of energy for 12.5 GHz. The maximum thermal contrast
Signal Generator
Power Amplifier
Kapton HN Film (1mil)
MTM Prism Styrofoam Mount IR Camera Microwave Horn 2-18 GHz 3-5 micron 1.5 m 2 W
P a g e | 38 apparent in these images was about 5 oC, which was slightly less than the expected value of 5.24 oC. The reasons for the lower measured contrast might be power loss in the
cable-antenna interface and/or unaccounted-for propagation losses between the cable-antenna and the Kapton film. In the closest IR frames (bottom, incremental distances), the dominant heat profile indicated a negative refraction. However, farther away from the prism, the dominance of the negative index side energy is not as clear.
Fig 3.14. IR images are perpendicular to propagating wave taken with IR imaging. The IR images were taken at distances of 0, 10, 20, and 30 mm from the surface of the metamaterial using Kapton
film.
A higher resolution simulation for the incremental distances is shown in Fig. 3.15 for the 20 mm distance from the prism. The IR image for the same distance is below the HFSS simulation. The thermal contrast (21-26 oC) translates linearly to the E-Field scale (1200-3500 V/m). At this resolution, the dual transmission lobes were evident in both the simulated and measured results; as a result, new spatial dimensions for validating simulations and measurements are possible.
P a g e | 39
Fig 3.15. HFSS E field intensity (top) with lobes compared to an IR image (bottom) at (1 cm) from the prism
3.7. Chapter Conclusion
Microwave-domain EM metamaterials are fairly well-developed. However, issues remain that must be resolved in order for industry to fully embrace these materials as viable solutions for issues associated with other devices. NIMs still exhibits high insertion loss and difficulty of design; in addition, uses of the devices traditionally have been difficult due to the inhomogeneity of the unit cells. To help address these remaining deficiencies, this chapter reports the results of a design process using specific constraints on the SSRR
P a g e | 40 and high-grade materials designed for the microwave domain to keep insertion loss low. These constraints and materials lead to us producing much wider bandwidth than
expected from theory. Additionally, this wider bandwidth was close to agreement with what was seen in the simulation which had not been observed previous work [4]
Table II reports the size constraints of the SSRR unit cell and the board for both designs. The K-band design required the most stringent constraints due to the symmetry of its unit cell to enhance homogeneity and electrically-large, overall configuration to avoid
diffraction. The K-band design added the following constraints to the design of the SSRR unit cell parameters: w/b ratio < 0.7, h/a ratio < 0.7, a/b = w/h = 1. The 0.7 ratio was chosen because it produced a large band pass region in simulations which was seen to be even greater than expected in experimental results.
Table II. Design of Unit Cell SSRR and Material Constraints
It is important to note that the SSRR design offers a large pass-band, but only a portion (slightly less than half the pass-band) represents the dominant negative-index properties. That portion is located on the high-frequency side of the pass-band, as presented in Table III, along with the insertion loss. Since the raw materials in both the X/Ku and K-band were the same, the design approach using unit cell symmetry (in the K-band design)
Band () Unit Cell S-Shape SSR Cell Details Board Size (mm) /x Ratio (b/a) Ratio (w/b) x
X-Ku 25 x = 4.8 0.77 0.7 x = 5.9
P a g e | 41 differentiates it from other similar designs, which could be a possible explanation for more predictable agreement between simulation and test results.
Table III. Negative Sub-bands and Insertion Loss
The approximation of the exact symmetry in the unit cell design correlated well with simulation-test fidelity and may facilitate future 3-D prototypes. Furthermore, metamaterials based on symmetrical unit cells are easier to fabricate in bulk. When combined with direct far-field microwave measurements, IR imaging enhances the investigator’s ability to compare EM fields in high-resolution 3-D to verify negative indices within frequency ranges. As a result, new spatial dimensions for validating simulation and measurement are possible.
Band Res. Freq. Negative Insertion Loss (GHz) Subband (GHz) dB/cm dB/cell X-Ku 12.5 13.5 (+/-) 0.75 1.69 0.422
P a g e | 42
Chapter Four: Infrared Imaging of Microwave
Negative Index Metamaterials
4.1 Introduction:
The Infrared imaging conducted in chapter three was extremely promising and we wanted to fully develop the technique as applied to metamaterials. Infrared imaging is a proven experimental tool for studying electromagnetic waves [20], however, to our knowledge, its utility for electromagnetic research of metamaterials has not been explored previously to our work. Although infrared imaging is an indirect measurement of the electric field intensity, these measurements are highly correlated for the direct microwave transmission measurement, as a result, the image analysis of these material properties afford precise mapping in higher dimensions without the graduated
positioning that direct measurements might require; for example, microwave
transmission can be projected in three dimensions (3-D) through uniform as well as irregular-shaped materials rendering a spatial projection that is difficult to achieve with direct microwave measurements.
Since the electric field incident on heat-sensitive films transduce a proportional response, heat contrast creates an image using commercially available infrared
cameras, translating electric field (V/m) to temperature (degrees). The high spatial resolution of detector elements in the camera and the calibrated temperature sensitivity
P a g e | 43 of the film, enable an accurate digital image of the electric field. In the near-field, microwave wave on the order of 1Watt have sufficient power to radiate through a metamaterial slab or prism (ten cells thick) and produce transmission that can be imaged when the entire field-of-view of the camera and exposed film are carefully aligned.
4.2 Theory
As laid out in previous chapters, there are many excellent sources devoted to the theory of metamaterialss and their applications [15,21,22]. For this reason, only a brief
introduction is appropriate in order to focus on the infrared imaging measurements and analysis for metamaterials. In short, metamaterials exhibit a number of unique properties, such as negative index of refraction, when their permittivity ( ) and permeability ( ) are both negative at the same frequency. The index of refraction (n) is related to the dielectric permittivity and magnetic permeability of a medium by Eq. 4.1.
r r
n
(4.1)In addition, the index of refraction of a material is defined as the ratio of the speed of wave propagation (c) in a vacuum to the speed in the medium(
m) asm
m
c
P a g e | 44 The theory of the negative index of refraction was first suggested by Veselago [9]. This theoretical work evaluated the possibility of materials with negative values of permittivity and permeability and proposed that such materials were consistent with Maxwell’s equations for electromagnetism. Three decades later, a renewed interest in metamaterialss was generated [1,11,12] which proposed that resonators could provide negative permeability, while a wire mesh could provide negative permittivity for a particular matching frequency. All of this research supports the variation of Snell’s law (Eq.4.3) where the index of refraction (n) of an engineered material can be negative at some frequencies. ) sin( ) sin( 1 n m n (4.3)
Research done in [18], explained a phenomena described as “enhanced diffraction” witnessed in experiments of gratings on surfaces of metamaterialss. This is a
modification of Snell’s law for this particular form of the material, to account for a minor additional beam of energy measured in the transmission through a ‘stair-stepped’ prism surface. ) sin( ) sin( n m d m (4.4)
The additional term,
m, is considered relevant when the ratio of those terms is on the same order; in the case of microwave metamaterial design, that occurrence is not unusual. Note that the additional term is not a function of angle, and thus can be discriminated. Because of issues such as the ‘enhanced diffraction’ that was observed in Smith’s 2000 paper but not reported and not understood until 2004, the analysis ofP a g e | 45 metamaterials is not a simple, straight-forward task. Reconciling data from similar designs and experimental methods is sometimes complex, inviting new approaches to study the electromagnetic properties more completely.
The use of infrared imaging to measure electric field intensity is not new; its theory and utility in are well-established, nonetheless its use in metamaterial research is novel. The conversion of EM field strength onto a heat-sensitive film projects a thermal contrast on an image plane that can be imaged by an infrared camera, creating a high-resolution 2-D image representing the electric field. When a series of images at incremental distances are collected, a 3-D rendition of the electric field intensity is captured. When electromagnetic waves within the design frequencies are transmitted through the metamaterial, transmission occurs on the negative side (as shown),
otherwise transmission is dominant on the positive side of the normal midsection line, as depicted in Fig. 4.1.
Fig 4.1. A sketch of the negative refraction measurements based on the near-field 3-D Infrared Imaging. Each ‘image plane’ is a sheet of Kapton film which is not conductive enough to