The East Asian Crisis of 1997:
Causes and China’s Resilience
Paper within Economics
Authors: Erik Heldebro
Jaroslav Veresjtjaka
Tutors: Per-Olof Bjuggren
Jan Weiss
Abstract
During 1985-1995, countries in East Asia have undergone an outstanding development. With the growth of GNP per capita during the ten years ranging from 4.8% in Hong Kong to 8.4% in Thailand (as compared to 0.8% in high-income economies during the same period), the economies were referred to as "a miracle" in the World Bank's report of 1993. However, with almost no apparent warning signs, the economies were hit by a severe recession in 1997. One economy that has managed to stay resilient to the crisis was China, continuing to grow at a steady rate. In this paper we investigate the events of the East Asian crisis of 1997. Our goal is to pinpoint the most significant indicators that have caused the, up until 1997, rapidly growing economies of East Asia to fall into se-vere recession. Then, within the framework of the defined variables, the analysis section compares the East Asian crisis-affected countries with China. This will be done in order to draw conclusions regarding China’s resilience to this crisis.
Key words: Financial Crisis, Currency Crisis, Banking Crisis, China, East Asian Crisis, Capital Account Liberalization,
Table of Contents
Abstract ... i
1
Introduction ... 1
2
Methodology ... 2
2.1 Structure ... 23
Background ... 3
3.1 High Growth and Sound Macroeconomic Fundamentals in East Asian Countries ... 3
3.2 Structural Weaknesses of the Asian Economies and the Crisis of 1997……... ... 5
3.3 The Events of 1997 ... 6
4
Frame of Reference ... 8
4.1 Currency Crises ... 8
4.2 Trilemma in International Finance ... 10
4.3 First Generation Models on Currency Crises ... 11
4.4 Second Generation Models on Currency Crises ... 12
4.5 Banking Crises and Third Generation Models ... 13
5
Literature Review on Asian Currency Crises ... 15
5.1 Causes ... 15
5.1.1 Moral Hazard ... 15
5.1.2 Short-Term Foreign Debt and Improper Policy Sequencing ... 15
5.2 Econometric Studies ... 16
5.2.1 Frankel and Rose (1996) ... 16
5.2.2 Kaminsky, Lizondo and Reinhart (1998) ... 17
5.2.3 Sachs, Tornell and Velasco (1996) ... 19
5.2.4 Demirgüç-Kunt and Detragiache (1998) ... 20
5.3 Conclusions of the Models ... 20
6
Analysis ... 22
6.1 Indicators ... 22
6.2 Foreign Direct Investment (FDI) ... 23
6.3 GDP Growth ... 23
6.4 Short-term Debt (% of Reserves) ... 24
6.5 Financial and Capital Account Liberalization ... 24
6.6 Domestic Credit ... 25
6.7 Real Interest Rates ... 26
7
Conclusion ... 28
8
Further Research ... 29
References ... 30
1 Introduction
During the last decade of the 20th century, the global economy was significantly dis-turbed by a wave of economic crises, which negatively affected many countries across the globe - both developed and developing countries. The story can be dated back to the fall of 1992, when Britain, Italy and Spain were forced to leave the ERM (European Ex-change Rate Mechanism) following the EMU (Economic and Monetary Union of the European Union) crisis of 1992-1993, leading to the collapse of the ERM1.
Shortly after, during 1994-1995, a crisis hit Mexico, quickly spreading to the neighbor-ing Latin American economies. Due to substantial capital withdrawals from the econo-my, the Mexican government was unable to maintain the fixed exchange rate of Peso. As a result, the Peso was forced to float freely and consequently experienced extreme depreciation over a short period of time. Due to such rapid depreciation along with capi-tal outflows, the government was unable to cover its obligations, which forced an eco-nomic collapse.
In the middle of 1997 a crisis hit Thailand and quickly spread to other neighboring countries in East Asia. The ones affected the most, apart from Thailand, were Indonesia, Philippines, Malaysia, South Korea and Singapore (Bustelo, 1998). The crisis caused substantial currency depreciation in the affected countries, significantly distorted the stock markets and led the rapidly growing economies into a severe recession.
China was one very notable exception to the rest of East Asia, in terms of the magnitude of the negative effect the crisis had on the country’s economy. Unlike its neighbors, the Chinese economy was affected to a lesser degree, while continuing to grow at a very significant rate.
The purpose of this paper is two-fold: First, the paper aims to pinpoint the fundamental causes of the East Asian crisis of 1997. Secondly, the paper aims to analyze how China managed to stay resilient to this crisis, given the severe fate of its neighboring countries (i.e. why did the causes underlined in the first part not affect China).
2 Methodology
The topic of this paper is approached in two steps. First, with the aim of detecting gen-eralizable patterns as to the importance and effects of certain indicators in the context of the East Asian crisis of 1997, a simplified meta-analysis of existing econometric studies on the topic will be conducted. The aim of the analysis is to pinpoint the key indicators that, according to various authors, played the most integral role in the development and the spread of the crisis.
Secondly, the abovementioned indicators are descriptively analyzed for the case of Chi-na. The ultimate aim of this paper is to, within the framework of defined indicators, take a stand on how China managed to stay resilient towards the East Asian crisis of 1997.
2.1 Structure
The background section introduces the reader to the East Asian crisis of 1997 and pro-vides an analysis of the macroeconomic environment in the region prior to, during and shortly after the crisis. The frame of reference section provides an overview of various branches of economic theory on the topic of financial crises, developed by academics over the year. The following, literature review, section is dedicated to the analysis of various econometric studies conducted by academics on the topic of East Asian crisis of 1997. Thereafter the analysis section outlines the significant indicators linked to in-creasing the probability of the East Asian Crisis. Relevant data, for China as well as for the crisis-affected countries, for each indicator is then presented in this section in order to draw conclusions as to why China stayed resilient to this crisis. The conclusion sec-tion will give a detailed account of the main findings in relasec-tion to the research ques-tion.
3 Background
Macroeconomic data (presented in a table-form in the appendix) is referred to in this chapter to overview and analyze the macroeconomic environment in East Asia prior to, during and shortly after the crisis of 1997. The story behind the events of the East Asian crisis is also elaborated on in this chapter, by making references to some academic stud-ies.
3.1 High Growth and Sound Macroeconomic Fundamentals in
East Asian Countries
As can be seen from Tables 1 and 2 in the appendix, prior to 1997, countries in East Asia2 have experienced rapid growth – both in terms of GDP, representing overall
de-velopment in the economy and in terms of GDP per capita, representing dede-velopment in the standards and quality of living for the population.
The growth rate of GDP per capita in East Asian countries was outstanding. In 1996, for instance, the growth was 8.85% in China, 7.28% in Malaysia, 6.12% in Indonesia, 5.98% in South Korea, 4.83% in Thailand, 3.49% in the Philippines and 3.34% in Sin-gapore. To put things into perspective, the growth rate of GDP per capita in all low and middle-income economies was around 0.4% during 1985-1995 and around 0.8% for high-income economies (World Bank, 1997).
2The analysis in this paper is limited to the countries most negatively affected by the crisis - Thailand, Indonesia, Malaysia,
Philip-Table 1: Annual GDP Growth (%)
Country/Year 1991 1992 1993 1994 1995 1996 1997 1998 1999 2000 China 9,20 14,20 14,00 13,10 10,90 10,00 9,30 7,80 7,60 8,40 Indonesia 8,93 7,22 7,25 7,54 8,40 7,64 4,70 -‐13,13 0,79 4,92 Malaysia 9,55 8,89 9,89 9,21 9,83 10,00 7,32 -‐7,36 6,14 8,86 Philippines -‐0,58 0,34 2,12 4,39 4,68 5,85 5,19 -‐0,58 3,08 4,41 Singapore 6,49 7,03 11,48 10,58 7,28 7,63 8,51 -‐2,17 6,20 9,04
Republic of Korea 9,39 5,88 6,13 8,54 9,17 7,00 4,65 -‐6,85 9,49 8,49
Thailand 8,56 8,08 8,25 8,99 9,24 5,90 -‐1,37 -‐10,51 4,45 4,75
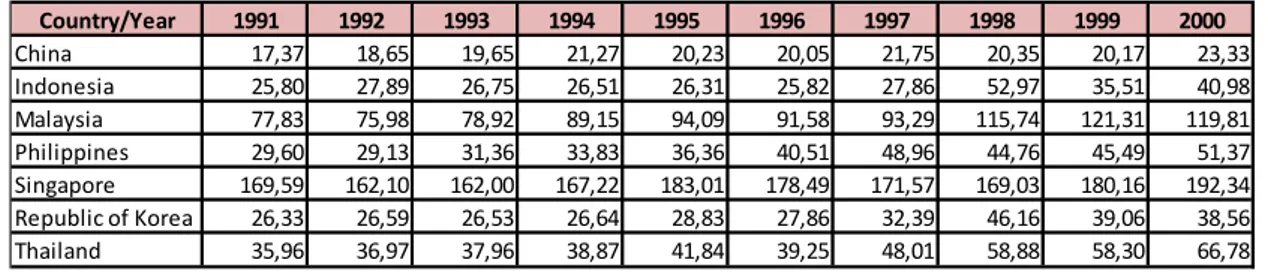
By looking at the growth of exports to GDP ratio from 1991 to 1996 (Table 3), it is ap-parent that export-oriented growth was a feature common to all the East Asian econo-mies, being the particular case for Malaysia (an increase of 13.72%), the Philippines (an increase of 10.91%) and Singapore (an increase of 8.9%).
In general, the macroeconomic fundamentals were very strong in all of the East Asian economies. Table 4 illustrates relatively low and stable rates of inflation (with an excep-tion for China during 1993-1996). Narrow public debt, especially in China and South Korea is apparent from Table 5. Tables 6 and 7 highlight high rates of savings and in-vestments as a common feature of all the East Asian economies. In addition, low labor costs combined with increasing productivity, high interest rates (relative to the Western countries), stable exchange rates and a hospitable investment environment have attract-ed high capital inflows and resultattract-ed in high capital formation, as can be seen from Ta-bles 8 and 9 in the appendix.
Table 2: Annual GDP per Capita Growth (%)
Country/Year 1991 1992 1993 1994 1995 1996 1997 1998 1999 2000 China 7,72 12,81 12,70 11,83 9,70 8,85 8,19 6,77 6,67 7,55 Indonesia 7,12 5,50 5,58 5,92 6,81 6,12 3,27 -‐14,29 -‐0,54 3,55 Malaysia 6,62 6,07 7,12 6,49 7,10 7,28 4,69 -‐9,60 3,61 6,31 Philippines -‐2,97 -‐2,01 -‐0,22 2,03 2,33 3,49 2,87 -‐2,74 0,86 2,20 Singapore 3,49 3,86 8,69 7,16 4,07 3,34 4,93 -‐5,44 5,35 7,17
Republic of Korea 8,38 4,92 5,19 7,57 7,62 5,98 3,67 -‐7,52 8,71 7,58
Thailand 7,36 7,13 7,43 8,15 8,28 4,83 -‐2,46 -‐11,56 3,20 3,51
Source: World Bank (World Development Indicators)
Table 3: Exports of Goods & Services (% of GDP)
Country/Year 1991 1992 1993 1994 1995 1996 1997 1998 1999 2000 China 17,37 18,65 19,65 21,27 20,23 20,05 21,75 20,35 20,17 23,33 Indonesia 25,80 27,89 26,75 26,51 26,31 25,82 27,86 52,97 35,51 40,98 Malaysia 77,83 75,98 78,92 89,15 94,09 91,58 93,29 115,74 121,31 119,81 Philippines 29,60 29,13 31,36 33,83 36,36 40,51 48,96 44,76 45,49 51,37 Singapore 169,59 162,10 162,00 167,22 183,01 178,49 171,57 169,03 180,16 192,34
Republic of Korea 26,33 26,59 26,53 26,64 28,83 27,86 32,39 46,16 39,06 38,56
Thailand 35,96 36,97 37,96 38,87 41,84 39,25 48,01 58,88 58,30 66,78
3.2 Structural Weaknesses of the Asian Economies and the
Crisis of 1997
Given the dynamic economic growth in all of the East Asian economies combined with very strong economic fundamentals, little warnings of an upcoming crisis were ex-pressed. Asian economies were referred to as “a miracle” in the World Bank’s report of 1993 and no economic problems were anticipated neither by the Asian Development Bank (ADB), nor the International Monetary Fund (IMF) prior to 1996. Nevertheless, despite rapid growth and sound macroeconomic fundamentals, certain weaknesses could be spotted in some of the East Asian economies.
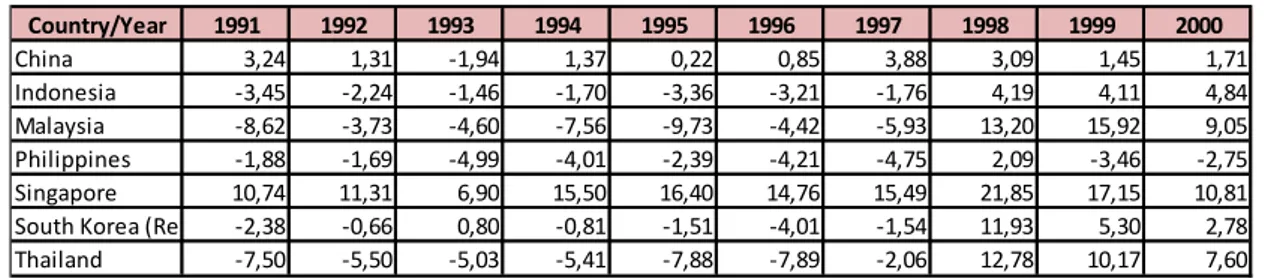
For instance Thailand, as can be seen in Table 10, along with Malaysia, the Philippines and to a lesser extent South Korea, were faced with relatively high current account defi-cits in the years before the crisis. However, one should consider that the excess of capi-tal inflows could in fact be beneficial to the economies, as in these cases the money were used mostly to finance investments - can be seen from comparing tables 6 and 7. Extensive foreign debt was another weakness according to Bustelo (1998). This was mainly attributed to Thailand, Indonesia and South Korea. As the author also points out, to resolve the problems associated with overvalued currencies and fixed exchange rates, countries in East Asia wanted to rapidly execute financial markets deregulations and capital account liberalization. It is important to point out that at that time the fixed ex-change rates regime was used as an instrument to support macroeconomic policies that would control inflation and attract foreign capital. Due to this, as well as immature banking system, the deregulations and liberalization of the capital account were started, but never completed.
Table 10: Current Account Balance (% of GDP)
Country/Year 1991 1992 1993 1994 1995 1996 1997 1998 1999 2000 China 3,24 1,31 -‐1,94 1,37 0,22 0,85 3,88 3,09 1,45 1,71 Indonesia -‐3,45 -‐2,24 -‐1,46 -‐1,70 -‐3,36 -‐3,21 -‐1,76 4,19 4,11 4,84 Malaysia -‐8,62 -‐3,73 -‐4,60 -‐7,56 -‐9,73 -‐4,42 -‐5,93 13,20 15,92 9,05 Philippines -‐1,88 -‐1,69 -‐4,99 -‐4,01 -‐2,39 -‐4,21 -‐4,75 2,09 -‐3,46 -‐2,75 Singapore 10,74 11,31 6,90 15,50 16,40 14,76 15,49 21,85 17,15 10,81
South Korea (Republic of Korea)-‐2,38 -‐0,66 0,80 -‐0,81 -‐1,51 -‐4,01 -‐1,54 11,93 5,30 2,78
Thailand -‐7,50 -‐5,50 -‐5,03 -‐5,41 -‐7,88 -‐7,89 -‐2,06 12,78 10,17 7,60
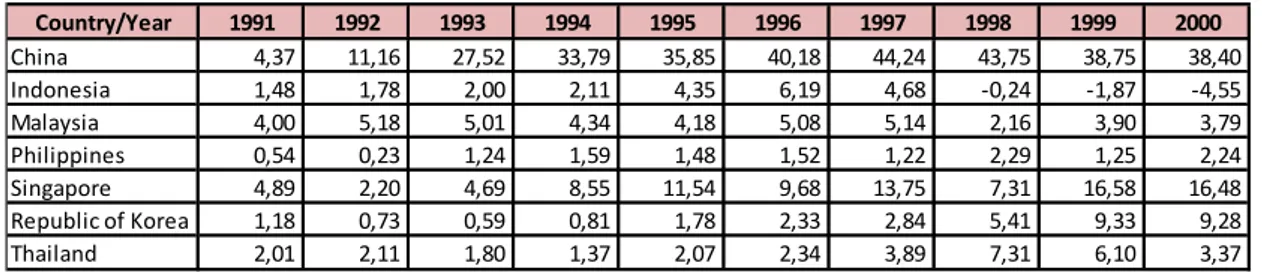
As mentioned in the previous section, capital inflows to the region have increased sub-stantially during the years prior to the crisis. As can be seen from Table 8, East Asian economies have received FDI of 67.31 billion USD in 1996 as compared to 18.47 bil-lion USD in 1991. An increase was the case for all countries, but most significant for China, who has experienced the most significant increase (from 4.37 billion USD in 1991 to 40.18 billion USD in 1996). While in most cases capital inflow is a desirable goal for an economy, Bustelo (1998) highlights three unfavorable consequences of what he refers to as “a process of overinvestment”: (1) upward pressure on prices in non-tradable goods, leading to a bubble in the property market; (2) significant currency ap-preciation, which slowed down the export-oriented growth due to decreasing interna-tional price competitiveness; and (3) substantial increase in domestic bank lending, which, by stimulating investment and imports, has worsened the current account.
3.3 The Events of 1997
According to Krugman (1999), the first symptom of an upcoming crisis was a slow-down in exports. This was partially due to a growing current account deficit bubble, causing overvalued exchange rates and partially due to the appreciation of the US dol-lar. Given the export-oriented growth of the region, as discussed in the previous sec-tions, this decline was particularly damaging for the economy. In light of this slow-down, significant overinvestment in real estate became notable. Housing prices started to decline and the stock market has followed, which made investors start to question the credibility of the financial institutions.
Given the abovementioned disturbances, in the beginning of 1997, particularly in Thai-land, agents started to anticipate possible devaluation of the currencies – a potential move by the government to boost the export-based economy. Additional pressure was therefore put on the currency by the speculators.
Table 8: Foreign Direct Investment Net Inflow (in USD Billion)
Country/Year 1991 1992 1993 1994 1995 1996 1997 1998 1999 2000 China 4,37 11,16 27,52 33,79 35,85 40,18 44,24 43,75 38,75 38,40 Indonesia 1,48 1,78 2,00 2,11 4,35 6,19 4,68 -‐0,24 -‐1,87 -‐4,55 Malaysia 4,00 5,18 5,01 4,34 4,18 5,08 5,14 2,16 3,90 3,79 Philippines 0,54 0,23 1,24 1,59 1,48 1,52 1,22 2,29 1,25 2,24 Singapore 4,89 2,20 4,69 8,55 11,54 9,68 13,75 7,31 16,58 16,48 Republic of Korea 1,18 0,73 0,59 0,81 1,78 2,33 2,84 5,41 9,33 9,28 Thailand 2,01 2,11 1,80 1,37 2,07 2,34 3,89 7,31 6,10 3,37
Speculative attacks ensued on the Thai currency and Thailand was forced to run down its reserves to defend the currency. On July 2, 1997, after months of asserting that it would do no such thing, the government of Thailand abandoned its efforts to maintain a fixed exchange rate for the baht, resulting in rapid depreciation of over 20 per cent with-in a few days. Market agents immediately expected the same to happen with-in the neighbor-ing countries and started to speculate heavily against the other currencies in the region. In the matter of days Malaysia, Indonesia and the Philippines followed the Thai exam-ple.
As we can see from (previously presented) Table 1, already in 1997, the growth rate of GDP in Thailand became negative, decreasing by 7.27% as compared to the previous year and by an additional 9.14% in 1998; the other neighboring economies were affect-ed in the same negative way. As a result of the crisis all (except for China) have experi-enced a negative GDP growth during 1998 and by the year of 2000 only Singapore and South Korea have managed to catch up with the growth rates of GDP they had prior to the crisis.
While the economies of all the countries in East Asia were significantly damaged by the crisis, turning from a rapidly increasing to a negative growth rate of the GDP, it is clear that the Chinese economy was not affected nearly to the same degree. The annual growth rate of GDP did slow down in China during 1997-1999. However, the decrease was incomparable to that of the other countries.
While the other countries were forced to give up the exchange rate peg and were put in-to severe recession by the crisis, China has managed in-to maintain the RMB pegged in-to the USD, keeping a competitive price for it’s exports. It has also managed to maintain low debt to GDP ratio (Table 5), high rates of savings and investments (Tables 6 and 7) and continued to increase gross capital formation (Table 9).
The rest of the paper will analyze the East Asian crisis in greater details to understand what exactly has caused the East Asian economies to enter the recession and how China managed to stay resilient.
4 Frame of Reference
The ultimate goal of the asset markets as well as of the financial, monetary and banking systems, is to increase the efficiency of real activity and resource allocation and thus to boost the country’s economy. The disruptions in these systems generally have a nega-tive impact on the economy and are broadly referred to as financial or economic crises. Such crises can originate in the government, financial institutions or in the financial markets. Goldstein and Razin (2012) conduct an extensive review, summarizing and an-alyzing literature on the topic of financial crises developed over the past thirty years. They classify the various types of financial crises and respectively categorize the litera-ture into three categories: banking crises and panics; credit frictions and market freezes; and currency crises.
In the following sections a closer look will be taken into currency and banking crises. Firstly the two branches of literature dedicated to the topic of currency crises are dis-cussed – namely the first- and second generations of models. After, causes and implica-tions of a banking crisis are presented. Finally introducing a relatively new branch of literature that was developed following the events of East Asian crisis – the third gener-ation of models concludes the chapter3.
4.1 Currency Crises
Currency crises are generally characterized in the literature as a speculative attack on the foreign exchange value of a country’s currency. A government, with the goal of keeping the economy stable, maintains certain financial and monetary regulations, most commonly a fixed exchange-rate regime. In particular circumstances these regulations become unsustainable, putting the country’s central bank under pressure to abandon the exchange rate peg of the local currency. This usually results in dramatic change in the value of the currency over very short period of time. Such rapid changes often pose se-vere implications for the economy, resulting in decreased output, possible inflation, and a disruption in both domestic and foreign financial markets.
While the effects and the causes of any particular currency crisis may differ from one country to another, a high level of pressure on the exchange market caused by
tive attacks is something they all share. Speculative attacks occur because investors may anticipate certain fluctuations in a currency’s exchange rate – most commonly a fear of sharp decrease in the value of a currency. This anticipation causes large outflows of funds from the local currency, usually on top of the existing balance of payment deficit. Given such pressure on the exchange market, keeping the currency from devaluating becomes challenging and costly for the central banks. Keeping the currency at a stable level may, among other things, imply: draining the government’s foreign reserves, bor-rowing from abroad, increasing the interest rates or imposing capital controls in order to limit the outflows.
Over- or undervaluation of the local currency, which is often the outcome of inconsist-encies between the domestic exchange rate and economic policies are the fundamental causes of currency crises. Therefore countries with floating exchange rates are, in theo-ry, more resilient to currency crises, as ongoing adjustments of the market economy limit the possibility of extreme fluctuation in the value of a currency. On the other hand, countries that adopt a pegged or intermediate exchange rate regimes are less resistant to currency crises and are in most cases forced to abandon the peg upon experiencing such a crisis.
While most of the currency crises are associated with downward pressure on the local currency (i.e. investors fearing that the currency will depreciate), appreciation of the currency may also be anticipated, putting an upward pressure on the local currency. This case is most notable for China, where there is an ongoing debate on whether the currency is under- or overvalued as compared to what its value would be in the case of floating exchange rate regime. The debate is summarized in Yang, J., Yin, H., He, H. (2007) and will not be further addressed in this paper.
The currency (or balance of payment) crises taking place around the globe over the dec-ades following the collapse of the Bretton Woods system have encouraged a huge amount of academic research on the topic. The desire to explain the causes of currency crises, as well as the need to detect and prevent the crises from happening in the future, have generated three branches of theoretical models, each of which focuses on specific aspects that cause a currency crisis. These models will be discussed in the following sections.
4.2 Trilemma in International Finance
In their reviews of theories on currency crises, Glick and Hutchison (2011) and Gold-stein and Razin (2012) advise to consider the basic trilemma in international finance (al-so referred to as impossible trinity or unholy trinity) to better understand the origins of a currency crisis. This trilemma occurs in the context of international finance as most countries aim to accomplish the following three goals simultaneously:
i. In order to benefit from the skills and know-hows brought into the country by for-eign investors as well as to allow domestic investors to diversify their portfolios abroad, the policy makers would like to have the economy open to international trade and capital flows, increasing global financial interaction and capital mobility over time.
ii. To be able to stabilize the financial sector of the economy as well as some of the fundamental economic variables such as inflation and output, an independent mone-tary policy and full control over domestic interest rates is the second goal for policy makers. When this is the case, the central bank can either increase or decrease the money supply and respectively reduce or raise the interest rates when the economy is either in a recession or overheated.
iii. Finally, the policy makers want to preserve the exchange rate at a stable level by the means of fixed or managed exchange rate regime. Volatilities in the exchange rate may lead to broader financial volatility and substantially damage the trade prospects for domestic businesses as well as cause uncertainty for the investors.
The impossible trinity implies that a country is only able to achieve two out of the three goals listed above. The constraints imposed by this trilemma have been put to test by a number of countries resulting in some of the world’s most severe currency crises.
When a country wishes to maintain capital mobility and the exchange rate is pegged to another country’s currency, the domestic interest rates become linked to those abroad based on the interest rate parity principle. This severely limits the central bank’s flexi-bility to pursue an independent monetary policy, as the money supply is now automati-cally adjusted to the domestic interest rates. If the central bank would, for example, try to raise the domestic interest rates above those abroad by the means of contractionary
monetary policy, capital inflow would be encouraged in response, which would in turn reduce the initial rise in the domestic interest rate (Glick and Hutchison, 2011).
The above scenario was the case for individual members of the EMU, which were hit by speculative attacks during 1992-1993, as Germany was fighting the inflation by the means of raising domestic interest rates. As a result, other EMU members who had their currencies pegged to the Deutschmark also experienced an increase in their domestic in-terest rates. Large speculative flows of capital started taking place and some countries were forced to leave the EMU and depreciate their currencies as a consequence (Glick and Hutchison, 2011).
The conclusion is that for the central bank to maintain control over the domestic interest rate and/or monetary policies while having open capital flows, the exchange rate needs to float freely, as is the case in the United States. Alternatively, if the government pri-oritizes to keep the exchange rate under control while being able to have an independent monetary policy, capital control needs to be imposed, as is the case in China (Goldstein and Razin, 2012).
4.3 First Generation Models on Currency Crises
The collapse of the Bretton Woods, the global system of fixed exchange rates, in the 1970s has encouraged academics to design a branch of models to explain the events that took place. These works are now referred to as the first generation of models on
curren-cy crises.
The first work regarding this topic dates back to Krugman (1979)4, who described a
sit-uation in which a government attempts to maintain a fixed exchange rate regime but is also a subject to increasing current account and fiscal deficits. To finance the imbalance, the government will need to continuously spend their foreign reserves or borrow from abroad. This is something the government cannot do indefinitely and therefore an attack on a fixed exchange rate regime, according to the model, is inevitable.
Speculators will attempt to profit once they realize that the central bank may run out of the reserves and not be able to maintain the exchange rate. Investors, on the other hand, fearing the increased likelihood of domestic currency devaluation due to increasing
icit, will change their portfolio by rapidly selling domestic assets. Foreign reserves of the central bank will continue depleting until they reach a critical point where the peg is no longer sustainable, resulting in the collapse of the fixed exchange rates regime and sudden devaluation of the domestic currency.
The model was later extended and elaborated on by Flood and Garber (1984). Accord-ing to the model, a fixed exchange rate regime is inconsistent with the capital mobility and fiscal imbalances because central bank’s domestic assets will continue to grow, but the total assets must stay at a constant level, since the domestic interest rate is deter-mined by the foreign interest rate based on interest rate parity.
The need to finance the fiscal deficit requires domestic interest rates to decrease, which in turn requires the exchange rate to increase. The only solution for the central bank to avoid the latter is to intervene into the market and reduce their foreign assets, so that the decrease in foreign assets evens out the increase in domestic assets. As the foreign re-serves disposable to the central bank have a limit, this process cannot continue indefi-nitely. Referring to the trilemma described in the previous section, given free capital mobility, the central bank will eventually be forced to abandon the peg and allow for free exchange rate fluctuation.
4.4 Second Generation Models on Currency Crises
First generation models, with the assumption of essential inconsistency between various government policies, became challenged during the 1990s, following the EMU crisis of 1992-1993 and the Latin American crisis of 1994-1995. The EMU crisis, according to Rose and Svensson (1994) came as a surprise – given the absence of significant changes in the fundamental variables, the first generation models were unable to explain why in-vestors changed their expectations regarding the exchange rate peg so drastically and thus a new branch of models to explain the crises were needed.
One of the problems with the framework of the first generation models was the difficul-ty to reason why the government would try to maintain the exchange rate peg and, sim-ultaneously, conduct a policy that will eventually cause a currency crisis. As a result,
the second generation of models on currency crises were initiated by Obstfeld (1994,
1996) and later developed by Rangvid (2001). These models present a new way to ana-lyze the government’s behavior in the period leading up to a currency crisis and
high-light the lack of strong correlation between fundamental economic variables and the be-havior of the agents. The models assume that at every single period of time, the gov-ernment will analyze the costs and benefits of maintaining the peg and may adjust the policies in response to the attack or may choose to abandon the exchange rate regime if the costs of keeping it exceed the benefits. Additionally, these models assume multiple equilibria5 for the rate of currency devaluation, where expectations of the private inves-tors are self-fulfilling. The government will be forced to conduct a policy that is ex-pected by the agents.
A dilemma for the government exists, as the policy designed to defend a given ex-change rate level comes with the cost of defense. Referring to the previously discussed trilemma, due to a fixed exchange rate regime, the government will not be able to use monetary policy. In this generation of models, doubts from the agents in regards to whether the government will maintain the peg or not lead to speculative currency at-tacks, which may succeed even when the government’s current policy does not remain inconsistent with the exchange rate commitment (as was the case in the first generation of models).
4.5 Banking Crises and Third Generation Models
In general, banks rely on short-term deposits by private investors to finance their long-term debt. While being a fundamental element for economic growth as well as improv-ing the welfare of the population, this scheme relies on the assumption that only a frac-tion of the investors will need to redeem their savings in the short-term. The scheme be-comes unsustainable once a large number of private investors (significantly more than the fraction initially forecasted by the bank) redeem their deposits within a short period of time. Such a situation is referred to as bank runs and forces the banks to release their long-term investments at a loss. Such unpredicted behavior on a large enough scale will ultimately cause the bank to collapse.
Diamond and Dybvig (1983) were first to investigate this phenomenon and to provide a framework for its analysis. According to the framework, bank runs happen in equilibri-um, as it is indeed considered rational behavior for investors to withdraw deposits from
cur-the banks once cur-there is a common belief that cur-the bank will collapse. The fundamental problem here, as discussed in Goldstein and Razin (2012), is the failure of coordination: the more investors that withdraw their deposits from a bank – the more of an incentive there is for other investors to withdraw their money and thus the more likely a bank is to fail. This behavior quickly creates a panic and rapidly spreads from one bank to another, as more and more depositors feel the need to withdraw their funds – not because they need them, but because they fear a possible collapse of their bank. As a result many banks fail at the same time and such systemic collapse negatively affects other parts of the economy.
The East Asian crisis of 1997 could not be explained by the first, or by the second gen-erations of models. The crisis has led the affected countries into abandoning the ex-change rate peg, but also substantially damaged financial and banking institutions. This has inspired a new generation of research on the interplay between a currency crises and distortions in the financial and banking systems (often referred to in the literature as the
twin crises)
Krugman (1999) presented the first literature regarding this new generation of crises, where he talks about currency mismatch between the assets (denominated in domestic goods) and liabilities (denominated in foreign goods) of domestic firms. Depreciation of the real exchange rate therefore directly damages the firms’ balance sheet, resulting in reduced borrowing and ultimately reduced domestic investment. Decreased investment in the domestic market implies a decrease in demand for local goods in comparison to foreign, which in turn leads to real depreciation.
The models were later extended and developed by various academics. Different models present different mechanisms on how the currency crisis and distortions in the financial and banking systems are connected, making it hard to generalize the description of the third generation models as a whole. One of the main features of this generation of mod-els is the relation between banking and currency crises. A banking crisis substantially reduces the amount of the reserves in the governments’ disposal, encouraging specula-tive attacks on the currency, which may in turn lead to a currency crisis. In the follow-ing section, a qualitative comparative analysis is conducted of the major studies that fall under this generation of models.
5 Literature Review on Asian Currency Crises
As there has been a substantial amount of analysis of the causes of the East Asian Cri-sis, there are several academics that have produced theories regarding what the main in-dicators causing this crisis were. These twin crises were new and did not solely rely on the first and second-generation models on currency crises and were unlike any crisis in the two decades that preceded it. Those with greater significance are focused upon more, as they are linked to China in the following section.
5.1 Causes
This subsection gives a brief outline of what academics argued were the root causes to the East Asian crisis. The next subsection gives a detailed overview of researchers’ find-ings regarding the causes and is titled according to the authors’ names.
5.1.1 Moral Hazard
Krugman (1998) blames moral hazard being the root of the problem where financial in-termediaries were handling risky lending practices. Corsetti et al. (1999) outline this moral hazard: national banks were borrowing excessively from abroad and funding un-reasonable projects that were not socially profitable in the Asian countries. This would have been a minor problem yet capital account liberalization and financial deregulation increased the size of investments and severely worsened the problem. The issue of mor-al hazard is described as the banks ignoring the danger of unprofitability and not in-creasing caution in their lending practices.
5.1.2 Short-Term Foreign Debt and Improper Policy Sequencing
Radelet and Sachs (1998) argue that capital inflows and international lending in huge quantities followed by large capital outflows were main causes. They run a lagged pro-bit regression where the dependent variable is a dummy recording the onset of financial crisis when equal to 1. Several explanatory variables are used in the model: Short-term foreign debt/reserves; Total foreign debt/reserves; Level of corruption and Change in the real exchange rate. The most significant indicator they found in increasing the oc-currence of a crisis is a greater amount of short-term foreign debt in comparison to for-eign reserves.
change rate policies, poor regulation on financial markets, unprofitable investments, growing current account deficits and insufficient corporate governance. Given this combination of problems together magnified by the deregulation and liberalization of financial markets, a crisis was inevitable according to the authors. Furman and Stiglitz (1998) primarily outline 3 hypotheses that could explain the root of the crisis: (1) A lib-eralization of capital flows coupled with foreign investment in high-risk domestic secu-rities caused significant instability in the East Asian economies who were not keeping with external developments in foreign economies; (2) As the Asian economies grew significantly over the years and became more multifaceted, the previous policies ac-counting for risk became irrelevant and did not account for many of the new potential risks; (3) Improper sequencing of relevant financial reforms simultaneously with rapid financial liberalization in the economies led to severe vulnerability in the economies.
5.2 Econometric Studies
As the East Asian crisis was a unique case their paper does extensive research on the crisis and different econometric models introduced by previous authors to explain the causes. The models have been updated with new explanatory variables in order to have a better fit with their new data. The effectiveness of the models and the indicators that were most recurring in the models will be detailed and later applied to the case of Chi-na. Furman & Stiglitz list and analyze the three most significant models in determining currency crises by the authors: Frankel & Rose; Kaminsky, Lizondo & Reinhart; Sachs, Tornell & Velasco. These three are further explained in this section and the significant economic indicators listed are outlined in the Analysis section together with China’s da-ta regarding each respective indicator. Since East Asia experienced a simulda-taneous banking crisis, Furman and Stiglitz also outline the most accurate and complete model for this type of crisis by Demirgüç-Kunt and Detragiache that was introduced before the crisis.
5.2.1 Frankel and Rose (1996)
Frankel & Rose (hereafter FR) estimated a probit model with pooled data in order to de-termine which economic indicators are crucial in increasing the probability of a crisis. This model seeks to predict the probability of a currency crisis when using a function of macroeconomic and financial variables. A large amount of independent variables are used whereas the most significant in the root of crises are: Low share of FDI as a
frac-tion of total stock of external debt, reserve/import ratio and GDP growth; High domestic credit growth and foreign interest rates. Little evidence for significance is found for the indicator variables: Short-term debt; Overall Debt; Government Budget Deficit and an Overvalued Exchange Rate relative to its average level6. Bustelo (1998) finds the over-valued exchange rate to be an insignificant variable to focus on as only Thailand and the Philippines had severe exchange rate overvaluation and South Korea, Malaysia and In-donesia did not; therefore it is excluded from the analysis. Furthermore, Berg and Pat-tillo list factors they found to have no effect on the likelihood of a crisis: re-serves/imports ratio; and change in the terms of trade. FR found an increase the follow-ing indicators to be beneficial in preventfollow-ing the likelihood of a crisis: Foreign direct in-vestment, multilateral debt and Per-capita income growth. These variables are signifi-cant at the 10% level.
5.2.2 Kaminsky, Lizondo and Reinhart (1998)
Through their research, Kaminsky, Lizondo & Reinhart (Hereafter KLR) outlined a predictor model using 15 indicators that can be linked to the root causes of a currency crisis (which KLR defined as a speculative attack, successful or unsuccessful). Furman & Stiglitz (1998) evaluate the KLR model and defined the indicators similar to the orig-inal authors aside from the real exchange rate (real appreciation). Their updated KLR model calculates a monthly crisis index as the weighted sum of the change in reserves and the nominal exchange rate, pegged to the USD. The inverted variance of the varia-bles from the period of 1997-98 plays the role of the weights. KLR define crisis as when the country specific index increases by an amount greater than three standard deviations from its mean; a crisis in any month of a specific year would be generally classified as a crisis occurring in that year.
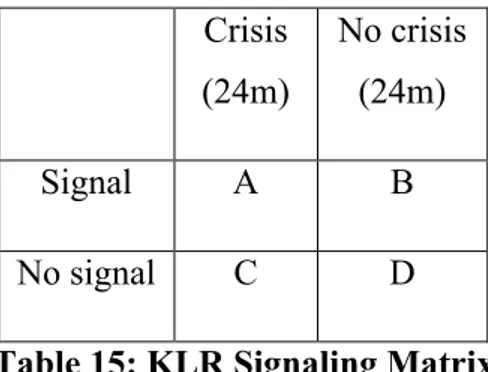
The model used a specific threshold for each indicator; this method used by KLR is also referred to as the signaling approach. The authors explained the method in a simpler way, observed in Table 15, by using a matrix with four classifications of events. Firstly, it is important to note that there is a specific threshold for each indicator out of the 15 chosen by KLR; second, a signal is issued when an indicator deviates from its mean
6 When assessing the FR model, Berg and Pattillo (1998) note the relationship between exchange rate
percent-value and past the given threshold, which is a specific percentile level; third, there is a window of 24 months prior to crisis to look at for this model meaning that if a signal re-sults in a crisis within that timeframe, it is a good signal. On the contrary, without a cri-sis occurring it would be considered bad or noise. In the matrix, A and B represent a signal issued by the indicator that was either good (A) or bad (B, also referred to as noise), C and D represent the number of months where the indicator did not issue a sig-nal, which would have been either good (C) or bad (D).
Crisis (24m) No crisis (24m) Signal A B No signal C D
Table 15: KLR Signaling Matrix
The goal of this table is to calculate a specific threshold for every indicator, the optimal threshold being the one that minimizes the “noise-to-signal ratio” (B:A). Minimizing the noise-to-signal ratio allows finding an optimal threshold that will not set off false signals and nor fail to alert good signals. To explain this process the model has 15 indi-cator variables that are measured on a monthly basis with a space of 24 months leading up to a crisis. These indicators range from various macroeconomic variables e.g. domes-tic credit to GDP ratios of the country, to money supply, to inflation among others. Eve-ry indicator has a distinct threshold level given as a percentage. When an indicator, for example, exceeds its threshold of 90% and is at its highest 10% level, a warning signal is sent out as there is a case of over-appreciation.
When using the KLR model the warning indicators found relevant to the East Asian Crisis were: Real appreciation of the exchange rate; Rapid domestic credit growth; Fall-ing stock markets and slowFall-ing export growth rates; RisFall-ing M2 multipliers, terms of trade and real interest rates (Kaminsky, Lizondo and Reinhart, 1998, Furman and Stiglitz, 1998). The majority of these indicators (excluding rising terms of trade, and decreasing stock markets and export growth rates) were all considered alarming com-pared to historical values of the East Asian economies but Furman & Stiglitz claim they were less alarming relative to other developing countries.
The signaling method does however have some pitfalls: it uses isolated indicators set at their optimal specific thresholds it does not manage to catch warnings of interrelated in-dicators that could, when combined, perhaps increase the probability of a currency cri-sis; on the other hand the percentile threshold can be inaccurate for warning of a poten-tial crisis as it uses a specific threshold for each indicator but not for specific countries. Berg and Pattillo (1999) list explanatory variables that are lacking in the model as: Cur-rent account deficit to GDP ratio and M2/Reserves (KLR model only deals with the growth in this ratio but not the absolute level); after testing the model with these addi-tions, Berg and Pattillo notice significantly better performance out-of-sample.
5.2.3 Sachs, Tornell and Velasco (1996)
Sachs, Tornell & Velasco (hereafter STV) outlined their model regarding currency crisis in 1994 specific to the Mexican Tequila Crisis. This model describes the severity of a crisis rather than the possibility of a crisis occurring. The two key-variables used are: Fundamentals, which uses the ratio of private sector credit growth to GDP as a proxy for weaknesses in the banking sector and also real exchange rate appreciation; Reserve adequacy, which uses the ratio of M2/reserves as a proxy to define adequate reserves. The model describes a more severe crisis as being dependent on an inadequate amount of reserves and weak fundamentals. The STV model in contrast to the other models listed received an R2 value of 0.69, thus STV concludes it is good at explaining the pat-tern of contagion for crises. This is a very broad definition and the reason for this is in order to show the relationship between these two indicators and how incentives develop for speculators to attack a country.
Furman & Stiglitz (1998) described the STV model and extend it in order to take a larg-er sample of countries and change the timing of the variables. The independent variables they use are: Lending Boom (LB), private sector credit growth between 1992-96; Real Appreciation (RER), a multilateral trade-weighted exchange rate index that uses 1988-92 as the base period and an average between the years 1996-1997 in order to evade re-percussions from the tequila crisis; the aforementioned Reserve adequacy; Crisis index, weighted average % change between exchange rate and reserves from ’96-97 where the weights are country specific; Dummy variable entitled DWF for weak fundamentals showing 1 when a country has a real depreciation greater than 16% or greater than 7%
displaying 1 if the M2/reserves ratio exceeds 2.1. The most significant indicator varia-bles in this model for increasing the probability of a currency crisis were found to be: lending booms; overvalued exchange rates; and high ratios of M2 to reserves.
5.2.4 Demirgüç-Kunt and Detragiache (1998)
Demirgüç-Kunt and Detragiache introduced a predictive model for banking crises that uses a similar approach as Frankel and Rose, a logit model to estimate a limited de-pendent variable framework. They estimated the probability of a banking crisis with a set of pooled data as a function of standard macroeconomic and financial variables as well as an index measuring the quality of law enforcement (Furman and Stiglitz, 1998). Their major findings are that the indicators increasing the probability of banking crises are: Low GDP growth; High inflation and real interest rates; vulnerability to capital out-flows; domestic financial liberalization and ineffective law enforcement. From these, the ones that were prominent in the East Asian crisis were high real interest rates, vul-nerability to capital outflows and domestic financial liberalization.
5.3 Conclusions of the Models
The conclusions drawn by Furman and Stiglitz (1998) as well as Berg and Pattillo (1999) show that the KLR model slightly outperforms the other models in its predictive features for currency crises. Due to the slight success of this model, practitioners on other crises have adapted it as it uses a leading indicators approach, which had a surge in interest after KLR. Berg and Pattillo explain that it is hard to compare the three mod-els due to the fact that they all have different dependent variables and sample thus the R2 value is irrelevant to evaluate between the models. The models deal with different definitions of crisis as STV only measures severity of crisis, but the two most in sync are FR and KLR. Bustelo (1998) summarizes the viewpoints of the aforementioned au-thors and concludes the main factors that influenced the East Asian Crisis to have been: overinvestment; improper sequencing of macroeconomic policies together with capital and financial liberalization; and the buildup of short-term foreign debt.
The ratio between short-term debt and reserves appears to be a prominent indicator in terms of increasing the probability of currency crisis. It is not an alarming indicator when the amount of reserves increases at an equal or greater rate than short-term debt to offset as developing countries borrowing from banks of industrial countries at
high-interest rates and lending to developing countries at lower high-interest rates creates a nega-tive spread and increases risk. Including this indicators, other indicators that have been found in this section to be increasing the probability of a crisis that are further examined for the case of China are: FDI/Total Debt (low); GDP growth (low); Domestic credit growth (high/rapid); Real interest rates (rising); and Financial and capital account liber-alization.
It is important to note that the models described above do not predict crisis with certain-ty because if they would be able to predict a significant devaluation in the currency it would give speculators a great opportunity for profit thus bringing on the crisis earlier; therefore the prediction models or early warning systems (EWS) exist to alert a case of vulnerability in the economy.
6 Analysis
This section is dedicated to analyzing the most important indicators listed from previous authors that are known to increase the probability of currency crises, specifically that encountered in East Asia during the late 1990s. Furthermore, the goal of this section will also be to try to answer the question: How did China manage to stay resilient to this crisis? Primarily the most significant indicators discovered from the Literature Review will be listed and analyzed for the case of China.
6.1 Indicators
To summarize the literature review’s conclusions, the indicators that will examined are: Foreign Direct Investment, both the ratio between FDI and Total debt as well as net in-flows in FDI; Growth in GDP; Short-term debt as a percentage of foreign reserves; Fi-nancial and Capital Account Liberalization; Domestic Credit; and Real Interest Rates. These indicators have been found to increase the probability of crisis dependent upon their level or rate of growth and will therefore be reviewed by using data from the World Bank among other sources for the crisis companies and these values will be compared with China during the time in order to draw conclusions as to how China re-mained resilient during the East Asian Crisis. As a reference, Table 16 shows a proper outline of the further evaluated indicators.
Table 16: Significant Indicators Increasing the Probability of Crisis
Frankel & Rose
Low: FDI/Total Debt; GDP Growth High: Short-‐term Debt/ Reserves Domestic Credit Growth
Kaminsky, Lizondo & Reinhart Rapid: Domestic Credit Growth Rising:
Real Interest Rates
Sachs, Tornell & Velasco
Financial & Capital Account Liberalization
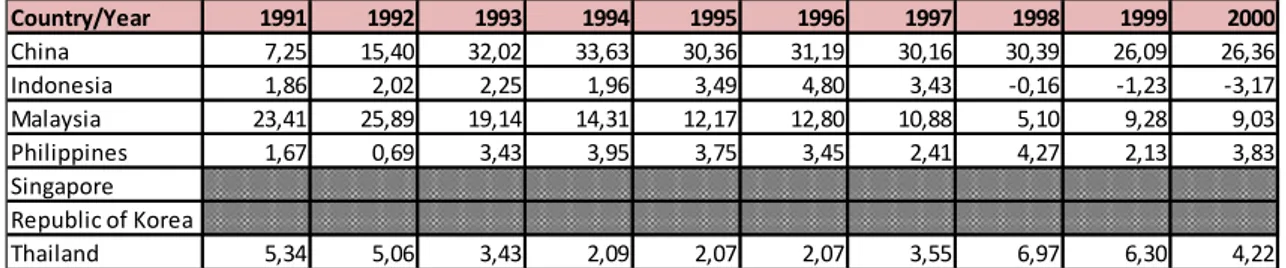
6.2 Foreign Direct Investment (FDI)
The first indicator to review is FDI as a percentage of Total Debt. Looking at Table it is observable that China’s foreign direct investment ratio of their total debt ranges be-tween 30-33.6% of Total Debt bebe-tween the years 1993-1998. Frankel and Rose (1998) concludes this ratio as increasing the probability of a crisis when it is low and it is clear this was not the case of China as the ratio is in fact very high relative to the crisis coun-tries. Within the same interval the East Asian crisis countries have substantially low ra-tios in comparison to China. Malaysia is the only one that has a ratio of greater than 10% between these years. Increasing FDI is also found to be a variable that decreases the probability of a crisis; this can be observed in Table 8 of the Appendix where China had somewhat of a boom in foreign direct investment net inflows surging from 4.37 to 27.52 Billion current USD from 1991 to 1993 and maintaining a stable increase during the time of the crisis. Comparing the net FDI inflows of China with the crisis countries during the interval 1991-00, it can be seen that there is a considerable difference be-tween China and the Asian crisis countries regarding FDI. The only crisis country that exceeds 10 billion current USD is Singapore and the inflows of FDI of the other coun-tries are either decreasing or remaining constant at low values.
6.3 GDP Growth
Frankel and Rose (1998) list low GDP growth as an indicator that increases the proba-bility of a crisis. Evaluating Table 1 of the Appendix, it is noticeable that all countries’ (aside from Singapore) GDP percentage growth rates were less in 1997 than in 1996 and all crisis countries shot into a negative growth rate in 1998 post-crisis. When evalu-ating this data we can see that Thailand was the only country in 1997 that had a negative percentage GDP growth rate (-1.37) and this can be explained as Thailand having been at the heart of the storm in the East Asian crisis and contagion broke out in the other
Table 11: FDI (% of Total Debt)
Country/Year 1991 1992 1993 1994 1995 1996 1997 1998 1999 2000 China 7,25 15,40 32,02 33,63 30,36 31,19 30,16 30,39 26,09 26,36 Indonesia 1,86 2,02 2,25 1,96 3,49 4,80 3,43 -‐0,16 -‐1,23 -‐3,17 Malaysia 23,41 25,89 19,14 14,31 12,17 12,80 10,88 5,10 9,28 9,03 Philippines 1,67 0,69 3,43 3,95 3,75 3,45 2,41 4,27 2,13 3,83 Singapore Republic of Korea
Thailand 5,34 5,06 3,43 2,09 2,07 2,07 3,55 6,97 6,30 4,22
Asian economies listed shortly after. China however maintains a constant GDP growth rate during the time of crisis and post-crisis. Evaluating the GDP per capita growth rates there is an identical pattern but with even lower percentage values due to simultaneous high population growth. This variable is very important to note that China managed to maintain high GDP growth rates between 7.5-10% from before and after the East Asian crisis.
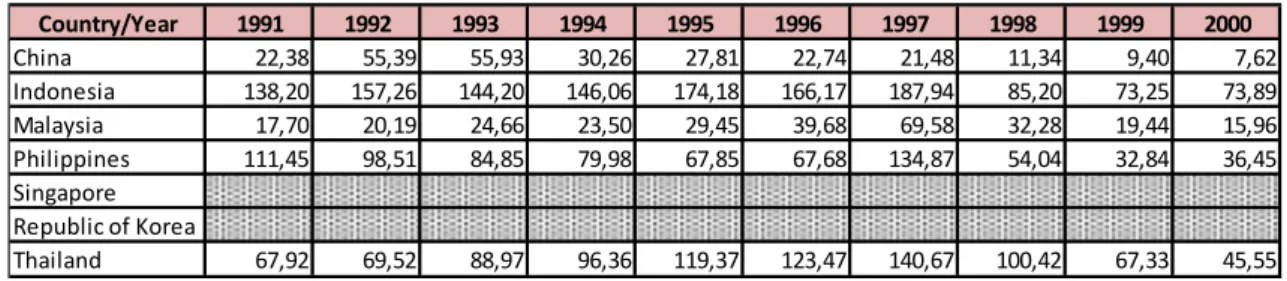
6.4 Short-term Debt (% of Reserves)
A recurring indicator from the authors dealing with the East Asian Crisis is the ratio of short-term debt to the foreign reserves (Radelet and Sachs, 1998; Frankel and Rose, 1998; and Bustelo, 1998). This ratio may have a negative impact if it gets too high be-cause the amount of foreign reserves should offset the amount of short-term debt and at the most be equal to the amount of reserves, otherwise the country will have troubles defending their currency peg when speculators attack.
Table 13 lists this ratio for the crisis countries and also China; the countries with a greater amount of short-term debt are: Indonesia, Philippines and Thailand. As China started accumulating reserves and is today the largest holder of US denominated For-eign reserves, it of course has a small ratio that is actually decreasing over the years. Although Malaysia did not have a greater ratio of short-term debt it is still greater than China’s level and since this crisis was intricate and unique to its kind there are many different variables that affected the countries that experienced this crisis.
6.5 Financial and Capital Account Liberalization
Bustelo (1998) evaluates the aforementioned indicators that were listed as significant by STV and retain the sole indicator of Lending Booms (LB). This variable will be out-lined briefly as it does not have data to back it up, but it should however be mentioned
Table 13: Short-‐term debt (% of reserves)
Country/Year 1991 1992 1993 1994 1995 1996 1997 1998 1999 2000 China 22,38 55,39 55,93 30,26 27,81 22,74 21,48 11,34 9,40 7,62 Indonesia 138,20 157,26 144,20 146,06 174,18 166,17 187,94 85,20 73,25 73,89 Malaysia 17,70 20,19 24,66 23,50 29,45 39,68 69,58 32,28 19,44 15,96 Philippines 111,45 98,51 84,85 79,98 67,85 67,68 134,87 54,04 32,84 36,45 Singapore Republic of Korea
Thailand 67,92 69,52 88,97 96,36 119,37 123,47 140,67 100,42 67,33 45,55
because it is deemed relevant to have affected the vulnerability of the crisis economies and not China. The affected economies had recently undergone financial and capital ac-count liberalization and therefore had a considerable amount of capital flowing in and out of the country. Due to the fact that sound macroeconomic and financial policy se-quencing was not accompanied with this opening of the capital account there was a large weakness in the East Asian economies; short-term capital was flowing in and out of the country and therefore speculators would exploit this weakness as well as inves-tors who lost confidence in their investments would withdraw them quickly creating a self-fulfilling crisis. China however was not susceptible to this danger, as it did not have similar openness in its capital account. This variable was a large cause of the East Asian crisis when accompanied by poor banking regulations, borrowing from foreign coun-tries and lending to risky investments that were not seen profitable.
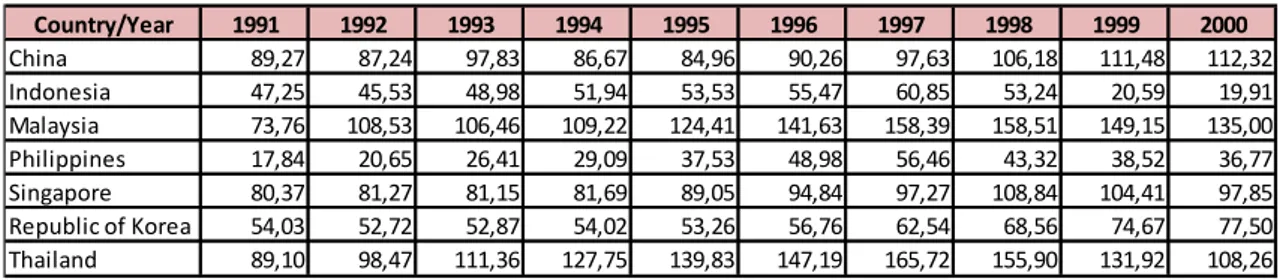
6.6 Domestic Credit
Bustelo (1998) relates this variable as misguided macro-management; Frankel and Rose (1998) and Kaminsky, Lizondo and Reinhart (1998) list this variable as increasing the probability of a crisis when there is a high and or rapid growth. The growth in Domestic Credit can lead to overheated economies implying current account deficits, asset infla-tions and large capital inflows. The data in Table 16 lists the annual amount of Domes-tic Credit as a percentage of GDP; evaluating this data there is a high growth in Malay-sia, The Philippines and Thailand whose growth in Domestic Credit is respectively: 74-153%, 18-56% and 89-165% from the years 1991-1997; China’s however, during this interval, is 89-98%. The worst of these are Malaysia and Thailand who were severely affected by the crisis. This increase in domestic credit is of course worrisome due to the effects mentioned yet when this sharp increase is coupled with capital liberalization with improper policy sequencing, the danger expanded for the East Asian crisis coun-tries.
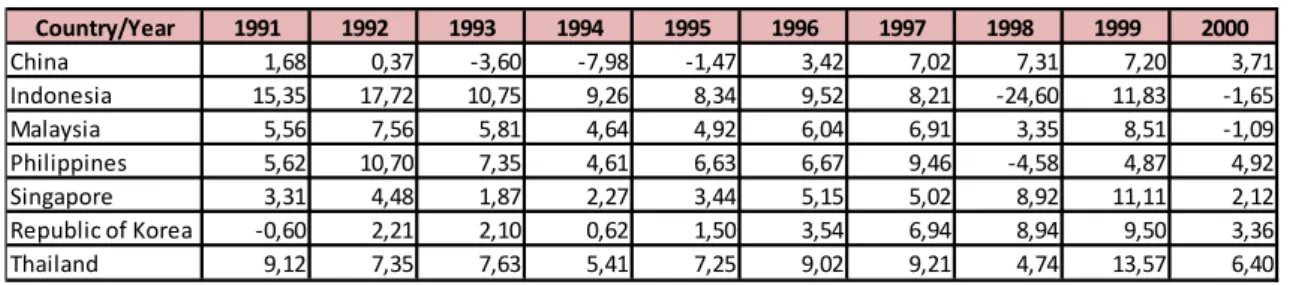
6.7 Real Interest Rates
Kaminsky, Lizondo and Reinhart (1998) list rising real interest rates as an indicator that increases the probability of a crisis occurring; the real interest rate is the interest rate ad-justed for inflation. When the real interest rate increases so does the inflation in the economy and as earlier mentioned within a fixed exchange rate regime, the domestic terest rate must decrease in order to finance the fiscal deficit. An increase in the real in-terest rate will cause a shift from consumption to saving in the domestic country, as it will in turn, be more expensive to borrow money. Investments from foreign countries with low real interest rates will be shifted towards a domestic country that has higher real interest rates for the goal of speculative attacks on the exchange rate. Due to this speculative attack, the risk of a currency crisis is right around the corner and the country in question must deplete their foreign reserves in order to maintain the value of their currency from depreciating. Table 12 shows the real interest rate percentage level of the crisis countries as well as China: China is clearly seen as possessing a significantly low real interest rate leading up to the crisis, although we see China’s real rate of interest al-so increases by a quite significant amount. Due to the previously mentioned closed capi-tal account of the China’s economy, China is quite impervious to this increase in their real interest rate. The two countries with significant increases in their real interest rates are Indonesia and Thailand to a quite high level of about 9-9.5% in 1996.
Table 14: Domestic Credit (% of GDP)
Country/Year 1991 1992 1993 1994 1995 1996 1997 1998 1999 2000 China 89,27 87,24 97,83 86,67 84,96 90,26 97,63 106,18 111,48 112,32 Indonesia 47,25 45,53 48,98 51,94 53,53 55,47 60,85 53,24 20,59 19,91 Malaysia 73,76 108,53 106,46 109,22 124,41 141,63 158,39 158,51 149,15 135,00 Philippines 17,84 20,65 26,41 29,09 37,53 48,98 56,46 43,32 38,52 36,77 Singapore 80,37 81,27 81,15 81,69 89,05 94,84 97,27 108,84 104,41 97,85
Republic of Korea 54,03 52,72 52,87 54,02 53,26 56,76 62,54 68,56 74,67 77,50
Thailand 89,10 98,47 111,36 127,75 139,83 147,19 165,72 155,90 131,92 108,26
Table 12: Real Interest Rate (%) Country/Year 1991 1992 1993 1994 1995 1996 1997 1998 1999 2000 China 1,68 0,37 -‐3,60 -‐7,98 -‐1,47 3,42 7,02 7,31 7,20 3,71 Indonesia 15,35 17,72 10,75 9,26 8,34 9,52 8,21 -‐24,60 11,83 -‐1,65 Malaysia 5,56 7,56 5,81 4,64 4,92 6,04 6,91 3,35 8,51 -‐1,09 Philippines 5,62 10,70 7,35 4,61 6,63 6,67 9,46 -‐4,58 4,87 4,92 Singapore 3,31 4,48 1,87 2,27 3,44 5,15 5,02 8,92 11,11 2,12
Republic of Korea -‐0,60 2,21 2,10 0,62 1,50 3,54 6,94 8,94 9,50 3,36
Thailand 9,12 7,35 7,63 5,41 7,25 9,02 9,21 4,74 13,57 6,40
7 Conclusion
This section aims to draw conclusions regarding the detailed analysis as to which fac-tors increased the probability of the East Asian crisis occurring. As the East Asian Crisis was an intricate and unique crisis of its own kind, there were many factors that affected the outbreak. Primarily, due to the openness of the financial and capital accounts from previous years together with improper policy sequencing, the crisis was significantly magnified. The East Asian crisis countries were hit in different ways due to weaknesses in the economy, speculators took the opportunity of attacking the countries and due to the improper sequencing regarding short-term capital flows there was great danger in the economy and a crisis was somewhat inevitable. The crisis countries were affected due to the aforementioned factors: overvaluation in the exchange rate due to apprecia-tion in the real exchange rate; rapid growth in domestic credit; short-term debt exceed-ing foreign reserves; low inflows of FDI and low ratios of FDI to Total Debt; increasexceed-ing Real Interest Rates; and low GDP growth leading up to the crisis. The failure of the East Asian economies to provide proper sequencing, together with the growing complexity in the structure of the economy, caused macroeconomic imbalances that were exploita-ble weak points.
China on the other hand, managed to remain resilient during the crisis experienced by its neighbors. After analyzing China’s standpoint with respect to the aforementioned variables, there is a clear contrast between them that could be explained by various rea-sons. China was maintaining strong constant growth in GDP during the time and on-wards, it had not liberalized its financial and capital accounts and was therefore a more closed-off economy when it came to foreign investments. This factor somewhat kept China isolated from the crisis countries turmoil because China has been a very cautious country when it comes to policy sequencing and financial reforms; to this day it is still ongoing a major plan towards internationalizing the RMB as well as in the process opening its capital account and eventually moving towards a floating exchange rate re-gime. China has been collecting an adequate amount of foreign reserves, which keeps the value of their currency low giving it a great advantage in its export sector; this factor has contributed to China’s enormous growth over the past years.
8 Further Research
As the East Asian Crisis was intricate and unlike any of the previous historical crises, there are further in-depth analyses that can be conducted regarding the causes. For ex-ample, a more advanced meta-analysis using the aforementioned indicators and methods would give more accurate results into the relationship between the variables by running regressions and evaluating the data on a more specific level. We advise academics to broaden this particular research by expanding the analysis onto additional countries (e.g. Japan, Taiwan, and India) as well as additional variables (e.g. Real Exchange Rates).