On the Invariance of Size Distribution of Establishments
MASTER THESIS IN ECONOMICS Author: POLINA KAMANINA Tutor: BÖRJE JOHANSSON Jönköping MAY 2012
Abstract
The thesis examines the establishment size distribution over time and across groups of regions, using data on Swedish establishments during period 1994-2009. The size dis-tribution of establishments is highly skewed and approximates the Pareto disdis-tribution. The shape of size distribution is invariant over time and across groups of regions. The distribution of total number of establishments and incumbent distribution are found to rise from the same distribution. Moreover, the invariance of establishment size distribu-tion is highly determined by the invariance of distribudistribu-tion of incumbents, entry and exit distributions. Larger establishments have more chances to survive and higher probabil-ity to remain in current size group comparing to smaller ones, whereas higher probabili-ties of growth would be attached to smaller establishments.
Key words: establishment size distribution, invariance, Pareto distribution, regional structure
Table of Contents
1. INTRODUCTION ... 1
2. THEORETICAL AND EMPIRICAL BACKGROUND ... 3
2.1 The size distribution of firms and establishments ... 3
2.2 Structural change ... 5
2.3 Entry and exit ... 7
3. DATA AND STATISTICAL METHOD ... 9
4. EMPIRICAL ANALYSIS AND RESULTS ... 13
4.1 Descriptive statistics ... 13
4.2 Comparison of distributions ... 16
4.2.1 Comparison of distributions within the group of regions ... 16
4.2.2 Comparison across groups of regions ... 18
4.4 Investigating the shape of establishment size distribution ... 18
4.5 Discussion ... 20
5. CONCLUSION ... 22
References ... 23
APPENDCES ... 25
Appendix 1 ... 25 Appendix 2 ... 26 Appendix 3 ... 341. INTRODUCTION
According to the Laplace’s criterion of insufficient reason given the set of mutually ex-clusive and collectively exhaustive possible outcomes of the state equal probabilities are assigned to these outcomes. Following the analogous principle, in the absence of any in-formation regarding the probability distribution of a random variable, its distribution is bell-shaped. However, the distribution of firms by size is almost always found to be highly skewed,implying large amount of small firms and smaller amount of large firms. This fact attracts conciderable attention of researches attepting to explain such skew-ness.
One of the earliest research papers on market structure and firm size dynamics was pre-sented in 1931 by Robert Gibrat, who described the law of a proportional effect (also known as Gibrat’s law). The law of proportional effect states that the expected (abso-lute) change in a firm’s size is proportional to the present firm’s size (Sutton, 1997). According to Gibrat’s law proportionate growth rate is defined as a normally distributed random variable, meaning that firm’s size and growth rates are independent. Based on the analysis of French industrial firms Gibrat suggested that the consequence of the law of proportional effect was firm’s size lognormal distribution. This distribution is right-skewed with its mean value being greater than its median that, in turn, exceeds modal value (Axtell, 2001).
As argued by Ijiri and Simon (1977), the skewness of the size distribution of firms has been persistent over time and showed robustness in relation to the processes of mergers and acquisitions and political regulations. Moreover, it has been insensitive to changes in technology, changes occurring on labour market, and firms’ entry and exit process (Axtell, 2001). When considering the theoretical distribution the firm’s size follows numerous of studies proved that the lognormal, Pareto and Yule distributions approxi-mated well the observed frequency of firms of different sizes.
The thesis addresses the problem of describing the regional structure in terms of estab-lishment size distribution and its invariance over time and space. It is shown that the es-tablishment distribution by size can be approximated by Pareto distribution and displays strong invariance with regard to its form across time and regions. The current thesis aims to (i) explain how such an ivariance can be understood, (ii) what type of industry dynamics can generate the observed patterns, and (iii) if the establishment size distribu-tion is the same for different regional economies. The contribudistribu-tion of the current thesis is as follows: it uses new approach in exploring the establishment size distribution across spece and time as it examines differencies in size distribution across groups of regions that are constracted according to regions’ size.
The analysis is based on a Swedish database and performed within and across three groups of functional regions – large, medium-sized and small. The purpose of empirical analysis is to describe and compare the establishment size distribution and its dynamics over space and time. To access the purpose the following steps are performed. First, the skewness of establishment size distribution is illustrated. Second, size distributions are described in the groups of regions with regard to incumbents, establishments that stayed on the market, startups and exiting entities. Third, within each group of regions the
in-variance of size distributions over time is examined. Then the comparison of distribu-tions across the specified groups of regions is made. Finally, the test is conducted to in-vestigate the shape of distribution the establishment size follows.
The thesis is organized in the following way. Section 2 outlines the theoretical frame-work and empirical background to the study of firm and establishment size distribution. It also describes the structural change as a stochastic process, alongside with entry and exit processes. Section 3 presents data chosen for the analysis and outlines statistical method. Section 4 presents the empirical analysis of establishment size distribution over the period 1994-2009. It compares the distributions of total number of firms, stayers, entry and exit over time and across groups of regions and examines the shape of estab-lishment size distribution. Section 5 contains conclusions.
2. THEORETICAL AND EMPIRICAL BACKGROUND
2.1 The size distribution of firms and establishments
The conclusion made by Gibrat served as a basis for further modeling trying to explain the mechanism that generates the size distribution (Sutton, 1997). One group of such Gibrat’s law based models appeared during the 1950-60s. They are referred as “stochas-tic growth” models and combined the law of proportional effect with additional assump-tions (Sutton, 1997). In this group of models the analysis of firm size distribution is based on random processes, which is called to examine and explain high skewness of the size distribution. The core assumption in the stochastic models dealt with skewed distribution was the following: firm’s growth (i. e. changes in firm sizes) was described by a Markov process. It implies that the probabilities that the firm will experience a specified growth rate or decline in size are independent of the firm’s current size (Ijiri and Simon, 1964). In other words, a large and a smaller firm have the same chances of a specified change in size. That’s the simplest form of Gibrat’s law. The process de-scribed above then leads to the equilibrium size distribution (Ijiri and Simon, 1964). A well known example of stochastic growth models is the model developed by Herbert Simon and his co-authors. Ijiri and Simon (1964) in their paper argue that the independ-ence assumption in stochastic models used to describe firm size distributions made the models contradictive with empirical data. Ijiri and Simon (1964) weakened that assump-tion and developed a new model, where serial correlaassump-tion in a firm’s growth rate was al-lowed. According to the model, a stochastic growth process of an individual firm was dependent on the firm’s current size alongside with time when this firm experienced growth in the past. That means that large firms grow faster compared to smaller ones, and the firm that experienced growth more recently grows at a faster pace (Ijiri and Si-mon, 1964). Furthermore, an entry process of new firms was incorporated in the model and the probability of entry was assumed to be constant over time.
The model was argued to generate a skewed equilibrium distribution that approximates the Yule distribution. The authors of the model found it consistent with the empirical observation of serial correlation in the growth of individual firms1. Finally, they con-clude that further weakening of the law of proportionate effects will give rise to the sim-ilar (Yule-type) equilibrium distribution.
Another class of literature, “cross-sectional”, appeared during the 1950-60s focused on market structure (Sutton, 1997). The authors argued that, form one country to another, different types of industries had similar characteristics, which had an influence on the market structure. Later a game-theoretic approach was developed in this direction. As mentioned by Ijiri and Simon (1964), even though stochastic growth models fitted well, stochastic processes describe firm size distribution from the point of firms’ growth, rather than explaining the distribution using economic variables, such as prices, costs, profits. Empirical findings of 1980s encouraged the evolution of research in two directions. One was associated with such econometric problems as heteroscedasticity, censoring and defining of functional relationship. A considerable contribution in this
rection was made by David Evans (1987) and Timothy Dunne, Mark Roberts and Larry Samuelson (1989). Their papers examined the impact of a plant size and age on the pro-cess of plant’s growth by estimating the plant’s growth rate distribution conditional on survival rate (Sutton, 1997). Based on the empirical analysis common conclusions were made in both studies. First, the probability of survival of a plant is proportional to its size, whereas the growth rate of a plant is inversely proportional to its size. Second, the probability of survival was increasing in plant age, while the plant’s growth rate is de-creasing in plant age (Sutton, 1997). That is, larger plants have higher probability of survival but grow slower.
The second theme in the literature during 1980s was connected with an attempt to in-corporate stochastic growth processes into “maximizing” models. In such models firms with different characteristics made various choices in profit maximization (Sutton, 1977). Randomness was attained to firms’ differences in efficiency levels or R&D pro-jects. The examples of a “maximizing” model include Jovanovic’s (1982) “learning” model2 and models presented by Jovanovic and MacDonald (1994) and Keppler and Simons (1993)3.
Sutton (1997) in his study approximates firm size distribution by an exponential distri-bution. Employing a game theoretic approach, he finds the “lower bound to concentra-tion”, i. e. the lowest fraction of growth opportunities taken by a given number of large firms. The conclusion made from the study states that skewness of the firm size distri-bution might be explained by the fact that within an industry there exist groups of prod-ucts that do not compete with each other (Sutton, 1997). Hence, it might not be reason-able to find any “typical” form of the size distribution.
Still another class of research literature on market structure focuses on entry and exit rates that occur during the whole industry’s life (Sutton, 1997). The Ericson-Pakes model (1995) may serve as an example. Within a model entry and exit rates are regard-ed as events ocurrng in a steay state. Moreover, they are linkregard-ed to leading establish-ments’ market shares volatility in a way that new growing entrants displace exiting market leaders within the limitinig distribution, which the firms size distribution con-verges to (Sutton, 1997).
Among recent papers written covering the firm size distribution there is one written by Axtell (2001). Having analyzed the U. S. data for the period 1988-1997, Axtell (2001) came to the conclusion that firm size follows the special kind of Pareto distribution with alpha coefficient equal to unity ( ) referred to as the Zipf-distribution. The distri-bution shows strong invariance over time. The author attaches importance to firms with no or only one employee. He also argues that the shape of distribution does not depend on the way size is defined. That might be, for example, the number of employees. firms’
2 The model assumes that each firm is characterized by its level of efficiency, which the firm knows after entering the market. The growth and survival of the firm is positively related to its efficiency. Relative-ly non-efficient firms might exit the market. Having described processes of entry and exit, the author concludes dependency of firm size distribution on the firm “efficiency level” distribution (Sutton, 1997).
revenues. annual sales or total assets. However, the differences that might occur because of size definition were not of particular interest in the literature (Sutton, 1997). In an-other paper Axtell attempts to understand the firm size distribution focusing on the divi-sion of workers among firms. The author mentions that a lot of models on firm growth lack economic reasoning, and those that are not consistent with the empirical data (Ax-tell, 2006). However, he introduces a model with entry and exit defined endogenously that fits the empirical observations.
In their study Simon and Bonini (1958) point out that the distribution of plant size as well as firm size is highly skewed and can be described by the same stochastic process, irrespective of how size is defined. The current thesis examin the size distribution of estzblishments. Establishments are defined as production units, implying that a firm can be represented by one or more establishments. In this case, assuming also that larger firms are likely to have more than one eslablishment, the distribution of establishment size will appear to be less skewed comparing to the size distribution of firms. Rossi-Hansberg and Wright (2007) describe the establishment size distribution being scale de-pendent with larger establishments growing slower and having smaller net entry rates than smaller establishments. Moreover, having analyzed the U.S. data Rossi-Hansberg and Wright (2007) show that the size distributions of establishmets and enterprises (re-ferred as “employment at operations under common ownership or control”) are similar with thinner tails than in the case of Zipf distribution, implying the presence of fewer large establishments.
2.2 Structural change
As described by Ijiri and Simon (1964) stochastic growth process will lead to some equilibrium size distribution. Sutton (1997) mentions that time series models on market structure implied the convergence of the industry towards a steady state, when concen-tration ratios and firm numbers become constant.
At the regional level the analysis of industrial structure dynamics is performed by Jo-hansson and Holmberg (1982). The change in the industrial structure is examined em-ploying transition matrices that contain probabilities of transition from one state to an-other. Properties of each industrial establishment are described by a complex of varia-bles; in turn the change in those variables characterizes the structural change in the in-dustry. The authors claim that for every time the steady state solution of the transition matrix exists. Moreover, the evolution of structural change taking place during the con-cerned period of time can be examined by looking at the change of steady state solu-tions. The existence of steady-state solution of the average transition allows to access the limiting distribution of a variable.
Let be the state vector at the year that reveals the number of establishments in each size group:
[ ]
with denoting the number of establishments in group . Then can be found using the following formula:
where is the number of stayers form the previous year . and are entry and exit in year respectively. Entry in this case includes entry of new estab-lishments, entry that happens due to the process of merges and acquisitions and entry that occurs due to transitions process of establishments from one size group to another. The same applies to exit that happens due to establishments completely leaving the market, process of merges and acquisitions and transition process. It is straightforward form the above formula that the establishment size distribution is dependent on distribu-tions of stayers, entry and exit in the region.
Given the state vector representing the initial distribution , the transition process can be expressed as follows:
where is the one step probability transition matrix. Rows of describe the probabil-ity of a form to move from one size class to another. As defined by Johansson and Holmbrg (1982), represents the steady-state solution of the average matrix. The state vector in time can be found by multiplying the given initial state vector by the state solution of the average transition matrix, calculated for the concerned period, raised to the power of . In the case of a normalized steady state vector:
where [ ∑ ∑ ]
denotes the initial probability distribution at time . The limit distribution then can be found when approaches infinity : . More-over, following Johansson and Holmbrg (1982), as then , where is the maximum eigenvalue of and is the normalized left eivegvector that corre-sponds to . Furthermore, having the maximum eigenvalue positive, will show the net increase in the total number of establishments. The described transition process is assumed to be a stochastic Markov process, hence, the probability for an es-tablishment to move from one size group to another between two considered periods depends solely on the most recent establishment’s size (Marsili, 2006).
2.3 Entry and exit
The structural change process is considered to depend on the market entry and exit (Jo-hansson and Holmberg, 1982). When considering new entry, a firm enters the industry in case of high profit expectations, and with the entry barriers becoming more substan-tial the amount of entrants in the industry decreases. Exit is associated with the collapse of profit expectations (Mueller, 2003, p. 37).
Mueller discusses different hypotheses regarding the shakeout stage and survival of firms during this stage. According to “the exogenous-technological-shock” hypothesis stated by firms’ departure is determined by the failure in adopting new technology. “The dominant-design” hypothesis states that those firms stay in the industry after the shakeout whose product design appears to be more popular than others. And, finally, “the economies-of-scale-in R&D” hypothesis emphasizes the important role of lowering firm’s costs in the survival during the shakeout stage (Mueller, 2003, p.34).
Research conducted by Klepper and Simons (2000) suggests that earlier entrants have a survival advantage. In their study the author found that firms who entered the industry earlier had low hazard rates prior to shakeout and were more likely to produce innova-tions. Another group of companies that had more chances to survive was the group of largest companies as shown by Dunne et al. (1988). Moreover, even though the number of surviving firms decreases, their size grows over time, revealing the correlation be-tween firm’s age and size. Another interesting observation reported by Dunne is the strong correlation between entry and exit rates as well as between entry rates in different periods of time. The latter is common for the industries with easy entry, whereas highly correlated entry and exit rates contradict histories on product life cycle4. Partly that might be a consequence of the fact that most industries are found in their mature stage of life cycles (Mueller, 2003, p. 40). As suggested by Mueller (2003) high correlation between entry and exit rates may be explained, for example, by either displacing of in-cumbents by entrants or quick exit of newly established firms.
Explaining entry and exit, Mueller (2003) specifies the following entry equation:
where is entry in year , is profits in the industry in year and is sunk
costs and other barriers to entry. The numerous studies that estimated the profit variable found it to be often insignificant (Mueller, 2003, p. 44). However, when analyzing net entry rates, the probability for a firm to enter the industry and stay is greater for the in-dustries with higher profitability, implying the negative correlation of exit rates and profitability. Taking into account low hazard rate of new entrants, Mueller (2003) men-tions that the most important variable in explaining exit rates of current period are entry rates in the previous period.
Analyzing those finding, Mueller (2003) rejects the hypothesis of rational expectations of entrepreneurs starting new firms. He argues that entrepreneurs focus on what they
4
According to product life-cycle histories an industry will experience high entry rates and low exit rates during the early stages, and vice versa during the shakeout stage. Both entry and exit rates are expected to be low during the industry’s maturity stage.
think their competitive advantages are, rather than considering industry profitability and barriers to enter. However, those firms have more chances to survive who enter the in-dustry with low barriers to entry, high profitability and lower entry rates (Mueller, 2003, p. 44).
3. DATA AND STATISTICAL METHOD
The data for the empirical analysis is collected from Statistics Sweden5 on a yearly basis between 1994 and 2009. The data concerns the private sector is aggregated for different sizes of establishments. Establishment size is defined as the number of employees. Es-tablishments are divided into five groups according to their size (Table 1).
Table 1. Size groups of establishments.
Group number Number of employees 1st group 1-4 employees 2nd group 5-9 employees 3rd group 10-49 employees 4th group 50-249 employees 5th group 250 and more employees
For each group the data include the following information on a yearly basis between 1994 and 2009:
- number of establishments in the group by the end of the year (state vector); - number of establishments that stayed in the group during the year, with either
changed or unchanged number of employees (stayers vector);
- number of new establishments that entered the group during the year (entry); - number of closed establishments in the group during the year (exit).
The empirical analysis is made for three groups of regions – large, medium-sized and small. The first group includes the three metropolitan cities – Stockholm, Gothenburg and Malmö. Medium sized regions include those with population more than 100 000 in-habitants. The other regions with less population build up a third group. The data for all three groups of regions is aggregated. For the purpose of the analysis the whole period 1994-2009 was divided into 4 periods: period 1 1994-1997, period 2 1998-2001, period 3 2002-2005 and period 4 2006-2009. For each such period and each group of regions probability distributions of state vector, stayers, entry and exit are calculated based on average values.
The comparison of distributions was made both within and across each group of re-gions. Within each group of regions the invariance of distributions of variables men-tioned above is examined alongside with comparison of distributions of these variables between each other. The same comparison of distributions of different variables is then performed on the interregional level.
The distributions are compared employing the following techniques. First, the minimum information principle is used to discover whether the two samples are coming from the same distribution. The minimum information principle was formulated by F. Snickars and J. Weibull (1976) and based on an entropy maximization approach. The author used combinatorics tools to describe this approach. Considering the distribution of objects over boxes, the most probable distribution of , with denoting the
amount of objects in box , will be the one that maximizes the following entropy func-tion of a discrete probability distribufunc-tion (F. Snickars and J. Weibull, 1976)6:
∑
where denotes the relative shares.
Extending this approach, Snickars and J. Weibull presented the minimum information principle. According to this principle, given some assumption about distribution, the ac-tual distribution can be found by minimizing the expression:
∑
where represents the assumed distribution expressed in relative shares.
In the empirical analysis two discrete probability distributions are compared using the above formula with and denoting the relative shares of establishments belonging to size group in these two distributions, and are regarded as two probability mass functions. In this case the above formula is referred in the literature as the relative entropy or Kullback Leibler distance (Cover and Thomas, 1991, p. 18). In the cases where both and equal zero the term is assumed to be equal to zero as well. meaning that the probabilities are similar. Moreover, it is assumed that . The minimum information principle measure takes values from 0 to 1. Zero value suggests that distributions are same, while an increase in the value means the divergence of the distributions.
Another way employed to compare two distributions in the empirical analysis is a chi-square test. The test represents a common chi-chi-square goodness-of-fit test with an as-sumption that one sample distribution is regarded as an observed probability distribution and another – as a stated probability distribution that the observed sample is expected to fit. The test statistic is calculated as follows:
∑( )
where is the size group number, and are relative shares of establishments in the size group respectively in the first and the second sample distributions, expressed
in percentage.
The null test hypothesis is the following: where and denote the probability of an establishment to be found in size group
in the first and the second sample distributions respectively. The alternative hypothe-sis states that at least one of these equalities does not hold.
The test statistic will possess degrees of freedom since only one restriction is posed on probabilities: for every observed sample distribu-tion. The chi-square statistics is calculated for every two samples under consideration and then compared with its critical value for the 1, 5 and 10% levels of significance. The OLS regression is employed when investigating the shape of distribution the estab-lishment size follows. The regression equation is derived from the definition of the Pa-reto-distributed function. In accordance with Axtell (2001), the cumulative distribution function for a discrete random variable following Pareto distribution is
[ ] ( ) with indicating the minimum possible size value, - a specific size and – a pa-rameter coefficient. Taking logarithms from both sides, the test equation is obtained. The regression equation used to test for whether the establishment size follows the Pare-to distribution looks as follows:
( ) where denotes the probability of the establishment size to be no less than some speci-fied size and is an error term.
Further, two-tailed t-test is used to check the following: - the significance of the estimated parameter;
- the equality of estimated parameter to unity. In other words, t-test investigates weather the establishment size follows a special case of the Pareto distribution – Zipf distribution;
- the invariance of estimated alphas over time and space.
The null hypothesis , stating that the estimated parameter equals to a certain value, is tested against the alternative one, that suggests such equality does not hold.
The test statistic for regression slope is:
where denotes the estimated parameter with standard error , and is the claim made in . The null hypothesis is rejected if the calculated test statistic lies outside the critical points. 1, 5 and 10% levels of significance are considered in the empirical
analy-sis. Test statistic’s p-value might be also used when accepting or rejecting the hypothe-ses. One rejects the null hypothesis if calculated p-value is less than a specified signifi-cance level.
4. EMPIRICAL ANALYSIS AND RESULTS
4.1 Descriptive statistics
The current section presents the analysis carried out for the large regions group. The re-sults obtained for the remaining two groups are identical and presented in the Appendix 2.
Figure 1 depicts the distribution of establishments in the large regions group across five different size groups in 1994. The horizontal axis shows the group number and the ver-tical axis measures the number of establishments that corresponds to the size group.
Figure 1. Number of establishments in the group of large regions in 1994.
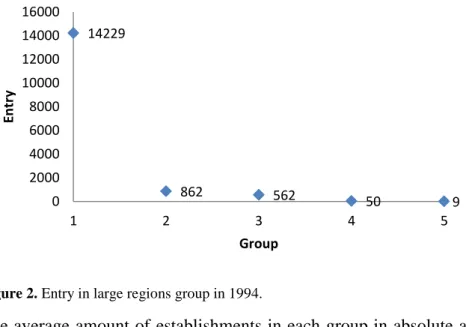
The size distribution of establishments presented in the figure is skewed and can be characterized by larger amounts of small establishments and small number of large es-tablishments. A similar pattern was obtained when looking at the size distribution over the whole period 1994-2009. Moreover, the same tendency was observed when looking at the other distributions – of number of establishments entering and exiting the market and the number of stayers. The number of establishments in each case rises as their size decreases. As an example, the distribution of establishments entering the market in 1994 for the large regions group is presented in Figure 2. The distributions look similar for the other two groups of regions – medium-sized and small.
77353 17404 15338 2558 394 0 10000 20000 30000 40000 50000 60000 70000 80000 90000 1 2 3 4 5 N u m b e r o f e stab lish m e n ts Group number
Figure 2. Entry in large regions group in 1994.
The average amount of establishments in each group in absolute and relative values in period 1994-1997 are shown in Table 2 for various variables. The data confirms the ob-servation of skewed distributions. The largest group is the first size group with the es-tablishment size of 1 to 4 employees. On average more than 67% percent of all estab-lishments that exist by the end of a year belong to this group in period 1994-1997, whereas large establishments account only for 0.337%.
Table 2. Average values of total number of establishments, stayers, entry and exit for the large regions
group in period 1994-1997.
Absolute numbers
Group Period 1 1994-1997
Total Stayers Entry Exit
1 1-4 employees 78449.75000 52703.75000 13083.75000 12414.40000 2 5-9 employees 18058.75000 15972.75000 800.50000 788.60000 3 10-49 employees 16192.00000 14809.75000 457.50000 504.00000 4 50-249 employees 2715.75000 2553.25000 42.25000 47.60000 5 250 or more em-ployees 390.00000 372.50000 4.25000 5.60000 Relative shares Group Period 1 1994-1997
Total Stayers Entry Exit
1 1-4 employees 0.67742 0.60991 0.90934 0.90220 2 5-9 employees 0.15594 0.18484 0.05564 0.05731 3 10-49 employees 0.13982 0.17139 0.03180 0.03663 4 50-249 employees 0.02345 0.02955 0.00294 0.00346 5 250 or more em-ployees 0.00337 0.00431 0.00030 0.00041
Furthermore, the establishments that stayed in the industry during the year are mainly divided between the three following size groups: 60. 99% of establishments belong to size group 1, 18.48% of establishments – to group size 2, and 17.14% - to size group 3. At the same time the entry and exit shares are considerably higher in size group 1 com-paring to the rest of the groups. More than 90% of all entering (and exiting) establish-ments on average come to the group (and leave it) during the year. The amount of large establishments with number of employees exceeding 50 persons that enter and exit is
14229 862 562 50 9 0 2000 4000 6000 8000 10000 12000 14000 16000 1 2 3 4 5 En tr y Group
and exiting establishments. The observed pattern is identical for the rest of the analyzed periods (See Appendix 2).
Table 3 presents the average entry and exit rates in different size groups for the four pe-riods under consideration. Entry and exit rates do not differ a lot in all four pepe-riods. By looking at the table one can conclude that on average 11.48% of all establishments pre-senting on the market at the end of a year were not on the market at the beginning of the year.
Table 3. Average entry and exit rates in the large regions group for Sweden, 1994-2009.
Size group 1994-1997 1998-2001 2002-2005 2006-2009 1994-2009 Average entry rates
1 1-4 employees 0.16686 0.15130 0.14970 0.15734 0.15630 2 5-9 employees 0.04436 0.05037 0.03693 0.04470 0.04409 3 10-49 employees 0.02839 0.03117 0.01793 0.02030 0.02445 4 50-249 employees 0.01564 0.02004 0.00834 0.00678 0.01270 5 250 or more em-ployees 0.01084 0.01181 0.00226 0.00318 0.00702 All groups 0.12437 0.11180 0.10796 0.11531 0.11486
Average exit rates
1 1-4 employees 0.15357 0.14262 0.14926 0.14844 0.14848 2 5-9 employees 0.04015 0.04088 0.04052 0.03512 0.03917 3 10-49 employees 0.02896 0.02634 0.02333 0.01757 0.02405 4 50-249 employees 0.01573 0.01863 0.01261 0.00548 0.01311 5 250 or more em-ployees 0.01550 0.01229 0.00758 0.00341 0.00970 All groups 0.11540 0.10462 0.10814 0.10760 0.10894
However, entry rates in each size group differ considerably from one group to another: the entry rate declines as the establishment size increases. For example, the annual aver-age entry rate for the establishments with 1 to 4 employees during the whole study peri-od is 15.63%, whereas it reaches 0.7% for large establishments with more than 250 em-ployees. Exit rates are similar to the entry rates both in their value and distribution over size groups of establishments. On average 10.89% of firms that existed on the market at the beginning of a year left it by the end of the year. Again much higher exit rates are observed among small establishments.
A different pattern is observed when looking at the average relative shares of incum-bents in the overall number of establishments in each size group by the end of a year (Table 4). The percentage of firms that stayed in the market during a year increases with the number of employees. On average the share of incumbents equals to 68.92% for the firms with 1 to 4 employees and exceeds 90% for the establishment with more than 10 employees. Finally, being rather high in each size group, the shares of incumbents do not differ significantly from one considered period to another.
Table 4. Average Stayers/Total ratios for the large regions group, 1994-2009. Stayers/Total ratio Size group 1994-1997 1998-2001 2002-2005 2006-2009 1994-2009 1 1-4 employees 0.67176 0.69720 0.69867 0.68930 0.68923 2 5-9 employees 0.88455 0.87421 0.89000 0.89179 0.88513 3 10-49 employees 0.91463 0.90779 0.93037 0.93876 0.92289 4 50-249 employees 0.94022 0.92696 0.95232 0.96762 0.94678 5 250 or more em-ployees 0.95539 0.94566 0.97283 0.98312 0.96425 All groups 0.74610 0.76644 0.77112 0.76557 0.76231 4.2 Comparison of distributions
4.2.1 Comparison of distributions within the group of regions
Table 5 depicts the result obtained by comparing the size distribution of different varia-ble between each other. The figures presented are related to the large regions group in period 1994-1997. The two employed techniques – minimum information principle and chi-square test – give identical results regarding the similarity of size distributions.
Table 5. Comparison of distributions within the large regions group in period 1994-1997.
Minimum information principle
Total&Stayers Total&Entry Total&Exit Stayers&Entry Stayers&Exit Entry&Exit
0.00989 0.15647 0.14460 0.23525 0.22121 0.00045
Chi-square test
Total&Stayers Total&Entry Total&Exit Stayers&Entry Stayers&Exit Entry&Exit
2.10609 24.81180 23.27684 37.87114 36.05890 0.09756
The minimum information principle measure is very close to zero when comparing two pairs of distributions: total number of establishments with stayers and entry with exit. This result suggests that paired distributions are same. The relative entropy found for the rest of the pairs allows assuming that the compared distributions diverge.
The chi-square test confirms this result. Critical values for the chi-square statistic for different levels of significance are given in Table 6 below. The chi-square statistic value is less than its critical value at 1, 5 and 10% levels of significance in two cases: when comparing distribution of total number of establishments with stayers and entry and ex-it. Hence, in these two cases the null hypothesis cannot be rejected, meaning that the variables compared have same probability distributions.
Table 6. Chi-square statistic critical values for 1, 5 and 10% levels of significance with 4 degrees of
free-dom.
Level of significance Critical value
1% 7.77944
5% 9.48773
At the same time the chi-square statistic, exceeding its critical value at all presented lev-els of significance, allows rejecting the null hypothesis for the following pairs of varia-bles: total number of establishments and entry, total number of establishments and exit, number of stayers and entry, and finally number of stayers and exit. Here in each case two compared distributions are not the same. These finding are identical for all four pe-riod under consideration.
The current thesis aims to describe the size distributions over time and space. The com-parison of distributions over time is performed by finding the size distribution of a vari-able in each of four periods and comparing the distributions in each period with distri-butions in other periods. Altogether six such comparisons were made for each variable. The results from two methods are shown in Table 7 and Table 8 below.
Table 7. Investigating the invariance of distributions over time within the large regions group. Minimum
information principle measure.
Periods
1&2 1&3 1&4 2&3 2&4 3&4
Total 0.00219 0.00073 0.00047 0.00056 0.00102 0.00007 Stayers 0.00120 0.00060 0.00065 0.00032 0.00040 0.00001 Entry 0.00533 0.00131 0.00138 0.01202 0.00982 0.00047 Exit 0.00057 0.00024 0.00502 0.00096 0.00881 0.00372
The value of minimum information principle measure approximates zero for all consid-ered variables and all pairs of time periods. Hence, one can assume that the distribution of total number of firms, stayers distribution, entry and exit distributions are invariant over time in the large regions group.
Table 8. Investigation of the invariance of distributions over the four periods within the large regions
group. Chi-square test.
Periods
1&2 1&3 1&4 2&3 2&4 3&4
Total 0.45885 0.15304 0.09754 0.10995 0.19827 0.01411 Stayers 0.24904 0.12330 0.13279 0.06380 0.07805 0.00244 Entry 1.29467 0.20558 0.20882 1.76723 1.37878 0.09631 Exit 0.12590 0.04328 0.72179 0.16310 1.20198 0.58028
The conclusion made relying on entropy measure is consistent with the results from the chi-square test. The test statistic in all cases is remarkably less than its critical value at 1, 5 or 10% levels of significance. Hence, size distributions show strong invariance over time. This applies to all size distributions under consideration. The conclusion is true for the other two groups of regions – medium-sized and small (See Appendix 2).
4.2.2 Comparison across groups of regions
This section presents the analysis of size distributions across the groups of regions. Ta-ble 9 reveals the comparison of size distributions of total number of establishments in four periods.
Table 9. Comparison of the size distribution of total number of establishments across different groups of
regions, 1994-2009.
Large&Medium Large&Small Medium&Small
1994-1997
Chi-square 0.21329 0.32074 0.02420
Minimum Information Principle 0.00103 0.00153 0.00012
1998-2001
Chi-square 0.16972 0.26351 0.01951
Minimum Information Principle 0.00082 0.00127 0.00010
2002-2005
Chi-square 0.72047 0.81727 0.04522
Minimum Information Principle 0.00346 0.00387 0.00024
2006-2009
Chi-square 1.02109 1.18040 0.03247
Minimum Information Principle 0.00486 0.00555 0.00017
The minimum information principle measure, alongside with chi-square statistic, indi-cate that the size distribution of total number of establishments is invariant over the groups of regions in all considered time periods. The similar conclusion is made for size distributions of stayers, entry and exit distributions (See Appendix 2).
4.4 Investigating the shape of establishment size distribution
The type of distribution the establishment size follows is tested to fit the Pareto law and the special case of the Pareto distribution – Zipf distribution. Table 10 contains the re-sults obtained from OLS regression on Swedish data using average probability values in four periods, thus regression for each group of regions is based on 20 observations and 60 observation in case of pooled estimation. The detailed regression output is presented in Appendix 3.
Table 10. Power law exponents for Swedish establishments over period 1994-2009. Model with intercept.
Group of regions Estimated α Adjusted F-statistic p-value
Large 1.04678 0.97862 870.53292 0.00000
Medium 1.06811 0.97149 648.45769 0.00000
Small 1.08375 0.97211 663.25600 0.00000
Pooled 1.06621 0.97469 2272.79813 0.00000
In F-test the null hypothesis states that the regression model does not fit the data well, or the model have no predictive power. The large F-ratio and its p-value being smaller than 1,5 and 10% levels of significance allow rejecting the null hypothesis in favor of the al-ternative one. Hence, F-test, alongside with fairly high adjusted , suggest that the re-gression model fit well the data for all three groups of regions and pooled estimation.
Table 11. T-test for the regression slope coefficient.
Group of regions t-test ( ) p-value t-test ( ) p-value
Large 29.50479 0.00000 1.31851 0.20386
Medium 25.46483 0.00000 1.62391 0.12178
Small 25.75376 0.00000 1.62391 0.12178
Pooled 47.67387 0.00000 2.96065 0.00444
The parameter coefficients are statistically significant in all cases as the t-statistic p-value being less than 1, 5 and 10% significant levels allows one to reject (Ta-ble 11). Moreover, the t-test is conducted to check if the estimated regression slope ap-proximates unity. For three groups of regions the null hypothesis H0: α = 1 cannot be
re-jected at the 1, 5 and 10% level of significance. However, the same test performed for the pooled estimation suggests that the equality does not hold. Such a difference of results is connected with a number of observations used in regression.
Slightly different results from the model estimation were obtained when the data sample was widened. Regression was based on the cumulated probability values calculated for each year in period 1994-2009. The estimated alphas (Table 12) are very close in abso-lute values to those obtained previously. Again the regression model fitted the data well with estimated α being statistically significant (See Appendix 3).
Table 12. Power law exponents for Swedish establishments over period 1994-2009. Model with intercept.
Group of regions Estimated α Adjusted t-test (H0:α=1) p-value
Large 1.04684 0.97925 2.73233 0.00778
Medium 1.06820 0.97246 3.37284 0.00116
Small 1.08406 0.97292 4.13226 0.00009
Pooled 1.06637 0.97477 5.98029 0.00000
However, the null hypothesis H0:α=1 is rejected at 1, 5 and 10% significance level.
Thus, a parameter coefficient α for none of the groups of regions, including pooled es-timation, approximates unity. Hence, one can assume that the power law exponent might be significantly different from one regions group to another. To find out if the as-sumption is true the t-test is conducted for every pair of estimated coefficients (Table 13). One coefficient is regarded as estimated, the other coefficient – as its claim value. The test statistic p-values do not allow rejecting the stated null hypothesis at 1% level of significance in all cases. However, at 10% significance level the hypotheses
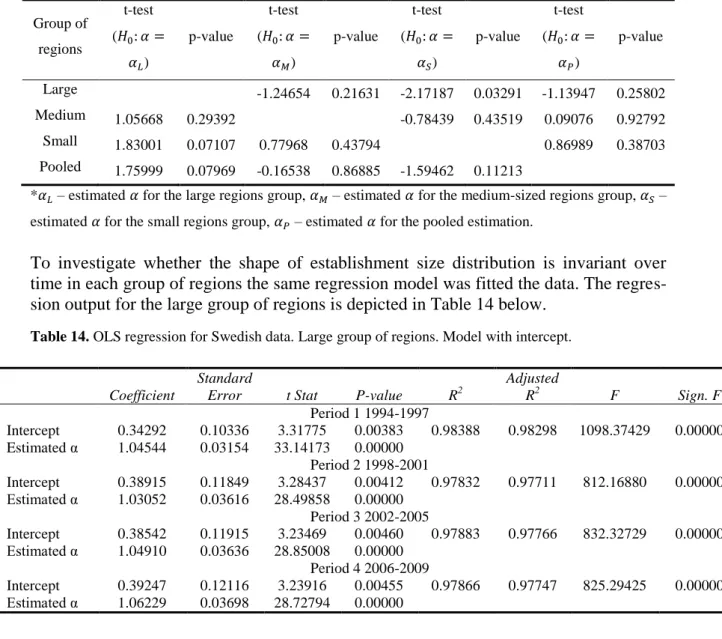
Table 13. Interregional comparison of establishment size distribution shape. Group of regions t-test ( ) p-value t-test ( ) p-value t-test ( ) p-value t-test ( ) p-value Large -1.24654 0.21631 -2.17187 0.03291 -1.13947 0.25802 Medium 1.05668 0.29392 -0.78439 0.43519 0.09076 0.92792 Small 1.83001 0.07107 0.77968 0.43794 0.86989 0.38703 Pooled 1.75999 0.07969 -0.16538 0.86885 -1.59462 0.11213
* – estimated for the large regions group, – estimated for the medium-sized regions group, – estimated for the small regions group, – estimated for the pooled estimation.
To investigate whether the shape of establishment size distribution is invariant over time in each group of regions the same regression model was fitted the data. The regres-sion output for the large group of regions is depicted in Table 14 below.
Table 14. OLS regression for Swedish data. Large group of regions. Model with intercept.
Coefficient
Standard
Error t Stat P-value R2
Adjusted R2 F Sign. F Period 1 1994-1997 Intercept 0.34292 0.10336 3.31775 0.00383 0.98388 0.98298 1098.37429 0.00000 Estimated α 1.04544 0.03154 33.14173 0.00000 Period 2 1998-2001 Intercept 0.38915 0.11849 3.28437 0.00412 0.97832 0.97711 812.16880 0.00000 Estimated α 1.03052 0.03616 28.49858 0.00000 Period 3 2002-2005 Intercept 0.38542 0.11915 3.23469 0.00460 0.97883 0.97766 832.32729 0.00000 Estimated α 1.04910 0.03636 28.85008 0.00000 Period 4 2006-2009 Intercept 0.39247 0.12116 3.23916 0.00455 0.97866 0.97747 825.29425 0.00000 Estimated α 1.06229 0.03698 28.72794 0.00000
Looking at the regression results provided in Table 14 it can be concluded that in each time period the chosen regression model fits the data well with estimated power law ex-ponent being statistically significant at 1, 5 and 10% levels of significance. Moreover, the null hypothesis assuming the equality of α to unity cannot be rejected. In Appendix 3 identical results for the rest two groups of regions are presented.
Similar conclusions are driven from the result obtained for the regression model without intercept, except the fact that regression slope coefficient approaches unity from the left side (See Appendix 3).
4.5 Discussion
As a result of empirical analysis the following conclusions are drawn regarding the es-tablishment size distribution. First, the observed size distribution is skewed with large
size distributions under consideration – distribution of total number of establishments, stayers distribution, entry and exit distribution. Moreover, such skewness remains per-sistent over different time periods and groups of regions.
Entry and exit rates in every size group do not experience significant change over time. However, they differ from one group to another: the rates decline as the establishment size increases. Furthermore, entry and exit rates are found to be very close in values. A different pattern is observed when looking at the average relative shares of incumbents in the overall number of establishments in each size group by the end of a year: the per-centage of firms that stayed in the market during a year increases with the number of employees. The shares of incumbents are considerably high and again show the invari-ance over time.
In the empirical analysis two approaches are used to investigate the invariance of estab-lishment size distribution over periods of time and groups of regions. The first approach involves comparison of size distributions between each other and investigating their similarity. Here identical results were obtained for each group of regions. Total number of firms and stayers, as well as entry and exit are observed to follow the same distribu-tion. It was also discovered that distributions of all the variables under consideration show strong invariance over time and three groups of regions.
The second approach considers the shape of distribution establishment size follows and its changes over time. The size distribution is claimed to follow the Pareto distribution in large, medium-sized and small regions groups. Moreover, having the test based on average values, it approximates the special case of Pareto distribution – the Zipf distri-bution – and shows strong persistence over time. This conclusion coincides with the one made by Axtell (2001) in his study of U. S. firms. When widening the sample the hy-pothesis stating that the size distribution follows the Zipf distribution cannot be accept-ed, however, the establishment size sill fits the Pareto law well.
The observed large incumbent shares, especially for large establishments, and their in-variance over time in each regions group suggest high persistence of firms’ size classes. Hence, the invariance of the establishment size distribution over time might be related to the invariance of distributions of stayers. At the same time, entry and exit are found to follow the same distribution in the three groups of regions. Moreover, the entry and exit rates are comparable in their magnitude, implying that entry and exit in each size group cancel each other and do not influence the size distribution.
This stability of regional structure accessed through the invariance of establishment size distribution allows assuming that the steady state solution exists for any region for a certain time period. Hence, a limit distribution, that the establishment size converge to, can be derived for a group of regions.
5. CONCLUSION
Performed on both regional and interregional levels, the empirical analysis allows draw-ing the followdraw-ing conclusions. The obtained results confirm the previous observation of skewness of establishment size distribution (e. g.. Ijiri and Simon 1977, Axtell 2001). The identical results regarding the invariance of size distribution and its shape were ob-tained for each group of regions under consideration – large, medium-sized and small. Within each group of regions the invariance of establishment size distributions over time was observed. Moreover, the distribution of total number of establishments and stayers are found to rise from the same distribution. The same implication relates to size distributions of entering and exiting establishments. Furthermore, the size distribution happens to be invariant over space too when comparing different groups of regions. The invariance of establishment size distribution is highly determined by the invariance of distributions of stayers, entry and exit distributions.
The stayers in each size group represent the establishments that survive during the year. The relative shares of stayers in the overall number of establishments in each size group increase with the number of employees. This implies that large establishments have more chances to survive and higher probability to remain in current size group compar-ing to smaller ones. Moreover, the vector of relative shares of stayers will compose the diagonal of the transition matrix of a stochastic process, meaning that higher probabili-ties of growth would be attached to smaller establishments. This scale dependence is consistent with the one made by Evans (1987) and Dunne et al. (1989) for the size dis-tribution of plants. Such scale dependence of the establishment size dynamics can be at-tributed, for example, to finantial markets imperfections or subsidies to small businesses (Rossi-Hansberg and Wright, 2007).
The previous research suggested that frequently the firm size distribution was exponen-tially, Yule- or Pareto-distributed (Axtell, 2001). In the current thesis when describing the shape of distribution of the establishment size follows, it was discovered that the da-ta fit well the special case of Pareto distribution – Zipf-distribution. This finding relates to the observation made by Axtell (2001, 2006). As it was discussed the shape of the size distribution showed the strong invariance both over time and the group of regions. As argued by Dosi et al. (1995) the shape of the size distribution is dependent to some extent on the competitive environment and the nature of technology in the analyzed sec-tor (Marsili, 2006). However, the invariance of distribution within each group of regions suggests that those characteristics, alongside with regional policy, possibly have no in-fluence on the establishment size distribution. Another observation made within each region group reveals the coefficient of the Pareto law does not change significantly over four time periods, possibly implying the absence of significant sensibility of size distri-bution to macroeconomic fluctuations.
The observed invariance of size distribution enables to make an important conclusion. It allows assuming that the regional structure is stable and that the steady state solution exists for analyzed time periods, and hence, the limit distributions might be found for each group of regions.
References
Axtell, R. L. (2001), Zipf Distribution of U.S. Firm Sizes, Science, 293, pp. 1818-1820 Axtell, R. L. (2006), Firm Sizes – facts, formulae, fables and fantasies, Center on Social and Economic Dynamics Working Paper No.44
Cover, T. M. and Thomas, J. A. (1991), Elements of Information Theory, John Wiley & Sons, Inc.
Dosi, G., Marsili, O., Orsenigo, L. and Salvatore, R. (1995), Learning, market selection and the evolution of industrial structures, Small Business Economics, 7, pp. 411-436 Dunne, T., Roberts, M. J. and Samuelson, L. (1988), Patterns of Firm Entry and Exit in U.S. Manufacturing Industries, Rand Journal of Economics, 19, pp. 495-515
Ericson, R. and Pakes, A. (1995), Markov-Perfect Industry Dynamics: A Framework for Empirical Work, The Review of Economic Studies, 62, pp. 53-82
Evans, D. S. (1987), The Relationship between Firm Growth, Size and Age: Estimates for 100 Manufacturing Industries, The Journal of Idustrial Economics, 35, pp. 567-581 Gibrat, R. (1931), Les Inégalités économiques (Paris: Sirey)
Ijiri, Y. and Simon, H. (1964), Business Firm Growth and Size, American Economic Review, 54, pp. 77-89
Johansson, B. and Holmberg, I. (1982), A Regional Study of the Distribution of Vintag-es and Profits of Industrial Establishments: A Stochastic Transition Model, in M Albegov, AE Andersson and F Snickars (eds), Regional Development Modelling: Theo-ry and Practice , North-Holland
Jovanovic, B.(1982), Selection and the Evolution of Industry, Econometrica, 50, pp. 649-670
Jovanovic, B. and MacDonald, G. M.(1994), The Life Cycle of a Competitive Industry, Journal of Political Economy, 102, pp. 322-347
Klepper, S. and Simons, K. (2000), Industry Shakeouts and Technological Change, mimeo, Carnegie Mellon University
Marsili, O. (2006), Stability and Turbulence in the Size Distribution of Firms: Evidence from Dutch Manufacturing, International Review of Applied Economics, 20, pp. 255-272
Mueller, D. S. (2003), The corporation: investment, mergers and growth, Routledge Rossi-Hansberg, E. and Wright, M. L. J. (2007), Establishment Size Dynamics in the Aggregate Ecomony, American Economic Review, 97, pp. 1639–1666
Simon, H. and Bonini, C. P. (1958), The size distribution of business firms, American Economic Review, 48, pp. 607-617
Snickars, F. and Weibull, J. W. (1977), A minimum information principle, theory and practice, Regional Science and Urban Economics, 7, pp. 137-168
Spierdijk, L. and Voorneveld, M. (2007), Superstars without talent? The Yule distribu-tion controversy, SSE/EFI Working Paper Series in Economics and Finance, No. 658 Sutton, J. (1997), Gibrat’s legacy, Journal of Economic Literature, 35, pp. 40-59
Wackerly, D. D., Mendenhall III, W. and Scheaffer, R. L. (2008), MathematicaL Statis-tics with Applications, Seventh Edition, Brooks/Cole, Cengage Learning
APPENDCES
Appendix 1 Lognormal distribution
This part of Appendix 1 contains the explanation of the argument behind the law of proportional effect, following John Sutton (1997). If is the firm size and a random variable denotes the growth rate, then
or
In case of very short time periods becomes small. so one can write:
Hence,
When approaches infinity the term becomes small comparing to . Hence. assuming growth rates to be independent, it is can be said that is approximately normally distributed. meaning that the distribution of is approximately lognormal.
Yule distribution
The probability mass function defined for a real parameter and integer is
where is the beta function (Spierdijk and Voorneveld, 2007).
Pareto distribution
The cumulative distribution function for a discrete random variable following Pareto distribution is
[ ] ( )
with indicating the minimum possible size value, - a specific size and – a pa-rameter coefficient (Axtell, 2001).
Exponential distribution
The probability density function of an exponential distribution is (Wackerly, Menden-hall III, Scheaffer, 2008):
Appendix 2
Table A. Average values of total number of establishments, stayers, entry and exit for large regions group
in period 2 1998-2001.
Relative shares
Size group Period 2 1998-2001
Total Stayers Entry Exit
1 1-4 employees 0.64789 0.58937 0.87708 0.89286 2 5-9 employees 0.16338 0.18632 0.07366 0.06318 3 10-49 employ-ees 0.15800 0.18707 0.04406 0.03887 4 50-249 employ-ees 0.02706 0.03272 0.00482 0.00467 5 250 or more employees 0.00367 0.00452 0.00039 0.00042
Table B. Average values of total number of establishments, stayers, entry and exit for large regions group
in period 3 2002-2005.
Relative shares
Size group Period 3 2002-2005
Total Stayers Entry Exit
1 1-4 employees 0.66341 0.60119 0.91944 0.90332 2 5-9 employees 0.15585 0.17987 0.05325 0.05963 3 10-49 employ-ees 0.15233 0.18377 0.02529 0.03375 4 50-249 employ-ees 0.02512 0.03102 0.00194 0.00304 5 250 or more employees 0.00329 0.00415 0.00007 0.00025
Table C. Average values of total number of establishments, stayers, entry and exit for large regions group
in period 4 2006-2009.
Relative shares
Size group Period 4 2006-2009
Total Stayers Entry Exit
1 1-4 employees 0.66875 0.60214 0.91252 0.92431 2 5-9 employees 0.15359 0.17890 0.05954 0.04994 3 10-49 employ-ees 0.14989 0.18379 0.02639 0.02439 4 50-249 employ-ees 0.02474 0.03127 0.00147 0.00126 5 250 or more employees 0.00303 0.00390 0.00009 0.00009
Table D. Average values of total number of establishments, stayers, entry and exit for medium regions
group in period 1 1994-1998.
Relative shares
Size group Period 1 1994-1997
Total Stayers Entry Exit
1 1-4 employees 0.65725 0.59462 0.91522 0.90683 2 5-9 employees 0.17014 0.19833 0.05123 0.05543 3 10-49 employ-ees 0.14503 0.17320 0.03048 0.03406 4 50-249 employ-ees 0.02437 0.02985 0.00284 0.00333 5 250 or more employees 0.00320 0.00401 0.00022 0.00034
Table E. Average values of total number of establishments, stayers, entry and exit for medium regions
group in period 2 1998-2001.
Relative shares
Size group Period 2 1998-2001
Total Stayers Entry Exit
1 1-4 employees 0.63189 0.57571 0.89379 0.90782 2 5-9 employees 0.17746 0.20140 0.06202 0.05664 3 10-49 employ-ees 0.16065 0.18696 0.03976 0.03275 4 50-249 employ-ees 0.02671 0.03194 0.00421 0.00257 5 250 or more employees 0.00328 0.00399 0.00022 0.00021
Table F. Average values of total number of establishments. stayers. entry and exit for medium regions
group in period 3 2002-2005.
Relative shares
Size group Period 3 2002-2005
Total Stayers Entry Exit
1 1-4 employees 0.62433 0.56544 0.91800 0.90999 2 5-9 employees 0.17830 0.20258 0.05365 0.05381 3 10-49 employ-ees 0.16731 0.19604 0.02609 0.03276 4 50-249 employ-ees 0.02712 0.03236 0.00213 0.00325 5 250 or more employees 0.00294 0.00358 0.00013 0.00018
Table G. Average values of total number of establishments, stayers, entry and exit for medium regions
group in period 4 2006-2009.
Relative shares
Size group Period 4 2006-2009
Total Stayers Entry Exit
1 1-4 employees 0.62265 0.55733 0.91382 0.92417 2 5-9 employees 0.18031 0.20703 0.05836 0.05152 3 10-49 employ-ees 0.16819 0.20040 0.02571 0.02266 4 50-249 employ-ees 0.02625 0.03202 0.00206 0.00154 5 250 or more employees 0.00261 0.00327 0.00005 0.00011
Table H. Average values of total number of establishments, stayers, entry and exit for small regions
group in period 1 1994-1998.
Relative shares
Size group Period 1 1994-1997
Total Stayers Entry Exit
1 1-4 employees 0.65546 0.59221 0.91995 0.90953 2 5-9 employees 0.17499 0.20485 0.04647 0.05268 3 10-49 employ-ees 0.14332 0.17071 0.03086 0.03446 4 50-249 employ-ees 0.02339 0.02866 0.00264 0.00327 5 250 or more employees 0.00284 0.00357 0.00008 0.00006
Table I. Average values of total number of establishments, stayers, entry and exit for small regions group
in period 2 1998-2001.
Relative shares
Size group Period 2 1998-2001
Total Stayers Entry Exit
1 1-4 employees 0.63129 0.57405 0.91348 0.91579 2 5-9 employees 0.18137 0.20650 0.05125 0.05477 3 10-49 employ-ees 0.15897 0.18569 0.03178 0.02709 4 50-249 employ-ees 0.02537 0.03018 0.00340 0.00193 5 250 or more employees 0.00301 0.00358 0.00009 0.00042
Table J. Average values of total number of establishments, stayers, entry and exit for small regions group
in period 3 2002-2005.
Relative shares
Size group Period 3 2002-2005
Total Stayers Entry Exit
1 1-4 employees 0.62473 0.56696 0.92320 0.91691 2 5-9 employees 0.18300 0.20815 0.05046 0.05324 3 10-49 employ-ees 0.16518 0.19255 0.02449 0.02784 4 50-249 employ-ees 0.02430 0.02900 0.00176 0.00183 5 250 or more employees 0.00279 0.00333 0.00009 0.00017
Table K. Average values of total number of establishments, stayers, entry and exit for small regions
group in period 4 2006-2009.
Relative shares
Size group Period 4 2006-2009
Total Stayers Entry Exit
1 1-4 employees 0.62140 0.56100 0.92116 0.92777 2 5-9 employees 0.18460 0.20991 0.05663 0.05019 3 10-49 employ-ees 0.16757 0.19725 0.02129 0.02094 4 50-249 employ-ees 0.02386 0.02868 0.00091 0.00110
Table L. Average entry and exit rates in the large regions group for Sweden, 1994-2009. Size group 1994-1997 1998-2001 2002-2005 2006-2009 1994-2009
Average entry rates
1 1-4 employees 0.16686 0.15130 0.14970 0.15734 0.15630 2 5-9 employees 0.04436 0.05037 0.03693 0.04470 0.04409 3 10-49 employees 0.02839 0.03117 0.01793 0.02030 0.02445 4 50-249 employees 0.01564 0.02004 0.00834 0.00678 0.01270 5 250 or more em-ployees 0.01084 0.01181 0.00226 0.00318 0.00702 All groups 0.12437 0.11180 0.10796 0.11531 0.11486
Average exit rates
Size group 0.15357 0.14262 0.14926 0.14844 0.14847 1 1-4 employees 0.04015 0.04088 0.04052 0.03512 0.03917 2 5-9 employees 0.02896 0.02634 0.02333 0.01757 0.02405 3 10-49 employees 0.01573 0.01863 0.01261 0.00548 0.01311 4 50-249 employees 0.01550 0.01229 0.00758 0.00341 0.00970 5 250 or more em-ployees 0.11540 0.10462 0.10814 0.10760 0.10894 All groups 0.15357 0.14262 0.14926 0.14844 0.14847
Table M. Average entry and exit rates in the medium-sized regions group for Sweden, 1994-2009.
Size group 1994-1997 1998-2001 1994-1997 1998-2001 1994-1997
Average entry rates
1 1-4 employees 0.14366 0.12765 0.12523 0.13917 0.13393 2 5-9 employees 0.03110 0.03156 0.02564 0.03067 0.02974 3 10-49 employees 0.02173 0.02248 0.01331 0.01450 0.01801 4 50-249 employees 0.01205 0.01437 0.00669 0.00742 0.01013 5 250 or more em-ployees 0.00716 0.00614 0.00388 0.00190 0.00477 All groups 0.10321 0.090281 0.08518 0.09481 0.09337
Average exit rates
1 1-4 employees 0.14083 0.13371 0.13504 0.13705 0.13666 2 5-9 employees 0.03208 0.03024 0.02790 0.02652 0.02919 3 10-49 employees 0.02284 0.01976 0.01804 0.01248 0.01828 4 50-249 employees 0.01372 0.00943 0.01098 0.00533 0.00987 5 250 or more em-ployees 0.00900 0.00628 0.00577 0.00383 0.00622 All groups 0.10228 0.09410 0.09246 0.09243 0.09532
Table N. Average entry and exit rates in the small regions group for Sweden, 1994-2009. Size group 1994-1997 1998-2001 1994-1997 1998-2001 1994-1997
Average entry rates
1 1-4 employees 0.13887 0.12149 0.12090 0.12797 0.12731 2 5-9 employees 0.02628 0.02373 0.02256 0.02649 0.02477 3 10-49 employees 0.02133 0.01681 0.01213 0.01094 0.01530 4 50-249 employees 0.01120 0.01127 0.00593 0.00335 0.00793 5 250 or more employ-ees 0.00240 0.00250 0.00266 0.00000 0.00189 All groups 0.09896 0.083965 0.08182 0.08631 0.08776
Average exit rates
1 1-4 employees 0.13973 0.13112 0.12921 0.12774 0.13195 2 5-9 employees 0.02922 0.02773 0.02567 0.02333 0.02649 3 10-49 employees 0.02278 0.01600 0.01487 0.01073 0.01609 4 50-249 employees 0.01446 0.00711 0.00654 0.00387 0.00799 5 250 or more employ-ees 0.00263 0.01286 0.00538 0.00000 0.00522 All groups 0.10086 0.09123 0.08803 0.08563 0.09144
Table O. Average Stayers/Total ratios for the medium-sized regions group. Stayers/Total ratio Size group 1994-1997 1998-2001 1994-1997 1998-2001 1994-1997 1 1-4 em-ployees 0.70558 0.72746 0.73214 0.71707 0.72056 2 5-9 em-ployees 0.90914 0.90610 0.91844 0.91993 0.91340 3 10-49 employees 0.93138 0.92903 0.94719 0.95459 0.94055 4 50-249 employees 0.95540 0.95423 0.96461 0.97727 0.96288 5 250 or more em-ployees 0.97663 0.97279 0.98382 0.98683 0.98002 All groups 0.77989 0.79839 0.80840 0.80114 0.79695
Table P. Average Stayers/Total ratio for the small regions group. Stayers/Total ratio Size group 1994-1997 1998-2001 1994-1997 1998-2001 1994-1997 1 1-4 em-ployees 0.71161 0.73639 0.74344 0.73811 0.73239 2 5-9 em-ployees 0.92203 0.92197 0.93183 0.92967 0.92637 3 10-49 employees 0.93801 0.94588 0.95504 0.96236 0.95033 4 50-249 employees 0.96523 0.96363 0.97782 0.98279 0.97237 5 250 or more em-ployees 0.98993 0.96445 0.98120 1.00000 0.98390 All groups 0.78758 0.80981 0.81925 0.81757 0.80855