Linköping University Postprint
A method for accurate localization of the
first heart sound and possible applications
C Ahlstrom, T Länne, P Ask and A Johansson
N.B.: When citing this work, cite the original article.
Original publication:
C Ahlstrom, T Länne, P Ask and A Johansson, A method for accurate localization of the first
heart sound and possible applications, 2008, Physiological Measurement, (29), 3, 417-428.
http://dx.doi.org/10.1088/0967-3334/29/3/011
.
Copyright:
Institute of Physics and IOP Publishing Limited, http://www.iop.org/EJ/journal/PMPostprint available free at:
A method for accurate localization of the first heart sound
and possible applications
C Ahlstrom1,2, T Länne3, P Ask1,2 and A Johansson1, PhD
1Dept. of Biomedical Engineering, Linköpings universitet, Linköping, Sweden 2Biomedical Engineering, Örebro University Hospital, Örebro, Sweden. 3Dept. of Medicine and Care, University Hospital, Linköping, Sweden
Corresponding author: Christer Ahlstrom, christer@imt.liu.se
Abstract
We have previously developed a method for localization of the first heart sound (S1) using
wavelet denoising and ECG-gated peak-picking. In this study, an additional enhancement step based on cross correlation and ECG-gated ensemble averaging (EA) is presented. The main objective of the improved method was to localize S1 with very high temporal accuracy in
(pseudo-) realtime. The performance of S1 detection and localization, with and without EA enhancement, was evaluated on simulated as well as experimental data. The simulation study showed that EA enhancement reduced the localization error considerably and that S1 could be
accurately localized at much lower signal to noise ratios (SNR). The experimental data was taken from ten healthy subjects at rest and during invoked hyper- and hypotension. For this material, the amount of correct S1 detections increased from 91% to 98% when using EA enhancement.
Improved localization performance was also demonstrated when EA enhancement was used for continuous tracking of blood pressure changes and for respiration monitoring via the
electromechanical activation time. These are two typical applications where accurate localization of S1 is essential for the results.
1. Introduction
Accurate localization of heart sounds in noisy phonocardiographic (PCG) signals is difficult. Several methods such as Shannon energy (Liang et al 1997), homomorphic filtering (Gupta et al 2007), frequency analysis (Iwata et al 1980), entropy (Yadollahi and Moussavi 2006) and recurrence time statistics (Ahlstrom et al 2005b) have been suggested. Common for these methods is that they operate solely on the PCG signal with the main purpose of detecting occurrences, not precise locations, of the heart sounds. All of these methods are also based on sliding window approaches, where the width of the window imposes restraints on temporal localization performance. In applications where high accuracy is required, such as continuous tracking of blood pressure changes or respiration monitoring via the electromechanical activation time, sliding window based approaches are thus not suitable.
As the first heart sound (S1) occurs subsequent to the QRS-complex in the electrocardiographic
(ECG) signal, it is possible to improve the robustness of S1 localization algorithms by defining a
search window based on the ECG. To be able to accurately locate S1 within such a window,
wavelet denoising can be used to emphasize S1 occurrences (Ahlstrom et al 2005a, Hongyan and
Zhigang 2000, Johansson et al 2006, Shah and Michaels 2006). In the present study, an additional processing step using ECG-gated ensemble averaging (EA) and cross correlation is presented to further emphasize S1 occurrences. EA is a reliable noise reduction technique that has proven
useful on many other biomedical signals such as evoked potentials and late potentials, see Sörnmo and Laguna (2005) and references therein. In this study, the performance of S1 detection
and localization, with and without EA enhancement, will be compared and evaluated on simulated and experimental S1 data.
Simultaneous recordings of ECG and PCG signals provide data to noninvasively estimate the cardiac electromechanical activation time (Moyers et al 2007), here defined as the time interval from the R-peak in the ECG to S1 in the PCG (RS1). The RS1 interval has previously been used to
monitor respiration rate (Johansson et al 2006) and to track changes in blood pressure (Ahlstrom et al 2005a). S1 detection without EA enhancement was used in both those studies. In the present
study, possible improvements in S1 localization accuracy by using EA enhancement will be
investigated. The same data material as used in the previous two studies was used. A portable multi-sensor device able to monitor respiration and/or blood pressure would not only be interesting in a clinical setting, but also in home health care or in exercise testing and sport sciences.
The aims of this paper are to investigate EA enhancement as a preprocessing step to facilitate detection and localization of S1, and to evaluate possible performance gains on both simulated
and experimental data.
2. Methodology
The RS1-interval is defined as the time lag between the R-peak of the ECG signal and the
subsequent S1 occurrence in the PCG signal. R-peak detection will not be described further,
instead we refer to the review by Köhler et al (2002).
To detect and localize S1 without EA enhancement, we utilized a previously described algorithm
where S1 occurrences are emphasized by wavelet packet denoising of the PCG signal using a
Daubechies 6 wavelet and Stein’s unbiased estimate of risk threshold (Ahlstrom et al 2005a). This method basically chooses the first local maximum within a predefined time window in the
PCG signal as the location of S1. The predefined window had a width of 250 ms, starting with the
R-peak in the ECG.
To detect and localize S1 with EA enhancement, we started with the same wavelet denoising
scheme as above. The next step was to create a patient specific template of s1(n) by EA. An
additive signal model was assumed, where the measured signal xi(n) is composed of random noise
vi(n) and a deterministic signal component s1(n) according to equation (1). In accordance with the
search window defined above, the realizations xi(n) were extracted from the PCG signal using a
250 ms window starting with the R-peak in the ECG. Each heart cycle is denoted by the index i=1,…,M, while n=1,…,250 ms denotes time. The occurrence time of the signal component s1(n)
is allowed to vary in time with respect to the QRS occurrence time, and this so called latency shift is accounted for by θi.
( )
n s(
n) ( )
v nxi = 1 −θi + i (1)
To get an initial estimate of s1(n), the sound was assumed to occur after a constant time delay
relative to the R-peak. The maximum likelihood estimator of s1(n) is then, assuming fixed white
Gaussian noise, given by the ensemble average in equation (2). The notation w:M indicates that the w most recent heart cycles are used in the estimation of the current heart cycle M. The second part of the equation estimates in a recursive manner, where the estimate is refined as new heart cycles become available.
( )
n sˆw:M( )
n sˆw:M( )
( )
( )
(
x( )
n s( )
n w n s n x w n s M wM M wM w M i i M w: : 1 ˆ : 1 1 1 ˆ 1 1 ˆ − − − = − + + ≈ + =∑
)
(2)The time delay between the R-peak and S1 is, however, not entirely constant. To compensate for
this variation in latency, Woody’s method was applied (Woody 1967). The outline of Woody’s original algorithm is as follows:
1. Estimate a typical heart sound using equation (2)
2. Use cross correlation between each heart sound segment xi and the typical heart sound to
find θi. (The maximum likelihood estimator of θi is determined as the maximum of the
cross correlation function (Sörnmo and Laguna 2005)).
3. Calculate a new typical heart sound using equation (2), but use the latency corrected segments instead of xi(n).
4. Iterate step 2 – 4 until the difference between a new θi and an old θi is sufficiently small.
To fit Woody’s algorithm into the recursive framework, a few modifications were made; latency correction was performed by cross correlating xM(n) with the previous estimate before
calculating , and only one iteration step was carried out.
( )
n sˆw:M−1( )
nsˆw:M
Once the estimate is obtained, this template is cross correlated with the PCG signal using lagged products. The S
( )
n sˆw:M1 occurrence was then determined as the maximum peak within the
predefined window, see figure 1. Note that the only significant, yet important, difference between the algorithm described in (Ahlstrom et al 2005a) and the new algorithm is the EA enhancement step.
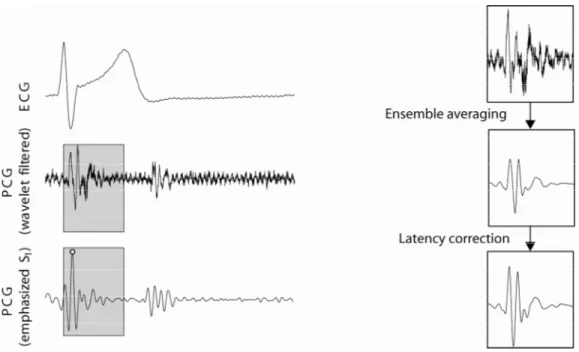
Figure 1. Example showing the predefined window (grey boxes) in the PCG. The window ranges from the R-peak in the ECG and have a width of 250 ms. In the right-hand side of the figure, the effect of ensemble averaging and latency shift correction is illustrated (w=100). The resulting template is cross correlated with the wavelet filtered PCG signal (EA enhancement), resulting in a signal with emphasized s1-occurences (the s1-detection is marked by the white circle).
2.1. Simulations
A simulation study was carried out to investigate the robustness to noise and the necessary amount of realizations needed for ensemble averaging. A simulated s1(n), originally presented by
Chen et al (1997), was used for these investigations. The model is composed of a valvular component and a myocardial component, where the valvular component is modeled as a sum of exponentially decaying sinusoids while the myocardial component is represented by an amplitude and frequency modulated sinusoid. All calculations were performed in MATLAB 7.3 (The MathWorks, Inc., Natick, MA, USA).
The reduction in noise level as a function of the number of heart cycles was investigated as the difference between the original and the estimated signal in the mean square error sense (MSE). White noise was added corresponding to an SNR of -20, -15, -10 and -5 dB.
The percentage of correct detections as well as the mean localization error was evaluated as a function of SNR, both with and without EA enhancement, using a simulated signal consisting of 1000 heart cycles, where was estimated recursively with w=20. An error margin of ±1 and ±3 ms was used for deciding whether a localization was correct or not.
( )
n sˆw:M
2.2. Feasibility study
Ten healthy test subjects volunteered for the feasibility study (mean ± SD); age = 28 ± 3 years, length = 183 ± 8 cm, weight = 83 ± 11 kg, male: female = 8:2. All subjects gave their informed consent to participate and the local ethics committee approved the study.
The acquisition protocol consisted of five phases; a five minute resting phase, about five minutes of hypotension, five minutes of rest, about two minutes of hypertension and finally another five minutes of rest. Lower body negative pressure (LBNP) was applied to invoke hypotension and isometric muscle contraction to invoke hypertension. More details about the acquisition protocol are available in previous publications (Ahlstrom et al 2005a, Johansson et al 2006).
The ECG (Diascope DS 521, S&W Medicoteknik AS, Albertslund, Denmark, standard 3-lead placement) and the PCG (Siemens E285E microphone amplifier with a Siemens EMT25C
microphone, Solna, Sweden, located at the second intercostal space along the right sternal border) were recorded. The test subjects were instructed to relax and breathe naturally throughout all measurement phases. As respiration reference, the Optovent system (Accelerator AB, Linkoping, Sweden) was used. The ECG, PCG and respiratory signals were digitized with a DAQ-Card 700 from National Instruments (Austin, TX, USA, fs = 2 kHz).
Blood pressure was measured with either an automatic oscillometric instrument (Datascope Accutor Plus, Paramus, NJ, USA, located on the upper left arm, n = 8) or a cannula (Becton Dickinson, Franklin Lakes, NJ, USA) positioned in the left radial artery connected to a blood pressure transducer (Abbott Critical Care Systems, Chicago, IL, USA) and connected to a monitor (Medimatic, Genoa, Italy, n = 2). Systolic blood pressure was calculated automatically about every 60 seconds (Datascope) and for each cardiac pulse in the intra-arterial recordings (Medimatic).
The QRS detection algorithm used in the applications was based on Börjesson et al (1982) and operated according to the following steps; filtering (5th order Butterworth band pass filter with
cut-off frequencies 5 and 50 Hz), squaring and thresh holding.
Inter-subject variations in the signal templates extracted with Woody’s method were calculated as the maximum value of the cross correlation function. Each template was normalized so that the auto-correlations at zero lag were equal to one. All available heart sounds in each patient were used in these calculations. The processing of data was performed in MATLAB 7.3 (The MathWorks, Inc., Natick, MA, USA).
2.2.1. S1 localization
The number of correct S1 localizations was calculated via the derived trace of RS1-intervals. To
get a quantitative measure of a correct S1 localization, detections giving rise to RS1-intervals
locally deviating more than three standard deviations from its neighbouring RS1-intervals were
considered erroneous. The running standard deviation was calculated in a 5 seconds sliding window. This analysis was performed on the entire recordings without investigating the five measurement phases separately. The RS1-traces were determined both with and without EA
enhancement of the PCG signal, and the averages used w=50 heart cycles. To avoid unnecessary false detections close to the border of the signals, was estimated in a noncausal manner so that 50 heart cycles always were used in the estimation.
( )
n sˆw:M2.2.2. Continuous tracking of blood pressure changes
The correlation coefficient between systolic blood pressure and the RS1-trace, derived with and
without EA enhancement, was calculated. Since both the systolic blood pressure signal and the RS1-trace contain higher frequency components such as breathing variations, the signals were
0.02 Hz (assuming a heart rate of 1 beat per second). In the oscillometric recordings, data were upsampled to one sample per heartbeat by using piecewise cubic Hermite interpolating
polynomials.
2.2.3. Continuous monitoring of respiration
The respiratory variation in the RS1-trace, derived both with and without EA enhancement, was
investigated in the different measurement phases separately (all three resting phases were put together). To avoid disturbances when invoking blood pressure changes a fifteen second (centred) data window was removed at each measurement phase transition prior to data analysis. Reference respiratory cycles were set as the regions between expiration marks in the respiration reference. The number of false positive and false negative breath detections was calculated. A breath was assumed correct if there was exactly one local minimum in the RS1-trace during the reference
respiratory cycle. A false positive was registered if there was more than one minimum and a false negative if there were no minima (an example of a false positive can be found about one third into the respiratory trace in figure 4).
3. Results
3.1. Simulations
After a few heart cycles, the EA enhancement algorithm provided excellent results at an SNR of -10 dB, see figure 2. At -15 dB, the algorithm stabilized at a detection ratio of about 96% after 40 heart cycles. Corresponding values for -20 dB were 100 heart cycles and a detection rate of 45%. The same convergence rates were also seen in the mean square error plot (figure 2).
Localization errors as a function of SNR are presented in figure 3(a). The mean error rapidly converged to zero, but outliers gave a certain amount of detection errors. With EA enhancement, accurate results (95% correct detections) with localization errors of less than ±1 ms were
obtainable with an SNR of at least -3 dB (-10 dB for an accuracy of ±3 ms). Without EA enhancement, accurate results were obtainable at an SNR of -7 dB (±3 ms), while the best achievable detection rate was about 45% using an error tolerance of ±1 ms, see figure 3(b).
Figure 2. Mean square error (MSE) between the original signal and the estimated signal as a function of the number of heart cycles (M) used for averaging (a). The different lines correspond to an SNR of -20, -15, -10 and -5 dB. Also shown is the percentage of correct detections as a function of the number of heart cycles used for noise reduction (b). The different lines correspond to an SNR of -20, -15, -10 and -5 dB (-10 and -5 dB are on top of each other).
Figure 3. The localization error as a function of SNR (a). The bold solid line and the bold dashed line
represent the mean localization error with and without EA enhancement, respectively. The shaded areas represent the standard deviation of the localization error with (dark grey) and without (light grey) EA enhancement, respectively. Also shown are the percentages of correct detections as a function of SNR (b). The different lines correspond to two error tolerances (errors of 1 and 3 ms were allowed, respectively) both with and without EA enhancement. EA was performed using w=20 heart cycles.
3.2. Feasibility study
Results obtained without EA enhancement have previously been reported by the authors (Ahlstrom et al 2005a, Johansson et al 2006). Data from two subjects were excluded due to difficulties for the subjects to adapt to the measurement situation. The total number of detected heartbeats was 11398 and the amounts of correct heart sound detections are presented in table 1. An example of an original heart sound and the ensemble averaged heart sound was shown in figure 1. The cross correlation between signal templates from different subjects was 0.57±0.16 (Mean±std, range 0.26 – 0.81), indicating considerable morphological inter-subject variations.
Table 1. Correct S1 detections (%)
Subject Without EA With EA
1 96.5 98.5 2 86.7 87.9 3 89.2 96.0 4 98.6 99.6 5 94.5 99.5 6 95.5 100 7 86.4 99.0 8 77.7 100 Mean±std 90.6±7.1 97.6±4.1
3.2.1. Continuous tracking of blood pressure changes
The reference blood pressure measurements showed that all subjects were normotensive with (Mean±std) systolic blood pressure 119±8 mmHg and diastolic blood pressure 71±9 mmHg. LBNP reduced upper body systolic blood pressure by 24±14 mmHg and the static muscle contraction increased it by 18±12 mmHg. Table 2 contains correlation coefficients between systolic blood pressure and the RS1-trace, showing improved performance with EA enhancement.
Table 2. Correlation coefficients, low pass filtered systolic blood pressure vs. RS1-interval
Subject Without EA With EA
1 0.83 0.86 2 0.91 0.85 3 0.44 0.58 4 0.70 0.73 5 0.74 0.75 6 0.67 0.74 7 0.76 0.77 8 0.73 0.84 Mean±std 0.72±0.10 0.76±0.09
Figure 4. Example showing all five measurement phases (20 minutes) from one test subject; the inverse of the RS1-interval trace (top left), systolic blood pressure (top right) and an enlargement
showing the respiratory oscillations. The dashed vertical lines are breaths as determined by the respiration reference.
3.2.2. Continuous monitoring of respiration
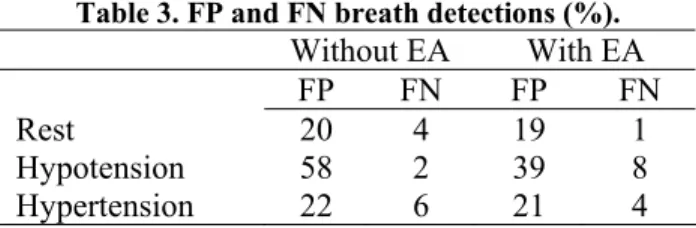
The number of respiratory cycles analyzed was 2326, and the amount of false positive and false negative breath detections is summarized in table 3. Clearly, EA enhancement provided improved results, especially in the very noisy hypotension phase. It is also evident that false positives dominated false negatives. The correspondence between respiration and the oscillatory variations
in RS1-trace is illustrated in figure 4. The breath detection results are based on data where only
respiratory cycles without false S1 detections are used.
Table 3. FP and FN breath detections (%). Without EA With EA FP FN FP FN Rest 20 4 19 1 Hypotension 58 2 39 8 Hypertension 22 6 21 4 4. Discussion
A novel method for emphasizing and accurately localizing S1 in PCG signals has been introduced,
and improved localization performance was demonstrated on both simulated and experimental data. Applications are primarily seen in situations where time intervals, such as the RS1-interval,
need to be determined with very high accuracy. Tracking variations in the RS1-trace due to blood
pressure changes or respiration are typical applications.
Several methods have been suggested for heart sound localization (Ahlstrom et al 2005b, Gupta et al 2007, Iwata et al 1980, Liang et al 1997, Yadollahi and Moussavi 2006). Common for these methods are that they are operating with the main purpose of detecting, not accurately localizing, the heart sounds. All of these methods operate on data derived from sliding windows with a duration of at least 50 ms. The width of the window provides a lower limit to the best possible time resolution of the S1 localization. Even when using overlapping windows, this problem
remains. All in all, the accuracy of the S1 localization will not be accurate enough for our
suggested applications.
Using ECG-gated EA for noise reduction and cross correlation for localization, we are able to locate S1 with high accuracy. The ECG signal is an inherent part of the applications, so no
additional sensors are needed. The R-peak in the ECG is used to find S1 whereupon the
localization algorithm can focus on fine-tuning its exact position. The search window which was used to roughly locate S1 was excessively set to 250 ms in this study. This window width is not
critical, and was chosen to make sure that S1 was contained in the time window even at very low
heart rates.
The noise reduction abilities of ensemble averaging rest upon a number of assumptions whose validity should be commented (Sörnmo and Laguna 2005). (i) The noise should be zero mean. The PCG signal is measured as a time series of fluctuations whose DC level is irrelevant. Subtracting the mean or high pass filtering the signal does not influence the frequency content of the heart sounds. (ii) The noise should be uncorrelated from heart sound to heart sound. This is usually the case, but power line interference presents potential problems. (iii) The morphology of S1 should be fixed from heart cycle to heart cycle. This means that the alignment should be
perfect and that the shape and width of S1 should be constant. It has been argued that ensemble
averaging is inappropriate for noise reduction of PCG signals (Haghighi-Mood and Torry 1996) since the morphology of heart sounds varies with physiological processes such as respiration. However, these variations in morphology mostly affect the second heart sound (S2) while the
appearance of S1 is quite robust. Averaging techniques such as Dynamic Time Warping or
Integral Shape Averaging (Boudaoud 2005), which are able to compensate for time shifts and time scale fluctuations, might however improve the template. (iv) There should be no correlation between the heart sounds and the noise. This issue is of no concern in this study. (v) The
statistical distribution of the noise should be Gaussian. Ensemble averaging is an optimal
was slightly subgaussian in this study. This implies that a more robust averaging technique might improve the results. This issue is left for future studies.
In previous research, wavelets have been used for emphasizing heart sounds in the PCG signal and for automatic determination of the RS1-interval (Ahlstrom et al 2005a, Hongyan and Zhigang
2000, Johansson et al 2006, Shah and Michaels 2006). In wavelet analysis, a multi scale representation of the signal is created by correlation with a scaled mother wavelet. The EA enhancement approach is related to the wavelet technique where can be seen as a patient-specific mother wavelet determined from the signal itself. A major difference to wavelet analysis is, of course, that correlation only operates on a single scale. In this study, it was found that the inter-subject variability of should not be neglected, thus indicating that EA enhancement is a necessary processing step. Possible reasons for this inter-subject variability are factors such as the transthoracic transfer function as well as hemodynamic differences in the cardiovascular system.
( )
n sˆw:M( )
nsˆw:M
The simulation study showed that an SNR above -3 dB is required to get reliable localization results with an accuracy of ±1 ms. This accuracy is required when monitoring respiration via the RS1-trace, as peak to peak values of about 3 ms are expected (Johansson et al 2006). In other
applications, such as in the tracking of blood pressure changes, less accurate localization is required (Ahlstrom et al 2005a), allowing an SNR of about -10 dB. The simulation results indicate that it is not possible to obtain reliable S1 localizations with an accuracy of ±1 ms
without using EA enhancement. This is explained by figure 3, which indicates that the localization error converges very slowly towards zero without EA enhancement, even at high SNR. It may be doubted whether validation of the method with white noise is justified. Due to the wavelet noise reduction, noise will probably not be Gaussian any more. Therefore the simulation results may be too optimistic. This will, however, affect the analysis of both the old and the new method in a comparable manner.
The correct localization rate increased from 91% to 98% when using EA enhancement on experimental data. Higher error rates were found during the blood pressure provocations, probably due to increased noise levels. In the hypotension phase, considerable acoustic noise originating from the LBNP device was present, and in the hypertension phase, muscle contraction altered the damping characteristics of the thorax. In the latter case, the deterministic part of equation (2) is altered, and it takes some time for the recursive algorithm to adapt to the new measurement situation.
Validation of the method was shown in simulated data only whereas feasibility was shown in a group of 10 healthy subjects. It would have been interesting to compare our method with an independent method, but to our knowledge, no other methods exist for accurate S1 localization.
Similar methods based on wavelet denoising has been used by Hongyan and Zhigang (2000) and Shah and Michaels (2006), but since they are very similar to our old method, they can not be considered independent. It would also have been useful to evaluate the new method on patient data, for example, monitoring blood pressure changes in a dialysis setting or respiration as part of a polysomnography test. Clinical feasibility studies are left for future studies.
4.1. Continuous tracking of blood pressure changes
The arterial pulse wave transit time has been suggested as a method for indirect blood pressure measurement in many studies (Ahlstrom et al 2005a, Foo et al 2006, Newlin 1981). The pulse wave transit time is often measured as the time delay between the R-peak in the ECG and pulse arrival at a peripheral site such as the finger. Clearly, this measurement includes the RS1-interval.
As mentioned in the introduction, the RS1-interval is very similar to the pre-ejection period. Some
studies have presented results indicating that the pre-ejection period should be included in the transit time (Newlin 1981) while other studies suggest that the pre-ejection period should be excluded (Foo et al 2006, Payne et al 2006). The results in this study clearly show that the RS1
-interval is strongly correlated to systolic blood pressure, indicating that improved tracking of blood pressure changes can be achieved by considering this parameter in the blood pressure estimations.
4.2. Continuous monitoring of respiration
The respiration synchronous part of the RS1-trace provides a non-intrusive measure that can be
used for respiration monitoring (Johansson et al 2006). Since only the R-peak of the ECG is required to detect ventricular depolarization, a single multi-sensor including a microphone and an ECG electrode could be fitted in a convenient chest sensor.
Improvements with EA enhancement were limited. However, in the hypotension phase where noise heavily influenced the PCG signal, the new method resulted in a 13% increase in the amount of correct breath detections. This is a direct consequence of the improved accuracy obtained when using EA enhancement.
In addition to the respiratory fluctuations in the RS1-trace, respiratory information is also
frequency and amplitude modulated into the ECG signal itself. In addition, transthoracic impedance can be measured via the ECG-electrodes. All these components can be merged with the RS1-trace in a data fusion approach to improve the accuracy and robustness of the breath
detections. A deeper analysis of these ideas is beyond the scope of this article.
5. Conclusions
ECG-gated ensemble averaging (EA) was investigated as a mean to emphasize occurrences of S1
in PCG signals. Localization errors were considerably reduced when using EA enhancement, even at low SNR. The improved localization performance proved useful for the two applications of continuous blood pressure measurement and respiration monitoring. A noninvasive and non-intrusive multi-sensor device able to measure ECG and PCG could be realized in a simple chest belt for monitoring respiration and blood pressure changes. Applications are seen in home health care as well as in exercise testing, sport sciences and certain clinical applications.
6. Acknowledgements
The authors are grateful to Christina Svensson, Bettan Kindberg and Kerstin Nilsson at the Department of Clinical Physiology, Linköping University Hospital, for help and support during the measurement process.
This study was supported by the Swedish research council and the Regional Growth Initiative for Health ”Hälsans nya verktyg”.
7. References
Ahlstrom C, Johansson A, Uhlin F, Lanne T and Ask P 2005a Noninvasive investigation of blood pressure changes using the pulse wave transit time: a novel approach in the monitoring of hemodialysis patients J Artif Organs 8 192-7
Ahlstrom C, Liljefeldt O, Hult P and Ask P 2005b Heart sound cancellation from lung sound recordings using recurrence time statistics and nonlinear prediction IEEE Sig Proc Lett 12 812-15
Boudaoud S, Rix H, Meste O 2005 Integral shape averaging and structural average estimation: a comparative study IEEE Trans Sig Proc 53 3644-50
Börjesson P, Pahlm O, Sörnmo L and Nygards M E 1982 Adaptive QRS detection based on maximum a posteriori estimation IEEE Trans Biomed Eng 29 341-51
Chen D, Durand L G and Lee H C 1997 Time-frequency analysis of the first heart sound. Part 1: simulation and analysis Med Biol Eng Comput 35 306-10
Foo J Y, Lim C S and Wang P 2006 Evaluation of blood pressure changes using vascular transit time Physiol Meas 27 685-94
Gupta C N, Palaniappan R, Swaminathan S and Krishnan S M 2007 Neural network classification of homomorphic segmented heart sounds Applied Soft Computing 7 286-97
Haghighi-Mood A and Torry J N 1996 Time-varying filtering of the first and second heart sounds Proc. 18th Ann. Int. Conf. IEEE Engineering in Medicine and Biology (Amsterdam:
Netherlands) p 950-51
Hongyan L and Zhigang W 2000 Algorithms development for systolic time intervals and clinical assessment of cardiac function Proc 22nd Ann. Int. Conf. IEEE Engineering in Medicine and Biology (Chicago: US) p 966-969
Iwata A, Ishii N, Suzumura N and Ikegaya K 1980 Algorithm for detecting the first and the second heart sounds by spectral tracking Med Biol Eng Comput 18 19-26
Johansson A, Ahlstrom C, Lanne T and Ask P 2006 Pulse wave transit time for monitoring respiration rate Med Biol Eng Comput 44 471-8
Köhler B U and Hennig C and Orglmeister R 2002 The principles of software QRS detection IEEE Eng Med Biol Mag 21 42-57
Liang H, Lukkarinen S and Hartimo I 1997 Heart sound segmentation algorithm based on heart sound envelogram Proc. Computers in Cardiology (Lund: Sweden) p 105-8
Moyers B, Shapiro M, Marcus G M, Gerber I L, McKeown B H, Vessey J C, Jordan M V, Huddleston M, Foster E, Chatterjee K and Michaels A D 2007 Performance of
phonoelectrocardiographic left ventricular systolic time intervals and b-type natriuretic peptide levels in the diagnosis of left ventricular dysfunction. Ann Noninvasive
Electrocardiol 12 89-97.
Newlin D B 1981 Relationships of pulse transmission times to pre-ejection period and blood pressure Psychophysiology 18 316-21
Payne R A, Symeonides C N, Webb D J and Maxwell S R 2006 Pulse transit time measured from the ECG: an unreliable marker of beat-to-beat blood pressure J Appl Physiol 100 136-41 Shah S and Michaels A D 2006 Hemodynamic correlates of the third heart sound and systolic
time intervals Congest Heart Fail 12 8-13
Sörnmo L and Laguna P 2005 Bioelectrical Signal Processing in Cardiac and Neurological Applications (New York:Elsevier)
Woody C 1967 Characterization of an adaptive filter for the analysis of variable latency neuroelectric signals Med Biol Eng Comput 5 539-54
Yadollahi A and Moussavi Z M 2006 A robust method for heart sounds localization using lung sounds entropy IEEE Trans Biomed Eng 53 497-502