Lancet Neurol 2019; 18: 439–58
Published Online March 11, 2019 http://dx.doi.org/10.1016/ S1474-4422(19)30034-1 See Comment page 417 *Collaborators listed at the end of the Article
Correspondence to: Dr Catherine O Johnson, Institute for Health Metrics and Evaluation, University of Washington, Seattle, WA 98121, USA
johnsoco@uw.edu or
Prof Valery L Feigin, National Institute for Stroke and Applied Neurosciences, School of Public Health and Psychosocial Studies, Faculty of Health and Environmental Sciences, AUT University, Northcote, Auckland 0627, New Zealand valery.feigin@aut.ac.nz
GBD 2016 Stroke Collaborators*
Summary
Background
Stroke is a leading cause of mortality and disability worldwide and the economic costs of treatment and
post-stroke care are substantial. The Global Burden of Diseases, Injuries, and Risk Factors Study (GBD) provides a
systematic, comparable method of quantifying health loss by disease, age, sex, year, and location to provide information
to health systems and policy makers on more than 300 causes of disease and injury, including stroke. The results
presented here are the estimates of burden due to overall stroke and ischaemic and haemorrhagic stroke from
GBD 2016.
Methods
We report estimates and corresponding uncertainty intervals (UIs), from 1990 to 2016, for incidence,
prevalence, deaths, years of life lost (YLLs), years lived with disability (YLDs), and disability-adjusted life-years
(DALYs). DALYs were generated by summing YLLs and YLDs. Cause-specific mortality was estimated using an
ensemble modelling process with vital registration and verbal autopsy data as inputs. Non-fatal estimates were
generated using Bayesian meta-regression incorporating data from registries, scientific literature, administrative
records, and surveys. The Socio-demographic Index (SDI), a summary indicator generated using educational
attainment, lagged distributed income, and total fertility rate, was used to group countries into quintiles.
Findings
In 2016, there were 5·5 million (95% UI 5·3 to 5·7) deaths and 116·4 million (111·4 to 121·4) DALYs due to
stroke. The global age-standardised mortality rate decreased by 36·2% (–39·3 to –33·6) from 1990 to 2016, with
decreases in all SDI quintiles. Over the same period, the global age-standardised DALY rate declined by 34·2%
(–37·2 to –31·5), also with decreases in all SDI quintiles. There were 13·7 million (12·7 to 14·7) new stroke cases in
2016. Global age-standardised incidence declined by 8·1% (–10·7 to –5·5) from 1990 to 2016 and decreased in all SDI
quintiles except the middle SDI group. There were 80·1 million (74·1 to 86·3) prevalent cases of stroke globally in
2016; 41·1 million (38·0 to 44·3) in women and 39·0 million (36·1 to 42·1) in men.
Interpretation
Although age-standardised mortality rates have decreased sharply from 1990 to 2016, the decrease in
age-standardised incidence has been less steep, indicating that the burden of stroke is likely to remain high. Planned
updates to future GBD iterations include generating separate estimates for subarachnoid haemorrhage and
intracerebral haemorrhage, generating estimates of transient ischaemic attack, and including atrial fibrillation as a
risk factor.
Funding
Bill & Melinda Gates Foundation
Copyright
© 2019 The Author(s). Published by Elsevier Ltd. This is an Open Access article under the CC BY 4.0 license.
Introduction
Globally, stroke is a leading cause of mortality and
disability and there are substantial economic costs
for
post-stroke care.
1Results from the 2015 iteration of the
Global Burden of Diseases, Injuries, and Risk Factors
Study (GBD) showed that although the age-standardised
death rates and prevalence of stroke have decreased over
time, the overall burden of stroke has remained high.
2As populations age, and low-income and middle-income
countries go through the epidemiological transition from
infectious to non-communicable diseases as the
pre-dominant cause of morbidity, together with con comitant
increases in modifiable risk factors, it is expected that the
Although estimates of disease burden for stroke have
been produced by other research groups by
meta-analysing data in the literature on incidence and deaths,
4–6GBD is unique in its approach to generating estimates
for all locations, including those with scarce or no
epidemiological data, by using all available data from the
literature, administrative hospital and medical claims
records, and cause of death records. Additionally, the
methods used by GBD allow unspecified stroke to
contribute to both fatal and non-fatal estimates. These
methods allow GBD to document disease burden from
stroke in the most comprehensive way over time and to
provide the necessary information for priority setting
prevalence, incidence, and disability for overall stroke
and the pathological types of ischaemic and haemorrhagic
stroke, using the standard GBD metrics of deaths,
pre-valence, incidence, years of life lost (YLLs), years lived
with disability (YLDs), and disability-adjusted life-years
(DALYs).
Methods
Overview
Methods used to generate estimates of stroke incidence,
mortality, prevalence, YLDs, YLLs, and DALYs have been
described in previously; additional details are in the
appendix.
7,8Sources included in all models can be
accessed via the GBD 2016 Data Input Sources Tool. For
all models, point estimates were calculated from the
mean of 1000 draws from the posterior distribution
by age, sex, location, and year. 95% uncertainty intervals
(UIs) were the 25th and 975th values of the ordered draws.
The study was compliant with GATHER guidelines.
9Case definition
Stroke was defined according to WHO criteria as rapidly
developing clinical signs of focal (at times global)
disturbance of cerebral function lasting more than
24 h or leading to death with no apparent cause other
than that of vascular origin.
10Data on transient ischaemic
attack were not included because of the very short period
of disability and no associated mortality for these events.
We modelled acute and chronic stroke separately. Stroke
cases were considered acute from the day of incidence of
a first-ever stroke through day 28 after the event. Stroke
cases were considered chronic (prevalent) from 29 days
after the occurrence of an event. Chronic stroke included
the sequelae of an acute stroke and all recurrent stroke
events. 28 days was selected as the cutoff between acute
and chronic stroke because this corresponds to the period
of early case fatality.
11Incident strokes were defined as the occurrence of
first-ever stroke on the basis of a clinical diagnosis by a
physician according to the WHO criteria described above.
Ischaemic strokes were defined as all atherosclerotic and
thromboembolic events that resulted in compromised
blood flow to brain tissue and subsequent infarction.
Haemorrhagic strokes were defined as all non-traumatic
events due to subarachnoid or intracerebral haemorrhage
identified by neuroimaging.
Mortality
Standard Cause of Death Ensemble modelling
(CODEm) meth ods were used to estimate cause-specific
mort ality.
7The International Classification of Diseases
(ICD) 9 and 10 codes that we used are listed in the
appendix. For overall stroke, we included verbal autopsy
data in addition to vital registration data; for the stroke
type models, we used vital registration data only because
accurate assessment of stroke type requires imaging
1990 to 2016. Other sources of population-level estimates
include reports from WHO and independent scientific
publications of global or regional estimates of deaths or
incidence. GBD is the only peer-reviewed, comprehensive
assessment of stroke by age, sex, and location that is updated
annually. This study quantifies stroke burden in terms of
incidence, prevalence, deaths, years lived with disability, years
of life lost, and disability-adjusted life-years, updating the
estimates previously presented in the GBD 2013 and GBD 2015
studies to include results through 2016. The results presented
here are also the source data for the recently published
estimates of the lifetime risk of stroke.
Added value of this study
There were several important updates to this iteration of GBD,
enabling generation of improved estimates. First, we developed
new approaches for our inpatient hospital data processing,
which allowed us to include data for several locations that had
previously been excluded because of insufficient information
about the catchment population. Second, we extended the
terminal age group of 80 years and older into 80–84 years,
85–89 years, 90–94 years, and 95 years and older. We updated
stroke prevalence, incidence, and mortality. We also performed
a literature review to inform the models used to generate
severity information (search terms “stroke”, “cerebral
infarction”, “cerebral hemorrhage”, or “subarachnoid
hemorrhage” combined with “Rankin”). Furthermore, we
generated expected values for all measures on the basis of
sociodemographic development, allowing us to visualise
comparisons between observed GBD results and these
expected values.
Implications of all the available evidence
The findings presented in this manuscript provide crucial
information that could serve as the basis for resource allocation
for stroke prevention, evidence-based planning for acute stroke
care, and stroke rehabilitation facilities. Additionally, we provide
evidence that most of the burden of stroke can be attributed to
modifiable risk factors and identified risk clusters that can be
targeted to reduce the incidence of stroke. Because stroke has
been identified as one of the priority areas for WHO and the UN
in their actions to reduce the burden of non-communicable
diseases, global estimates such as those generated by GBD are
essential for appropriately targeting such efforts.
See Online for appendix For the GBD 2016 Data Input Sources Tool see http://ghdx. healthdata.org/gbd-2016/data-input-sources
Global 5 528 232 (5 334 609 to 5 734 681) –36·2% (–39·3 to –33·6) 13 676 761 (12 713 488 to 14 692 386) –8·1% (–10·7 to –5·5) 116 445 136 (111 385 357 to 121 406 862) –34·2% (–37·2 to –31·5) High SDI 721 049 (674 368 to 770 105) (–53·5 to –50·4)–51·9% (2 325 267 to 2 672 119)2 496 143 (–22·8 to –17·8)–20·3% (10 474 984 to 12 313 359)11 428 239 –49·3% (–51·4 to –47·5) High-middle SDI 1 082 392 (989 070 to 1 191 869) –44·7% (–49·3 to –39·2) (2 966 203 to 3 470 057)3 218 009 (–19·1 to –12·5)–15·9% (19 041 515 to 22 862 878)20 886 507 (–46·7 to –37·1)–42·3% Middle SDI 2 229 002 (2 156 876 to 2 302 482) –38·2% (–43·5 to –34·3) (5 006 115 to 5 782 067)5 394 853 (–2·6 to 3·0)0·3% (46 534 278 to 50 601 668)48 552 584 (–42·1 to –33·6)–37·3% Low-middle SDI 1 181 709 (1 124 199 to 1 234 945) (–28·4 to –16·9)–22·7% (1 900 903 to 2 221 193)2 062 294 (–5·1 to –0·4)–2·8% (26 339 529 to 28 769 222)27 582 829 (–29·5 to –19·4)–24·6% Low SDI 311 001 (290 881 to 331 322) (–25·9 to –14·0)–20·8% (408 264 to 481 496)445 405 (–10·6 to –5·4)–8·0% (7 409 345 to 8 335 178)7 886 374 (–27·8 to –17·0)–23·2% High-income North America (185 354 to 206 778)195 661 –21·1% (–24·0 to –18·3) (756 263 to 873 750)812 285 –14·0% (–16·5 to –11·4) (3 161 432 to 3 716 553)3 451 975 –21·8% (–24·6 to –19·3) Canada 18 433 (16 889 to 20 236) –38·3% (–43·3 to –32·8) (73 776 to 88 270)80 683 (–21·7 to –12·6)–17·2% (254 406 to 318 530)288 427 (–41·5 to –32·9)–37·2% Greenland 33 (26 to 42) (–62·7 to –46·7)–55·3% (78 to 96)87 (–36·8 to –29·5)–33·4% (614 to 933)758 (–61·1 to –43·7)–53·2% USA 177 196 (167 723 to 187 486) (–22·2 to –16·0)–19·1% (680 564 to 785 696)731 256 (–16·2 to –10·9)–13·6% (2 900 887 to 3 404 445)3 162 485 (–22·9 to –17·4)–20·1% Australasia 16 070 (14 600 to 17 490) –48·7% (–52·7 to –44·6) (43 598 to 50 167)46 733 –23·5% (–26·8 to –20·0) (187 319 to 225 047)206 799 –51·1% (–54·4 to –47·9) Australia 13 480 (12 092 to 14 832) –49·3% (–53·9 to –44·5) (34 266 to 40 137)37 091 (–31·0 to –23·5)–27·5% (153 916 to 186 120)170 962 (–55·0 to –47·6)–51·2% New Zealand 2589 (2292 to 2924) –46·1% (–52·0 to –40·0) (8923 to 10 183)9642 (–9·8 to 2·9)–3·0% (32 033 to 39 969)35 837 (–54·6 to –45·2)–50·2% High-income Asia Pacific (146 873 to 174 157)160 610 –66·3% (–68·8 to –63·4) (414 801 to 483 777)448 853 –33·1% (–35·5 to –30·4) (2 245 941 to 2 724 866)2 489 972 –61·5% (–64·9 to –58·1) Brunei 131 (110 to 150) –40·9% (–49·1 to –32·1) (356 to 427)393 (–30·4 to –23·4)–26·8% (2882 to 4016)3443 (–51·1 to –34·1)–42·9% Japan 122 032 (112 574 to 131 181) –64·2% (–65·8 to –62·5) (326 496 to 381 049)353 551 (–31·2 to –25·8)–28·6% (1 636 262 to 1 947 883)1 797 708 (–58·0 to –53·8)–55·9% Singapore 1162 (951 to 1400) (–79·1 to –68·3)–74·3% (5399 to 6473)5915 (–41·1 to –34·2)–37·8% (22 845 to 31 866)27 116 –68·2% (–73·3 to –62·4) South Korea 37 285 (28 773 to 46 655) (–80·1 to –65·8)–73·8% (81 334 to 97 072)88 993 –49·6% (–52·9 to –46·1) (527 331 to 810 431)661 705 (–80·0 to –67·7)–74·5% Western Europe 310 011 (284 276 to 339 482) –58·4% (–60·4 to –56·2) (964 975 to 1 108 323)1 036 438 –22·7% (–25·6 to –19·8) (3 952 234 to 4 707 683)4 350 012 –56·4% (–58·6 to –54·4) Andorra 48 (39 to 59) (–54·8 to –25·7)–41·8% (172 to 206)188 (–19·4 to –12·0)–15·7% (580 to 829)700 (–47·5 to –22·0)–35·9% Austria 3888 (3361 to 4500) (–77·2 to –72·2)–74·9% (21 898 to 25 595)23 698 (–32·4 to –23·8)–28·3% (59 863 to 77 120)68 833 (–70·2 to –64·0)–67·1% Belgium 7825 (6806 to 8886) (–60·2 to –50·0)–55·1% (25 721 to 30 517)28 085 (–22·4 to –11·1)–17·3% (103 430 to 130 062)116 340 (–56·3 to –46·8)–51·5% Cyprus 500 (439 to 562) –60·0% (–65·8 to –53·2) (1459 to 1701)1573 (–31·1 to –24·1)–27·7% (6731 to 8290)7522 –56·8% (–62·5 to –51·1) Denmark 4013 (3538 to 4533) –46·4% (–53·0 to –39·1) (11 542 to 13 642)12 540 (–28·2 to –20·1)–24·3% (53 417 to 67 325)60 016 –49·2% (–54·9 to –43·3) Finland 5130 (4430 to 5912) (–58·6 to –47·7)–53·5% (15 988 to 18 989)17 429 (–22·9 to –12·7)–18·0% (66 486 to 84 678)75 047 (–58·7 to –50·1)–54·5% France 38 557 (34 514 to 43 256) (–59·6 to –52·3)–55·9% (121 049 to 142 111)131 416 (–25·6 to –16·7)–21·2% (491 599 to 601 426)548 745 (–54·3 to –47·1)–50·7% Germany 57 717 (50 943 to 65 847) –62·3% (–66·3 to –57·4) (221 808 to 265 229)242 497 (–20·4 to –7·6)–14·4% (817 905 to 1 028 186)926 146 (–61·6 to –53·6)–57·8%
Greece 15 891 (14 179 to 17 757) (–58·9 to –50·3)–54·7% (31 480 to 36 859)34 149 (–31·5 to –23·2)–27·5% (181 556 to 220 325)200 543 (–55·4 to –47·7)–51·6% Iceland 163 (143 to 184) (–48·9 to –36·5)–42·8% (556 to 656)603 (–20·5 to –11·4)–16·0% (2051 to 2610)2342 –46·2% (–51·1 to –41·2) Ireland 1915 (1654 to 2181) –60·8% (–65·8 to –55·0) (6854 to 8100)7462 (–34·3 to –26·5)–30·4% (27 546 to 35 902)31 653 (–63·2 to –53·5)–58·4% Israel 2740 (2318 to 3226) (–69·8 to –56·1)–63·4% (10 473 to 12 351)11 390 (–34·7 to –27·0)–31·0% (38 699 to 52 316)45 122 –60·9% (–67·1 to –54·4) Italy 52 327 (45 538 to 60 768) (–62·2 to –53·1)–57·9% (158 060 to 172 946)166 015 (–25·8 to –18·3)–22·2% (574 753 to 712 130)641 405 (–62·3 to –55·1)–58·7% Luxembourg 334 (294 to 377) –69·0% (–72·5 to –65·2) (1007 to 1142)1074 (–40·9 to –34·2)–37·7% (4407 to 5514)4966 –66·7% (–70·0 to –63·1) Malta 250 (212 to 293) –60·5% (–66·7 to –53·1) (819 to 968)892 (–34·4 to –26·7)–30·7% (3517 to 4722)4105 (–64·7 to –52·9)–59·2% Netherlands 11 132 (9950 to 12 434) (–47·0 to –34·6)–41·4% (32 575 to 38 469)35 385 (–21·1 to –11·4)–16·4% (145 787 to 178 649)162 107 (–47·7 to –37·8)–42·9% Norway 2947 (2560 to 3353) (–63·4 to –52·7)–58·2% (11 292 to 13 321)12 254 (–23·3 to –13·7)–18·6% (37 977 to 48 478)43 207 (–59·2 to –50·0)–54·6% Portugal 14 112 (12 858 to 15 478) –69·6% (–71·9 to –67·1) (25 466 to 29 628)27 447 (–53·5 to –48·3)–51·0% (171 638 to 202 338)187 018 –68·8% (–71·2 to –66·4) Spain 29 646 (26 209 to 33 330) –64·3% (–67·7 to –61·1) (93 604 to 110 539)101 845 (–34·8 to –26·9)–31·0% (348 750 to 425 747)389 291 (–65·3 to –59·5)–62·3% Sweden 7810 (6755 to 8965) (–47·0 to –32·2)–39·8% (22 713 to 27 014)24 807 (–16·0 to –6·6)–11·5% (90 822 to 115 994)103 126 (–47·9 to –36·3)–42·3% Switzerland 4439 (3482 to 5643) (–69·7 to –52·8)–61·9% (18 156 to 21 319)19 766 (–18·3 to –6·0)–13·0% (51 656 to 75 635)63 410 (–63·6 to –49·4)–56·9% UK 48 628 (45 348 to 51 909) (–54·3 to –50·9)–52·6% (125 162 to 145 532)134 979 (–29·4 to –24·2)–26·9% (615 643 to 717 146)667 392 (–54·7 to –50·9)–52·7% Southern Latin America (32 341 to 38 404)35 357 –53·2% (–57·0 to –48·8) (87 970 to 102 544)95 250 –33·3% (–36·4 to –29·7) (607 737 to 724 526)666 622 –54·1% (–57·7 to –50·0) Argentina 22 010 (20 003 to 23 935) (–58·5 to –50·1)–54·5% (55 163 to 64 328)59 608 (–39·1 to –31·3)–35·4% (395 748 to 470 803)434 748 (–59·0 to –51·0)–55·2% Chile 9869 (7957 to 12 096) (–61·5 to –40·6)–51·9% (26 063 to 30 948)28 412 (–33·1 to –24·2)–28·9% (146 291 to 216 151)179 122 (–61·9 to –43·5)–53·1% Uruguay 3478 (3210 to 3758) (–49·4 to –40·6)–45·3% (6650 to 7831)7223 (–33·3 to –25·6)–29·5% (48 724 to 56 787)52 744 –46·3% (–50·0 to –41·9) Eastern Europe 461 418 (377 592 to 561 768) (–41·4 to –13·2)–29·0% (866 533 to 1 055 913)962 562 (–20·3 to –9·8)–15·3% (6 888 360 to 9 951 417)8 235 892 (–37·5 to –9·5)–24·8% Belarus 14 437 (12 228 to 16 700) (–38·0 to –15·3)–26·8% (34 401 to 41 493)37 939 (–19·0 to –7·9)–13·8% (241 304 to 321 826)281 651 (–37·4 to –16·4)–26·9% Estonia 1200 (978 to 1471) (–78·9 to –68·1)–74·3% (4158 to 5073)4610 (–41·6 to –32·5)–37·3% (19 458 to 27 383)23 179 –68·5% (–73·0 to –63·0) Latvia 4512 (3962 to 5102) –46·8% (–53·0 to –39·3) (10 842 to 13 537)12 188 (–22·7 to –7·6)–16·0% (64 510 to 82 141)73 098 (–49·8 to –36·6)–43·7% Lithuania 4435 (4018 to 4859) (–27·6 to –12·4)–20·3% (13 648 to 16 300)15 035 (–7·3 to 5·0)–1·3% (69 927 to 84 557)77 217 (–30·3 to –17·3)–24·1% Moldova 5590 4995 to 6235) (–41·8 to –25·2)–34·0% (11 830 to 13 966)12 925 (–21·6 to –12·5)–17·2% (106 888 to 132 707)119 356 (–37·8 to –20·4)–29·6% Russia 345 861 (267 315 to 444 861) (–43·5 to –4·8)–26·5% (607 894 to 746 828)676 846 (–20·4 to –8·3)–14·6% (4 773 920 to 7 736 480)6 082 727 (–39·4 to –0·5)–22·4% Ukraine 85 383 (69 613 to 105 349) (–49·4 to –23·4)–37·8% (183 022 to 223 100)203 018 (–24·5 to –13·0)–19·0% (1 313 971 to 1 902 057)1 578 664 (–43·1 to –16·7)–31·4% (Table continues on next page)
Central Europe 177 467 (166 446 to 191 258) –43·8% (–46·6 to –40·7) (432 780 to 499 536)467 197 –14·9% (–18·6 to –11·1) (2 770 447 to 3 170 163)2 970 660 –44·4% (–47·0 to –41·6) Albania 4751 (4108 to 5374) (–20·7 to 3·1)–8·7% (7768 to 9130)8436 (–4·2 to 5·5)0·5% (63 986 to 82 726)73 918 (–23·3 to –3·1)–12·9% Bosnia and Herzegovina (5608 to 7434)6446 (–47·8 to –26·4)–37·9% (15 103 to 18 272)16 687 (–7·5 to 3·7)–1·8% (98 480 to 127 965)112 114 (–46·4 to –26·6)–37·2% Bulgaria 20 458 (17 924 to 23 249) –34·4% (–43·3 to –24·6) (34 899 to 41 894)38 368 (–19·9 to –9·7)–14·8% (287 167 to 369 674)327 622 (–44·7 to –27·8)–36·5% Croatia 7585 (6608 to 8547) –43·2% (–51·1 to –35·0) (19 234 to 21 532)20 469 (–15·8 to –4·3)–10·4% (105 388 to 132 189)118 848 –46·5% (–53·1 to –39·4) Czech Republic 10 169 (9355 to 11 037) (–73·0 to –67·8)–70·6% (35 267 to 42 806)38 959 (–34·7 to –24·3)–30·0% (149 489 to 181 357)165 197 –68·5% (–71·1 to –65·6) Hungary 13 188 (11 698 to 14 703) (–60·9 to –50·3)–55·8% (36 296 to 43 822)40 003 (–30·7 to –20·8)–26·0% (207 864 to 257 571)232 778 (–59·6 to –50·1)–55·0% Macedonia 4596 (4085 to 5567) (–29·4 to –14·9)–22·2% (7377 to 8881)8147 (–19·9 to –10·2)–15·0% (72 394 to 91 380)79 720 –26·0% (–32·2 to –19·6) Montenegro 1500 (1319 to 1662) (–24·0 to 1·4)–12·1% (2162 to 2556)2346 (–10·3 to –1·8)–6·1% (20 482 to 25 575)23 140 (–29·4 to –8·5)–19·5% Poland 35 815 (31 974 to 40 055) –49·1% (–54·4 to –43·4) (113 864 to 132 877)124 540 (–13·8 to 0·2)–7·4% (585 572 to 720 870)653 330 (–52·5 to –42·4)–47·9% Romania 49 042 (44 527 to 54 190) (–33·8 to –19·6)–27·0% (93 806 to 112 993)103 102 (–17·4 to –3·8)–11·3% (704 821 to 853 437)776 798 (–36·7 to –24·1)–30·6% Serbia 17 092 (14 972 to 20 989) –34·5% (–42·1 to –26·2) (37 480 to 41 089)39 375 (–20·1 to –8·7)–14·6% (254 852 to 329 446)284 448 (–43·1 to –29·5)–36·7% Slovakia 5056 (4456 to 5673) –49·5% (–56·2 to –42·4) (18 662 to 22 686)20 560 (–10·5 to 3·7)–4·0% (83 904 to 106 547)95 249 –48·3% (–54·6 to –41·6) Slovenia 1767 (1497 to 2079) –68·1% (–72·7 to –63·2) (5829 to 6591)6204 (–38·0 to –30·5)–34·3% (23 813 to 31 113)27 499 –66·5% (–71·0 to –62·0) Central Asia 73 150 (68 710 to 78 547) –25·6% (–29·9 to –20·7) (131 302 to 151 650)141 713 –14·1% (–17·0 to –10·9) (1 500 356 to 1 725 247)1 606 521 –24·0% (–28·1 to –19·3) Armenia 2355 (2097 to 2615) –48·6% (–54·5 to –42·4) (6073 to 7203)6639 (–24·9 to –16·1)–20·5% (40 282 to 49 428)45 047 –44·8% (–50·3 to –38·9) Azerbaijan 8022 (6726 to 9484) (–34·8 to –8·4)–22·4% (15 765 to 18 656)17 221 (–7·3 to 2·1)–3·0% (145 438 to 200 888)171 457 (–35·8 to –9·6)–23·2% Georgia 8978 (7770 to 10 276) (–38·5 to –15·4)–27·4% (13 415 to 15 012)14 229 (–15·4 to –6·0)–10·9% (126 819 to 168 149)146 412 (–40·1 to –18·2)–29·7% Kazakhstan 17 699 (15 216 to 20 895) (–36·4 to –11·6)–25·6% (32 918 to 38 755)35 801 (–19·7 to –9·8)–15·2% (335 807 to 458 020)389 587 (–34·7 to –10·1)–24·2% Kyrgyzstan 4588 (4180 to 5023) (–41·6 to –29·3)–35·6% (7483 to 8759)8113 (–28·4 to –20·4)–24·6% (97 607 to 117 291)107 238 (–36·6 to –23·7)–30·4% Mongolia 3338 (2918 to 3785) (32·8 to 84·7)55·7% (4161 to 4837)4495 (17·5 to 27·1)22·3% (77 373 to 102 783)89 526 (22·5 to 70·7)44·3% Tajikistan 4801 (4214 to 5562) (–21·7 to 4·4)–10·3% (8109 to 9465)8791 (–15·0 to –6·3)–10·7% (89 879 to 120 358)102 986 (–26·2 to –0·9)–15·0% Turkmenistan 4145 (3843 to 4436) (–19·0 to –4·9)–12·3% (6306 to 7389)6850 (–4·3 to 4·3)–0·2% (101 370 to 116 400)108 988 (–17·8 to –4·2)–11·3% Uzbekistan 19 223 (16 854 to 22 305) (–34·7 to –16·4)–25·5% (36 333 to 42 740)39 574 (–19·2 to –11·0)–15·0% (390 470 to 516 727)445 281 (–33·6 to –15·2)–24·2% Central Latin America (56 477 to 64 599)60 687 –42·6% (–45·9 to –39·4) (191 977 to 227 671)210 120 –13·5% (–16·6 to –10·2) (1 292 563 to 1 445 939)1 370 692 –43·2% (–46·1 to –40·2) Colombia 11 830 (10 388 to 13 213) –54·4% (–60·0 to –48·6) (38 454 to 46 181)42 277 (–29·0 to –21·1)–25·4% (221 520 to 275 392)249 664 (–63·2 to –53·2)–58·1% (Table continues on next page)
Costa Rica 989 (878 to 1120) (–56·9 to –47·0)–52·2% (4273 to 5151)4696 (–18·1 to –8·6)–13·7% (18 023 to 22 104)19 996 (–51·9 to –42·1)–47·2% El Salvador 1330 (1167 to 1510) (–71·3 to –62·6)–67·1% (4639 to 5561)5109 (–29·2 to –20·6)–25·3% (26 459 to 33 305)29 566 –68·8% (–72·4 to –64·6) Guatemala 3397 (2694 to 4177) (–37·1 to –1·0)–20·5% (9154 to 10 863)10 008 (–7·7 to 2·8)–2·7% (69 883 to 107 167)87 714 (–41·8 to –8·1)–26·6% Honduras 2698 (2167 to 3373) (–52·3 to –21·9)–39·3% (5790 to 6813)6283 (–17·0 to –8·2)–12·7% (66 609 to 99 797)81 325 (–57·9 to –32·4)–47·5% Mexico 27 738 (25 840 to 29 530) (–39·5 to –33·6)–36·4% (95 902 to 113 520)104 877 (–9·5 to –3·1)–6·5% (592 408 to 657 379)626 689 (–37·2 to –31·5)–34·3% Nicaragua 1333 (1134 to 1564) (–47·2 to –26·9)–37·8% (4242 to 5066)4641 –15·5 to –6·8)–11·4% (24 433 to 32 957)28 456 (–48·8 to –29·9)–40·0% Panama 1448 (1271 to 1635) (–54·3 to –39·2)–47·1% (3678 to 4316)3996 (–28·2 to –20·8)–24·5% (23 720 to 30 390)26 905 –46·8% (–54·0 to –38·8) Venezuela 9922 (8452 to 11 653) (–48·7 to –28·2)–39·4% (25 871 to 30 579)28 233 (–22·3 to –13·4)–18·1% (188 959 to 259 518)220 376 (–48·6 to –28·4)–39·5% Andean Latin America (12 682 to 15 704)14 122 –54·9% (–59·9 to –49·3) (45 817 to 54 162)49 970 –20·5% (–23·9 to –16·7) (298 765 to 369 404)330 016 –57·1% (–61·9 to –51·6) Bolivia 4214 (3423 to 5168) –49·6% (–59·3 to –37·2) (9482 to 11 278)10 349 (–22·0 to –13·8)–18·2% (78 381 to 119 222)96 482 (–62·7 to –41·8)–53·5% Ecuador 4035 (3681 to 4440) –49·3% (–54·0 to –43·9) (12 170 to 14 431)13 309 (–25·8 to –17·2)–21·6% (84 922 to 101 568)93 289 (–56·5 to –47·2)–52·0% Peru 5873 (4904 to 7017) –60·8% (–68·2 to –51·4) (24 013 to 28 662)26 312 (–25·1 to –16·3)–21·0% (117 392 to 167 236)140 244 (–68·5 to –52·6)–61·6% Caribbean 33 297 (30 836 to 35 833) –28·3% (–33·3 to –23·0) (58 850 to 68 445)63 459 –15·6% (–18·5 to –12·4) (599 695 to 720 059)659 354 –34·9% (–40·6 to –29·2) Antigua and Barbuda (40 to 52)46 (–58·0 to –44·4)–51·6% (101 to 119)110 (–30·7 to –23·0)–27·0% (819 to 1043)930 (–56·6 to –43·2)–50·3% The Bahamas 246 (210 to 277) (–35·8 to –17·9)–26·9% (475 to 558)515 (–19·8 to –11·6)–15·6% (4404 to 5630)5048 (–38·3 to –22·9)–30·8% Barbados 272 (245 to 299) (–49·0 to –36·4)–42·8% (509 to 598)553 (–27·0 to –18·7)–22·9% (4020 to 4873)4429 (–46·4 to –33·7)–40·6% Belize 118 (102 to 134) (–19·2 to 7·9)–6·1% (234 to 276)255 (–11·3 to –3·0)–7·1% (2330 to 3017)2662 (–27·3 to –3·3)–15·7% Bermuda 31 (26 to 35) –60·6% (–66·2 to –54·1) (74 to 88)81 (–38·5 to –31·4)–35·2% (453 to 587)516 (–68·1 to –57·2)–62·9% Cuba 9684 (8801 to 10 585) (–30·5 to –15·0)–23·0% (19 729 to 23 177)21 416 (–17·4 to –8·9)–13·3% (147 535 to 175 492)161 026 (–37·1 to –24·0)–30·6% Dominica 50 (43 to 58) (–38·9 to –16·1)–28·3% (90 to 105)97 (–17·3 to –8·1)–13·1% (769 to 1007)883 (–36·6 to –14·6)–26·8% Dominican Republic 5395 (4588 to 6191) (–41·5 to –20·0)–30·7% (10 440 to 12 334)11 365 (–20·5 to –11·2)–16·1% (86 334 to 116 349)101 780 (–47·0 to –27·7)–37·4% Grenada 92 (81 to 104) (–41·1 to –21·4)–31·3% (131 to 152)141 (–22·8 to –14·5)–18·8% (1474 to 1914)1686 (–42·7 to –22·0)–32·5% Guyana 688 (608 to 766) (–46·6 to –31·3)–38·9% (877 to 1032)953 (–30·1 to –23·2)–26·7% (14 631 to 18 448)16 562 (–52·0 to –38·5)–45·2% Haiti 9944 (7864 to 12 110) (–43·4 to –18·1)–31·4% (10 111 to 11 846)10 982 (–26·5 to –19·2)–23·0% (193 785 to 303 079)246 846 (–49·6 to –24·9)–38·3% Jamaica 3021 (2599 to 3462) (–30·6 to –1·6)–17·4% (4222 to 4945)4568 (–18·6 to –9·9)–14·1% (41 181 to 55 041)48 039 (–38·3 to –13·3)–26·7% Puerto Rico 1917 (1711 to 2135) (–26·9 to –8·3)–18·0% (5392 to 6391)5869 (–4·7 to 5·2)0·1% (27 904 to 34 054)30 944 (–29·7 to –13·8)–22·1% Saint Lucia 124 (111 to 134) –48·6% (–53·5 to –43·9) (233 to 271)252 (–29·7 to –22·6)–26·3% (2130 to 2516)2331 (–52·7 to –43·3)–47·9% (Table continues on next page)
Saint Vincent and
the Grenadines (81 to 100)91 (–25·4 to –6·3)–16·2% (138 to 161)150 (–14·0 to –5·3)–10·1% (1601 to 1934)1774 (–27·0 to –9·2)–18·5%
Suriname 482
437 to 526) –9·3 to 9·8)–0·2% (717 to 833)775 (–12·1 to –3·6)–7·9% (9183 to 10 953)10 079 (–17·4 to –0·4)–9·4% Trinidad and Tobago 1002
916 to 1097) –43·7% –48·9 to –38·1) (1949 to 2284)2117 (–30·4 to –23·2)–26·7% (18 222 to 21 809)19 968 (–50·0 to –40·0)–45·4% Virgin Islands 95 (83 to 107) (–35·4 to –13·2)–25·2% (206 to 245)224 (–12·3 to –3·6)–8·2% (1464 to 1886)1675 (–39·2 to –19·0)–29·8% Tropical Latin America (105 139 to 116 401)111 098 –55·5% (–57·3 to –53·8) (243 959 to 285 940)264 861 –30·8% (–33·2 to –28·3) (2 188 842 to 2 413 612)2 306 945 –56·5% (–58·2 to –54·9) Brazil 107 656 (101 751 to 113 029) –56·2% (–58·0 to –54·4) (237 631 to 278 470)258 021 (–33·7 to –28·7)–31·2% (2 122 674 to 2 341 269)2 236 740 (–58·8 to –55·5)–57·2% Paraguay 3442 (3005 to 3897) (–32·0 to –10·5)–21·9% (6301 to 7366)6840 (–15·0 to –6·8)–11·1% (62 424 to 78 686)70 204 (–31·9 to –11·2)–22·6% East Asia 1 848 933 (1 782 311 to 1 917 491) –42·3% (–48·5 to –38·3) (5 226 581 to 6 008 490)5 619 517 4·9% (1·3 to 8·1) (37 820 465 to 41 958 598)39 931 397 –41·0% (–46·5 to –36·9) China 1 790 033 (1 725 729 to 1 857 796) –42·6% (–48·9 to –38·3) (5 123 307 to 5 891 047)5 510 276 (1·7 to 8·7)5·4% (36 559 198 to 40 646 436)38 623 565 (–47·0 to –37·3)–41·5% North Korea 46 224 (40 908 to 51 736) (8·2 to 46·2)25·7% (59 359 to 68 754)64 094 (5·9 to 15·1)10·3% (909 221 to 1 130 202)1 021 113 (10·3 to 46·1)26·7% Taiwan (province of China) (10 878 to 14 526)12 675 –69·9% (–74·2 to –65·4) (41 139 to 49 211)45 147 (–35·1 to –27·8)–31·7% (246 488 to 326 346)286 720 (–67·7 to –58·8)–63·3% Southeast Asia 504 522 (481 493 to 529 723) –22·0% (–27·5 to –15·0) (747 194 to 871 724)811 510 –7·1% (–9·4 to –4·5) (11 134 566 to 12 283 903)11 693 267 –20·1% (–25·1 to –14·2) Cambodia 11 791 (10 749 to 12 889) –24·4% (–35·8 to –5·8) (13 484 to 15 730)14 604 (–16·2 to –9·0)–13·0% (249 972 to 301 718)275 137 (–38·8 to –12·8)–28·4% Indonesia 212 963 (200 341 to 227 120) (–4·3 to 20·3)6·3% (306 106 to 360 209)334 295 (6·2 to 11·6)8·8% (4 890 704 to 5 488 841)5 175 449 (–2·4 to 16·8)6·0% Laos 4834 (4194 to 5378) (–36·8 to –14·1)–27·6% (5756 to 6732)6242 (–16·6 to –9·6)–13·1% (109 568 to 138 953)125 305 (–40·8 to –21·3)–32·2% Malaysia 14 302 (13 076 to 15 506) –46·0% (–51·4 to –39·9) (30 741 to 36 542)33 628 (–20·2 to –13·1)–16·8% (307 813 to 367 078)337 935 –46·5% (–51·5 to –41·2) Maldives 83 (67 to 102) –65·3% (–72·9 to –55·7) (256 to 310)283 (–28·9 to –21·0)–25·1% (1601 to 2343)1940 –66·2% (–74·2 to –57·3) Mauritius 820 (715 to 930) –63·6% (–68·2 to –58·7) (1674 to 1991)1838 (–38·8 to –32·1)–35·6% (15 761 to 20 312)17 939 –62·4% (–66·9 to –57·5) Myanmar 41 374 (37 280 to 46 280) –36·8% (–45·7 to –26·2) (58 671 to 69 263)64 242 (–20·3 to –13·2)–16·9% (856 417 to 1 076 497)953 822 (–47·1 to –29·1)–38·9% Philippines 67 163 (58 684 to 76 412) (–0·2 to 30·9)14·1% (92 259 to 108 067)100 293 (9·8 to 20·7)15·0% (1 507 201 to 1 962 345)1 726 655 (1·1 to 32·5)15·7% Sri Lanka 11 010 (8982 to 13 339) (–48·3 to –21·4)–35·9% (25 024 to 29 855)27 450 (–12·6 to –3·8)–8·3% (183 518 to 264 238)221 114 (–41·2 to –13·3)–28·3% Seychelles 47 (41 to 54) (–46·5 to –28·0)–37·7% (112 to 133)123 (–14·1 to –5·7)–10·1% (965 to 1276)1109 (–47·2 to –28·0)–38·0% Thailand 36 819 (33 056 to 41 334) (–57·1 to –45·4)–51·5% (89 733 to 107 097)98 499 (–21·9 to –14·2)–18·3% (773 422 to 982 234)874 535 (–53·6 to –40·9)–47·3% Timor-Leste 570 (447 to 718) (–47·8 to –5·2)–32·2% (879 to 1052)965 (–11·6 to –3·8)–7·9% (10 095 to 16 518)13 083 (–52·1 to –13·9)–36·9% Vietnam 102 745 (92 847 to 113 544) (–43·2 to –19·7)–33·0% (118 570 to 136 677)127 433 (–24·4 to –17·8)–21·1% (1 755 905 to 2 225 169)1 967 359 (–44·9 to –21·4)–34·6% Oceania 8675 (7362 to 10 038) –19·8% (–29·9 to –7·4) (11 607 to 13 480)12 562 –8·1% (–11·0 to –5·2) (230 796 to 319 285)272 605 –18·6% (–30·0 to –5·3)
American Samoa 27 (23 to 32) (–43·7 to –20·3)–33·3% (69 to 82)76 (–16·0 to –8·2)–12·4% (700 to 973)831 (–43·6 to –21·0)–33·3% Federated States of Micronesia (79 to 125)100 (–34·7 to 3·7)–17·5% (113 to 133)123 (–12·6 to –4·5)–8·9% (2025 to 3265)2572 (–36·6 to 5·1)–17·6% Fiji 569 (449 to 710) (–40·0 to 3·4)–21·3% (1069 to 1280)1176 (–10·8 to –2·2)–6·5% (12 384 to 19 147)15 533 (–39·5 to 4·1)–21·1% Guam 121 (107 to 138) (–22·6 to 6·7)–9·0% (271 to 320)294 (–2·7 to 6·5)1·6% (2550 to 3304)2903 (–19·4 to 9·1)–6·4% Kiribati 113 (99 to 128) (–25·3 to –0·7)–14·0% (128 to 150)139 (–12·5 to –4·7)–8·7% (2994 to 3937)3442 (–25·5 to 1·3)–13·3% Marshall Islands 42 (35 to 50) (–30·6 to –4·4)–18·6% (63 to 74)69 (–9·5 to –1·1)–5·4% (1097 to 1543)1312 (–29·3 to –1·6)–16·6% Northern Mariana Islands (20 to 31)25 (–49·5 to –20·3)–36·7% (72 to 89)80 (–17·9 to –10·6)–14·5% (727 to 1103)905 (–47·7 to –18·0)–34·4% Papua New Guinea 6620
(5320 to 7980) (–31·3 to –0·3)–18·1% (7271 to 8436)7867 (–12·1 to –4·8)–8·5% (172 917 to 260 821)214 129 (–33·7 to –2·0)–19·8% Samoa 136 (112 to 159) (–40·8 to –16·6)–29·0% (217 to 253)234 (–15·6 to –7·9)–11·9% (2588 to 3696)3132 (–41·4 to –17·1)–29·7% Solomon Islands 578 (481 to 703) (–26·3 to 3·4)–13·1% (577 to 671)625 (–12·2 to –4·8)–8·7% (13 771 to 20 527)16 739 (–27·9 to 7·3)–13·1% Tonga 57 (50 to 65) (–35·5 to –5·1)–21·8% (106 to 124)115 (–8·7 to –1·2)–4·9% (1087 to 1436)1257 (–35·6 to –6·3)–22·0% Vanuatu 287 (233 to 351) (–28·0 to 3·5)–13·4% (318 to 371)345 (–15·4 to –7·4)–11·5% (6663 to 10 200)8226 (–28·8 to 5·9)–13·2%
North Africa and
Middle East (219 467 to 259 910)238 747 (–29·3 to –15·9)–23·8% (535 384 to 637 793)586 080 –6·0% (–9·0 to –2·9) (5 205 166 to 6 152 964)5 655 638 –26·8% (–31·3 to –20·8) Afghanistan 23 132 (18 798 to 27 674) (–9·7 to 18·1)1·9% (24 921 to 29 329)27 042 (–7·5 to 1·3)–3·3% (528 442 to 797 591)650 879 (–14·0 to 12·8)–1·8% Algeria 16 682 (14 193 to 19 374) (–39·5 to –21·4)–31·2% (40 627 to 48 799)44 590 (–17·2 to –8·3)–12·9% (288 218 to 383 258)332 855 (–44·6 to –28·7)–37·4% Bahrain 139 (114 to 169) (–61·9 to –42·3)–53·1% (834 to 1041)937 (–21·0 to –12·3)–16·7% (3538 to 5059)4213 (–61·9 to –44·5)–54·1% Egypt 52 093 (44 633 to 60 475) (–36·8 to –13·3)–26·9% (98 437 to 117 547)107 854 (–6·2 to 4·3)–1·2% (1 027 522 to 1 387 332)1 193 756 (–34·1 to –11·9)–24·2% Iran 28 786 (24 530 to 33 892) (–42·4 to –9·8)–28·2% (74 457 to 90 102)82 516 (–20·0 to –11·3)–15·8% (529 942 to 723 486)621 007 (–43·9 to –13·5)–30·8% Iraq 17 080 (14 064 to 20 294) (–32·9 to 2·3)–16·4% (30 583 to 36 358)33 390 (–13·0 to –3·3)–8·8% (377 396 to 551 247)457 517 (–35·1 to 0·9)–18·2% Jordan 1991 (1573 to 2518) (–54·6 to –26·8)–42·1% (5729 to 6895)6302 (–22·9 to –12·9)–18·0% (34 918 to 53 263)42 916 –44·2% (–56·2 to –29·7) Kuwait 445 (335 to 580) (–16·1 to 46·1)11·7% (2361 to 2952)2655 (8·2 to 21·8)14·8% (11 318 to 18 114)14 354 (–16·9 to 31·6)5·5% Lebanon 1174 (895 to 1543) –68·1% (–76·7 to –55·9) (6098 to 7450)6745 (–23·8 to –14·2)–19·1% (20 765 to 31 702)25 835 –68·5% (–75·8 to –59·0) Libya 1914 (1582 to 2353) (–25·6 to 1·5)–12·7% (5890 to 7122)6526 (2·5 to 13·7)7·8% (40 901 to 58 338)48 552 (–41·4 to –14·3)–28·0% Morocco 15 730 (12 655 to 19 431) (–36·3 to –6·1)–25·4% (38 974 to 46 792)42 777 (–8·4 to 0·5)–4·1% (269 767 to 398 089)328 748 (–39·5 to –17·6)–30·9% Oman 755 (670 to 839) –46·4% (–57·9 to –33·3) (2750 to 3363)3049 (–10·2 to –2·6)–6·5% (20 770 to 26 003)23 383 (–67·6 to –48·0)–58·6% Palestine 2240 (2076 to 2407) (3·8 to 41·3)20·3% (3288 to 3882)3580 (11·0 to 24·5)17·8% (41 551 to 48 570)44 791 (–8·8 to 24·3)5·8% (Table continues on next page)
Qatar 125 (92 to 169) –62·7% (–71·8 to –50·2) (1132 to 1449)1287 (–21·3 to –11·6)–16·5% (4436 to 7277)5700 (–68·4 to –47·9)–59·7% Saudi Arabia 8539 (7730 to 9449) –24·5% (–36·8 to –8·7) (23 787 to 28 744)26 252 (–10·8 to –5·0)–8·0% (169 663 to 208 145)187 808 (–38·4 to –14·8)–27·7% Sudan 16 573 (14 063 to 19 353) (–34·1 to –16·0)–25·7% (30 033 to 35 601)32 782 (–13·0 to –4·3)–8·7% (379 302 to 537 310)451 852 (–39·0 to –24·1)–31·9% Syria 5305 (4777 to 5905) –45·1% (–52·0 to –36·2) (13 786 to 16 378)15 063 (–21·4 to –13·4)–17·6% (134 086 to 165 724)148 597 –49·2% (–55·6 to –41·4) Tunisia 5959 (4729 to 7333) (–43·6 to –16·2)–31·2% (14 527 to 17 600)16 076 (–10·7 to –1·0)–5·8% (87 754 to 131 512)108 182 (–45·8 to –22·0)–34·6% Turkey 25 495 (21 374 to 30 226) (–33·6 to 1·8)–17·9% (88 873 to 107 510)98 038 (–1·4 to 7·6)3·2% (463 673 to 622 616)537 614 (–41·3 to –15·1)–29·1% United Arab Emirates (1892 to 3051)2413 (–43·2 to –0·6)–25·3% (6813 to 8517)7658 (–24·0 to –16·4)–20·3% (71 446 to 115 501)91 090 –26·8% (–44·1 to –2·8) Yemen 12 175 (10 243 to 14 120) (–32·1 to –6·8)–21·3% (18 633 to 22 160)20 429 (–15·5 to –7·0)–11·5% (280 251 to 395 119)335 469 (–38·4 to –16·8)–28·9% South Asia 954 892 (901 599 to 1 007 622) (–29·6 to –14·7)–22·1% (1 406 280 to 1 653 049)1 528 321 (–7·1 to –2·2)–4·6% (21 095 366 to 23 345 059)22 220 182 (–30·3 to –17·7)–23·8% Bangladesh 126 369 (113 890 to 139 529) –26·8% (–37·1 to –13·9) (148 953 to 173 601)161 709 (–15·5 to –6·9)–11·4% (2 572 931 to 3 206 620)2 871 080 (–33·4 to –8·7)–22·5% Bhutan 301 (250 to 358) (–56·7 to –35·7)–47·5% (528 to 628)578 (–22·3 to –14·8)–18·7% (5197 to 7628)6343 –49·9% (–59·1 to –39·2) India 694 144 (647 980 to 737 239) (–31·2 to –15·3)–23·7% (1 076 048 to 1 274 427)1 175 778 –5·6 to –0·7)–3·2% (15 392 109 to 17 294 326)16 354 773 (–32·0 to –18·8)–25·8% Nepal 14 916 (12 892 to 17 155) –28·4% (–40·3 to –13·7) (23 067 to 27 512)25 307 (–10·2 to –2·1)–6·1% (287 815 to 377 913)329 988 (–43·4 to –20·4)–32·9% Pakistan 119 162 (101 972 to 137 535) (–27·1 to 6·8)–11·7% (150 514 to 179 264)164 948 (–13·5 to –4·6)–8·9% (2 262 441 to 3 087 650)2 657 998 (–28·3 to 4·3)–13·9% Southern sub-Saharan Africa (31 364 to 35 578)33 545 (–11·4 to 6·0)–3·8% (56 947 to 67 170)62 096 (–0·5 to 4·7)1·9% (720 981 to 823 722)773 257 (–14·7 to 1·8)–7·3% Botswana 910 (453 to 1287) (–61·1 to 6·8)–25·2% (1418 to 1714)1565 (–14·9 to –5·9)–10·6% (10 646 to 29 571)20 705 (–59·9 to 8·1)–25·5% Lesotho 1752 (1298 to 2277) (–13·4 to 53·4)16·3% (1472 to 1749)1610 (0·1 to 9·5)4·9% (26 956 to 47 080)36 219 (–12·1 to 61·2)19·3% Namibia 937 (628 to 1217) –43·8% (–60·8 to –28·3) (1453 to 1731)1588 (–30·4 to –21·9)–26·4% (13 523 to 25 655)19 827 (–63·1 to –32·2)–47·3% South Africa 23 906 (22 357 to 25 503) (–8·7 to 9·7)–0·3% (44 245 to 52 262)48 260 (–0·5 to 4·9)2·1% (478 470 to 543 233)511 038 (–18·3 to –3·1)–10·8% Swaziland 581 (380 to 819) (–45·5 to 3·5)–23·0% (746 to 901)822 (–11·4 to –1·5)–6·9% (8431 to 17 898)12 717 (–46·1 to 5·4)–23·0% Zimbabwe 5459 (4438 to 6613) (–32·3 to 37·1)–11·3% 7508 to 8958)8251 (0·5 to 9·7)5·1% (144 742 to 204 256)172 751 (–15·8 to 73·3)9·6% Western sub-Saharan Africa (96 170 to 114 435)105 939 –18·2% (–26·0 to –10·0) (185 544 to 220 626)202 647 (–8·7 to –2·3)–5·7% (2 631 129 to 3 124 294)2 890 623 –20·6% (–28·0 to –13·2) Benin 4062 (3493 to 4629) (–17·3 to 8·8)–5·0% (5680 to 6685)6181 (–7·4 to 1·5)–3·1% (94 376 to 124 293)109 438 (–19·5 to 4·6)–8·0% Burkina Faso 4314 (3615 to 5012) (–5·3 to 33·7)11·3% 7260 to 8772)7985 (5·3 to 14·8)9·8% (99 438 to 136 783)117 917 (–10·6 to 25·4)4·6% Cameroon 9091 (6846 to 11 638) (–24·2 to 20·2)–3·6% (11 739 to 13 890)12 801 (–8·1 to 1·0)–3·5% (175 653 to 302 530)234 925 (–23·2 to 24·0)–1·2% Cape Verde 216 (185 to 246) (–44·4 to –25·7)–35·4% (391 to 464)426 (–18·0 to –9·7)–14·1% (3814 to 5134)4472 (–47·3 to –27·7)–38·2% Chad 4259 (3544 to 5002) (–24·5 to 4·5)–11·2% (6344 to 7512)6947 (–6·2 to 2·7)–2·0% (101 074 to 143 343)121 309 (–24·6 to 2·5)–11·9%
Côte d’Ivoire 10 788 (9213 to 12 430) (–16·2 to 10·4)–4·0% (13 329 to 15 718)14 502 (–11·2 to –2·9)–7·3% (261 505 to 358 094)306 552 (–16·3 to 10·5)–4·3% The Gambia 477 (406 to 550) (–28·2 to 1·9)–14·0% (908 to 1078)992 (–7·0 to 1·1)–3·0% (11 171 to 15 064)13 083 (–29·3 to –1·6)–15·8% Ghana 13 922 (11 821 to 15 825) (–28·7 to 5·6)–13·3% (17 257 to 20 270)18 747 (–10·9 to –2·3)–6·9% (286 593 to 380 605)334 213 (–30·4 to 1·7)–16·1% Guinea 5774 (4909 to 6687) (–13·9 to 18·9)1·9% (7036 to 8298)7644 (–4·5 to 4·1)–0·3% (132 282 to 178 334)153 562 (–16·3 to 15·7)–0·9% Guinea-Bissau 1145 (973 to 1339) (–24·9 to 5·6)–10·8% (1216 to 1429)1323 (–11·2 to –3·5)–7·6% (26 818 to 37 178)31 694 (–26·4 to 3·3)–13·4% Liberia 1647 (1454 to 1857) (–13·7 to 16·6)0·1% (2443 to 2870)2650 (–3·5 to 5·5)0·8% (37 820 to 47 988)42 873 (–18·0 to 9·6)–5·0% Mali 5168 (4167 to 6326) (–44·1 to –15·2)–31·6% (7620 to 9098)8345 (–18·0 to –9·9)–14·1% (122 153 to 180 785)149 767 (–47·1 to –18·7)–34·7% Mauritania 1111 (829 to 1464) –40·3% (–52·9 to –25·3) (2225 to 2660)2444 (–22·9 to –14·9)–19·0% (21 364 to 36 556)28 170 (–54·8 to –29·3)–43·3% Niger 6315 (4566 to 7927) (–27·6 to 11·0)–9·7% (9390 to 11 227)10 280 (–6·9 to 2·0)–2·5% (133 201 to 222 513)180 124 (–31·2 to 6·5)–14·1% Nigeria 27 031 (21 600 to 32 789) (–51·2 to –26·7)–39·4% (76 406 to 92 679)84 197 (–13·7 to –4·8)–9·5% (640 133 to 917 945)771 086 (–52·0 to –28·8)–40·9% São Tomé and
Príncipe (73 to 100)86 (–20·6 to 12·8)–4·1% (117 to 138)127 (–10·8 to –2·0)–6·6% (1597 to 2254)1921 (–27·9 to 5·3)–12·4% Senegal 5259 (4531 to 6069) (–11·6 to 13·5)–0·1% (8220 to 9725)8966 (–4·4 to 4·8)0·2% (118 011 to 156 851)136 173 (–13·2 to 9·8)–2·4% Sierra Leone 2499 (2143 to 2841) (–8·6 to 23·8)5·8% (3529 to 4210)3870 (0·0 to 9·6)4·7% (65 850 to 86 752)76 367 (–11·7 to 18·7)2·0% Togo 2775 (2286 to 3280) (–21·6 to 6·4)–8·5% (3852 to 4569)4213 (–8·4 to 0·5)–3·9% (64 200 to 90 976)76 969 (–21·0 to 6·1)–8·4% Eastern sub-Saharan Africa (121 230 to 147 971)133 526 –35·6% (–41·9 to –27·0) (176 247 to 208 292)192 119 –16·5% (–19·2 to –13·8) (2 910 872 to 3 535 592)3 189 024 –38·2% (–44·3 to –30·8) Burundi 4421 (3685 to 5323) (–60·3 to –38·2)–50·6% (4961 to 5915)5425 (–34·2 to –27·5)–31·0% (92 014 to 132 609)110 743 (–64·1 to –43·0)–54·7% Comoros 219 (177 to 273) –48·1% (–57·5 to –36·8) (354 to 422)388 (–30·8 to –23·0)–26·9% (4419 to 6790)5463 (–60·6 to –41·5)–52·1% Djibouti 327 (234 to 437) (–47·2 to –12·4)–30·6% (536 to 640)588 (–15·2 to –6·6)–11·1% (5554 to 10 582)7818 (–49·6 to –16·9)–33·6% Eritrea 1949 (1582 to 2419) (–53·6 to –36·2)–45·4% (2154 to 2577)2358 (–28·5 to –20·7)–24·9% (39 196 to 60 145)48 369 –49·8% (–57·3 to –40·7) Ethiopia 38 353 (32 250 to 45 098) –44·2% (–54·0 to –29·1) (48 042 to 57 217)52 548 (–24·5 to –17·1)–20·9% (747 055 to 1 042 900)887 620 (–56·8 to –33·9)–47·4% Kenya 10 570 (8568 to 13 029) (–30·0 to –4·2)–19·6% (19 206 to 23 058)21 107 (–6·4 to –1·7)–4·0% (203 981 to 303 376)248 359 (–30·1 to –7·4)–20·4% Madagascar 16 862 (13 152 to 20 830) (–33·0 to 2·9)–15·3% 14 696 to 17 266)15 987 (–21·9 to –13·9)–18·0% (351 040 to 560 459)448 528 (–34·7 to 0·2)–18·1% Malawi 5080 (3969 to 6256) (–41·8 to –2·2)–24·6% (7879 to 9516)8704 (–13·6 to –5·1)–9·4% (90 200 to 140 823)114 628 (–44·3 to –6·1)–27·5% Mozambique 12 066 (10 024 to 14 568) (–47·0 to –21·1)–35·5% (15 330 to 18 225)16 786 (–19·9 to –11·6)–15·7% (229 481 to 334 354)276 356 (–48·5 to –23·3)–37·1% Rwanda 3028 (2349 to 3750) (–69·1 to –48·3)–59·3% (4574 to 5524)5051 (–37·3 to –30·5)–34·0% (54 910 to 87 266)70 174 (–72·7 to –52·6)–63·3% Somalia 5247 (4258 to 6507) (–39·2 to –14·9)–28·2% (5329 to 6304)5824 (–20·1 to –12·7)–16·3% (105 830 to 161 583)130 125 (–42·6 to –17·0)–31·7% South Sudan 4774 (3580 to 6099) (–35·6 to 2·9)–18·5% (6587 to 7878)7207 (–13·8 to –5·6)–9·8% (87 008 to 146 428)114 261 (–39·1 to 0·1)–22·2% (Table continues on next page)
studies that are not commonly available in populations
where causes of death are ascertained by verbal autopsy.
Covariates included in the models were chosen on the
basis of an assessment of causal associations for the
risk factors or markers of access to care (appendix).
Non-fatal disease modelling
We used DisMod-MR 2.1, a Bayesian meta-regression tool,
to model the non-fatal burden of stroke.
8Estimates were
generated using a two-stage modelling approach. In the
first stage, we ran four models (acute ischaemic, chronic
ischaemic, acute haemorrhagic, and chronic haemorrhagic
stroke) using only incidence, prevalence, and excess
mortality data as inputs. We then used the ratio of acute to
chronic cause-specific mortality estimated by these models
to divide the ischaemic-specific and haemorrhagic-specific
stroke deaths estim ated in CODEm into acute and chronic
proportions. The four models were then re-run using the
same incid ence, prevalence, and excess mortality data as
well as the custom cause-specific mortality as input data,
thus generating internally consistent fatal and non-fatal
estimates.
For the acute models, we used all available high-quality
incidence and case fatality data from registries and
published literature along with inpatient hospital data on
incident events. Acute unspecified stroke was split
according to the ratio of ischaemic to haemorrhagic
inpatient hospital data sources are listed in the appendix.
First-ever, type-specific (ischaemic vs haemorrhagic) data
from stroke registries were the reference. Datapoints that
did not meet our reference case definition, such as those
that included recurrent stroke, did not report type-specific
data, or only included hospital admissions, were adjusted
in DisMod. Prevalence data from surveys, along with the
incidence of those surviving the first 28 days calculated
from the acute models were included as input data for the
chronic models. Counts of data points and covariates and
model settings for DisMod are in the appendix. Detailed
descriptions of health states, lay descriptions,
distribu-tions of functional and cognitive disability, and
dis-ability weights for stroke sequelae in GBD 2016 are in
the appendix.
Socio-demographic Index (SDI)
SDI was developed for GBD 2015 as a metric of overall
development that positions all locations on a spect rum
of socio economic development, using educational
attain-ment, lagged distributed income, and total fertility rate.
For GBD 2016, this index was updated such that
mini-mum scores are the lowest observed level of GDP per
capita or educational attainment or highest observed level
of total fertility rate in known datasets. Maximum scores
are now plateaus in the relationships between the
com-ponent parts of the index and selected mortality or health
Tanzania 14 647 (11 980 to 17 354) (–42·8 to –16·0)–30·4% (24 322 to 28 845)26 556 (–12·8 to –4·4)–8·7% (285 299 to 407 059)344 995 (–44·2 to –18·1)–32·3% Uganda 10 409 (8568 to 12 321) –38·8% (–49·6 to –25·7) (14 022 to 16 747)15 359 (–23·5 to –16·4)–20·0% (205 349 to 293 208)247 499 (–52·8 to –29·0)–42·3% Zambia 5572 (4267 to 6974) (–24·8 to 41·0)2·7% (7360 to 8816)8080 (–6·2 to 2·6)–1·8% (103 666 to 167 385)133 977 (–23·4 to 44·6)5·2% Central sub-Saharan Africa (40 448 to 53 380)47 427 (–25·8 to –7·5)–17·2% (57 344 to 67 591)62 468 (–14·5 to –7·9)–11·2% (970 019 to 1 241 311)1 116 581 –20·7% (–28·7 to –11·6) Angola 7656 (5801 to 10 190) –29·0% (–45·4 to –6·8) (11 051 to 13 153)12 096 (–19·4 to –11·9)–15·7% (144 242 to 253 969)190 746 (–49·4 to –11·7)–33·5% Central African Republic (3178 to 5045)4110 (–24·9 to 9·9)–7·5% (3459 to 4083)3772 (–13·4 to –4·7)–9·1% (76 289 to 120 239)97 536 (–26·5 to 10·6)–8·4% Congo Brazzaville) 2139 (1678 to 2635) (–54·6 to –27·1)–41·7% (2726 to 3239)2978 (–29·2 to –21·2)–25·2% (37 480 to 59 329)48 013 (–57·6 to –30·9)–45·3% Democratic Republic of the Congo (26 643 to 37 306)32 497 (–20·0 to 3·6)–9·0% (38 416 to 45 399)41 815 (–11·3 to –2·7)–7·2% (636 168 to 865 958)759 216 (–22·8 to –0·1)–12·3% Equatorial Guinea 190 (112 to 287) (–81·2 to –56·9)–70·7% (461 to 560)510 (–34·8 to –26·8)–31·1% (2821 to 6760)4553 (–83·2 to –61·0)–73·7% Gabon 834 (671 to 1008) (–49·6 to –22·6)–37·8% (1189 to 1419)1297 (–27·6 to –20·2)–24·0% (13 375 to 19 884)16 518 (–53·1 to –26·4)–41·3% DALYs=disability-adjusted life-years. SDI=Socio-demographic Index.
total fertility rate. Gaussian process regres sion was used
to establish the average relationship between
cause-specific, age-standardised DALY rates and SDI for all
loca-tions from 1990 to 2016. These rates were used as the
expected values for DALYs in comparisons between
observed and expected rates.
Risk factor estimation
The comparative risk assessment framework developed
for GBD was used to estimate levels and trends in
attributable burden of stroke due to risk factors that
satisfied the criteria of sufficient evidence of a causal
relationship, availability of exposure data, and potential
for modification.
12Four components were incorporated
into estimating attributable burden using this approach:
(1) burden estimates for stroke; (2) exposure levels for
each risk factor; (3) relative risk of stroke as an outcome
of exposure to the risk factor; and (4) theoretical
mini-mum risk exposure level—ie, the level of exposure that
minimises risk for each individual in the population. The
population attributable fraction, estimated independently
for each risk factor, is the proportion of the cause that
would be decreased if the exposure to the risk factor in the
past had been reduced to the counterfactual level of the
theoretical minimum risk exposure level. Estimates of
attributable burden for each risk–outcome pair were
established by multiplying the relevant cause measure by
the population attributable fraction. All estimates of
attributable burden are gener ated at the most detailed
level and estimates for risk groupings or all risk factors
combined are generated via an aggregation process that
accounts for the fact that the effect of one risk factor
might be partly or completely mediated through the
effect of another. This mediation analysis is informed by
individual-level data from prospective cohort studies on
the joint effects of combinations of risk factors.
Role of the funding source
The funder of the study had no role in study design,
data collection, data analysis, data interpretation, or the
writing of the report. All authors had full access to
the data in the study and had final responsibility for the
decision to submit for publication.
Results
GBD stroke estimates for 1990–2016 are available for
download from the GBD Results Tool at the Global Health
Data Exchange. In 2016, stroke was the second largest
cause of death globally (5·5 million [95% UI 5·3–5·7]
deaths) after ischaemic heart disease (table). Fewer
women died as a result of stroke (2·6 million [2·5–2·7]
deaths) than did men (2·9 million [2·8–3·0] deaths)
.
The number of global deaths due to ischaemic stroke
(2·7 million [2·6–2·8]) was slightly lower than the number
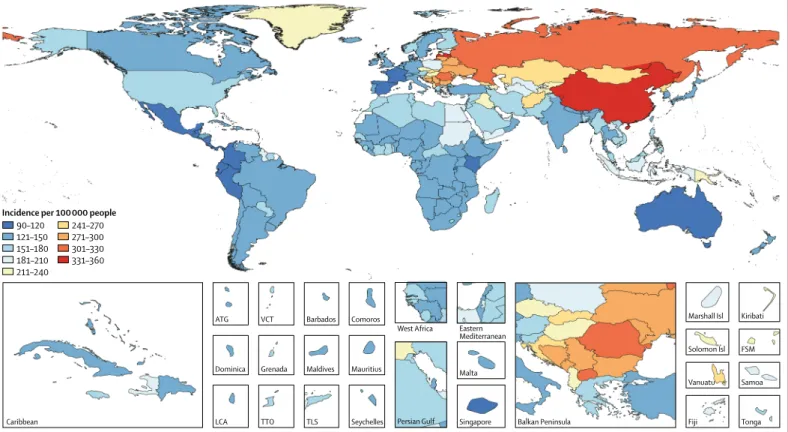
Figure 1: Age-standardised stroke incidence by country, for both sexes, 2016
ATG=Antigua and Barbuda. FSM=Federated States of Micronesia. Isl=Islands. LCA=Saint Lucia. VCT=Saint Vincent and the Grenadines. TLS=Timor-Leste. TTO=Trinidad and Tobago.
Persian Gulf Caribbean LCA Dominica ATG TTO Grenada VCT TLS Maldives Barbados Seychelles Mauritius Comoros
West Africa Eastern Mediterranean
Malta
Singapore Balkan Peninsula Tonga
Samoa FSM Fiji Solomon Isl Marshall Isl Vanuatu Kiribati 90–120 121–150 151–180 181–210 211–240 241–270 271–300 301–330 331–360 Incidence per 100 000 people
For the Global Health Data Exchange see http://ghdx. healthdata.org/gbd-results-tool
DALYs due to ischaemic stroke (51·9 million [47·9–55·6])
was lower than the number due to haemorrhagic
stroke (64·5 million [62·6–66·5]; appendix). There were
80·1 million (74·1–86·3) prevalent cases of stroke globally
in 2016: 41·1 million (38·0–44·3) prevalent cases in
women and 39·0 million (36·1–42·1) prevalent cases in
men. Of the total number of prevalent strokes, 84·4%
(82·1–86·4) were ischaemic
.
There were 13·7 million
(12·7–14·7) new stroke cases in 2016.
The highest age-standardised incidences of stroke were
observed in east Asia, especially China (354 [95% UI
331–378] per 100 000 person-years), followed by eastern
Europe, ranging from 200 (181–218) per 100 000 person-years
in Estonia to 335 (301–369) per 100 000 person-years in
Latvia (figure 1). The lowest incidences were in central
Latin America, especially El Salvador (97 [88–105]
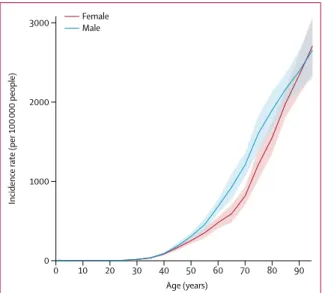
per 100 000 person-years). Age-specific stroke incidence
was similar between men and women younger than
55 years, but significantly
greater for men than women at
ages 55–75 years
(figure 2).
Age-standardised incidence declined from 1990 to 2016
globally (–8·1% [–10·7 to –5·5]), in all SDI groups except
the middle SDI group, and in most
regions (table;
appendix). The region with the largest decrease in
age-standardised stroke incidence was southern Latin America
(–33·3% [–36·4 to –29·7]) and the region with the largest
increase was east Asia (4·9% [1·3 to 8·1]). For ischaemic
stroke, the largest decrease was in southern Latin America
(–38·0% [–39·4 to –36·6]), and the largest increase was
in east Asia (17·5% [15·8 to 19·2]; appendix). For
haemorrhagic stroke, inci dence decreased in all regions.
The largest decrease was in high-income Asia Pacific
(–32·5% [–33·7 to –31·2]), and the smallest decrease was
in southern sub-Saharan Africa (–5·1% [–6·2 to –4·0];
appendix).
Globally, the age-standardised rate of deaths due to stroke
decreased by 36·2% (–39·3 to –33·6) from 1990 to 2016,
with decreases in all five SDI groups. These death rates
also declined for all but one region from 1990 to 2016, with
the largest decrease in the high-income Asia Pacific region
(–66·3% [–68·8 to –63·4]) and no significant change
in southern sub-Saharan Africa (–3·8% [–11·4 to 6·0];
table). These results were similar for ischaemic stroke
and haemorrhagic stroke, with the largest decrease for
both in the high-income Asia Pacific region (–70·2%
[–72·3 to –67·8] for ischaemic stroke and –59·8%
[–63·1 to –56·1] for haemorrhagic stroke; appendix). Death
rates for neither ischaemic nor haemorrhagic stroke
changed significantly between 1990 and 2016 in southern
Age-standardised DALY rates for stroke also declined
from 1990 to 2016 globally (34·2% [–37·2 to –31·5]) for
all SDI quintiles, and for all regions, again with the
largest change occurring in high-income Asia Pacific
(–61·5% [–64·9 to –58·1]) and the smallest in southern
sub-Saharan Africa (–7·3% [–14·7 to 1·8]; table). Southern
Latin America was the region with the largest decrease for
ischaemic stroke (–63·7% [–66·8 to –60·6]; appendix) and
high-income Asia Pacific was the region with the largest
decrease for haemorrhagic stroke (–59·9% [–63·4 to –55·8];
appendix). Southern sub-Saharan Africa had no change in
ischaemic stroke (–1·9% [–9·9 to 7·4]) and a decrease in
haemorrhagic stroke (–10·2% [–17·9 to –1·1]).
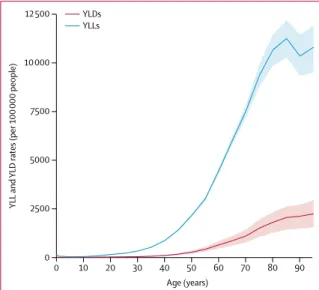
Rates of YLLs and YLDs were very low for the younger
age groups (<40 years) and then in creased substantially
with age, with YLLs increasing much more rapidly than
YLDs (figure 3) because of the high mortality burden
of stroke.
After an increase in expected DALY rates at the lower
end of the SDI scale, these rates decline rapidly for SDI
values of 0·35 and higher (figure 4). For most regions, the
burden of stroke decreased with increases in SDI over
time. However, central and eastern Europe and central
Asia saw increased DALY rates in the early 1990s after the
dissolution of the Soviet Union, followed by subsequent
decreases as SDI increased. Stroke DALY burden in
southern sub-Saharan Africa showed a similar pattern,
with an initial spike in rates with increasing SDI, followed
by a steady decrease. DALY rates were higher than expected
early in the time series for eastern and central sub-Saharan
Africa and high-income Asia Pacific but have decreased
with increasing SDI. Eastern Europe, central Europe,
central Asia, Oceania, and east Asia had higher
stroke-related DALY rates than would be expected on the basis of
comparisons of SDI for all years. Conversely, rates for
Figure 2: Global incidence of stroke by age and sex, 2016 0
1000 2000
Incidence rate (per 100
000 people)
0 10 20 30 40 50 60 70 80 90
than expected for all timepoints. Although DALY rates in
southeast Asia were initially lower than expected, they
were in most recent years slightly higher than expected.
Under the comparative risk assessment framework,
most stroke DALYs (88·8% [95% UI 86·5–90·9]) can be
accounted for 72·1% (66·4–77·3) of stroke DALYs.
Behavioural factors (smoking, poor diet, and low physical
activity) accounted for 66·3% (59·3–73·1) of attributable
DALYs, and environmental risks (air pollution and lead
exposure) for 28·1% (25·3–30·9). As the effect of many of
these risk factors are mediated partly or wholly through
another risk factor, the crude sum of the groups is
expected to exceed 100%. The aggregation process to
generate estimates of overall attributable burden accounts
for joint effects of a combination of risk factors, thus the
final estimate is less than 100%. The remaining burden is
due to unknown or unmeasured risk factors, genetic
factors, or the effect of gene–environment interactions.
Population attributable fractions and UIs for the top
ten risk factors for each stroke subtype by sex in 1990 and
2016 are in the appendix.
Discussion
Our estimates indicate that the global burden of stroke is
high, with more than 80 million stroke survivors in 2016.
Age-standardised death rates from stroke have decreased
in all regions from 1990 to 2016, whereas incidence has
decreased in most regions but increased in east Asia and
southern sub-Saharan Africa. The overall burden of
stroke, as quantified by age-standardised DALY rates,
decreased from 1990 to 2016, but the absolute number of
DALYs due to stroke increased over that same period.
The increase in absolute numbers is largely due to
population growth and ageing resulting in a greater
number of people with stroke despite declining incidence
and improved stroke survival leading to higher prevalence
of chronic stroke.
Studies have shown that much of the burden due to
stroke can be attributed to modifiable atherosclerotic risk
factors. INTERSTROKE,
13a case-control study done at
32 locations, found that the risk factors for stroke in
low-income and middle-low-income countries were similar to
those in high-income countries, although the relative
contribution of each differed between regions. The high
burden of stroke worldwide suggests that primary
prevention strategies are either not widely implemented
or not sufficiently effective. In addition to targeting
behavioural risk factors, effective screening for conditions
that increase stroke risk, such as hypertension, atrial
fibrillation, and diabetes mellitus, is essential. Many
screening strategies use the predicted absolute risk of
cardiovascular disease to identify individuals at high risk
of cardiovascular disease events and to define therapeutic
thresholds for specific interventions.
14,15However, these
approaches have limitations, including low efficiency
and missing data for people with low to moderate
Figure 4: Age-standardised DALY rates for stroke versus SDI for both sexes, by region, 1990–2016 Black line shows the expected values by SDI based on a regression of all years of data for all GBD locations between 1990 and 2016. DALY=disability-adjusted life-year. SDI=Socio-demographic Index.
0·25 0·50 0·75 1000 2000 3000 5000 4000 Age-standardised DA LY rate (per 100 000) SDI Global
High-income Asia Pacific High-income North America Western Europe Australasia Andean Latin America Tropical Latin America Central Latin America Southern Latin America Caribbean Central Europe Eastern Europe Central Asia
North Africa and Middle East South Asia
Southeast Asia East Asia Oceania
Western sub-Saharan Africa Eastern sub-Saharan Africa Central sub-Saharan Africa Southern sub-Saharan Africa Figure 3: Age-standardised rates of YLLs and YLDs due to stroke for both
sexes, by age, 2016
YLDs=years lived with disability. YLLs=years of life lost.
0 10 20 30 40 50 60 70 80 90 0 2500 5000 7500 YLL and
YLD rates (per 100
000 people)