Department of Wildlife, Fish, and Environmental Studies
Browsing behaviour in complex ungulate
multi-species systems in southern Sweden
Betesbeteende i komplexa flerartssystem av klövvilt i södra
Sverige
Jonatan Sandberg
Browsing behaviour in complex ungulate multi-species systems
in southern Sweden
Betesbeteende i komplexa flerartssystem av klövvilt i södra Sverige
Jonatan Sandberg
Supervisor: Therese Löfroth, Swedish University of Agricultural Sciences, Department of Wildlife, Fish, and Environmental Studies
Assistant supervisor: Lars Edenius, Swedish University of Agricultural Sciences, Department of Wildlife, Fish, and Environmental Studies
Assistant supervisor: Joris Cromsigt, Swedish University of Agricultural Sciences, Department of Wildlife, Fish, and Environmental Studies
Examiner: Göran Ericsson, Swedish University of Agricultural Sciences, Department of Wildlife, Fish, and Environmental Studies
Credits: 30 credits
Level: Second cycle, A2E
Course title: Master degree thesis in Biology at the department of Wildlife, Fish, and Environmental Studies
Course code: EX0764
Programme/education: Jägmästarprogrammet
Course coordinating department: Department of Wildlife, Fish, and Environmental Studies
Place of publication: Umeå
Year of publication: 2019
Title of series: Examensarbete/Master's thesis
Part number: 2019:4
Online publication: https://stud.epsilon.slu.se
Keywords: Browsing pressure, interspecific competition, multi-species
In recent years several of the ungulate species present in Sweden have increased in both densities and distribution. Browsing pressure has mainly been attributed to moose but recent research shows that with more complex ungulate ecosystems new interactions and connections might emerge. This thesis serves to investigate the im-pact of multi-species ungulate communities on browsing pressure in boreal forests and semi-open landscapes in southern Sweden. In this study the effect of ungulate species densities, richness and feeding strategy on browsing pressure were analyzed. This study uses data collected within the ongoing environmental analysis project “ref-erence areas for management of ungulates in southern Sweden”. Total weighted browsing pressure, tree species specific browsing pressure and ungulate densities were monitored. The data was analyzed using generalized linear mixed models. Final model selection was done using Akaike information criterion (AIC). In order to in-clude different ungulate species in the same models ungulate densities were trans-formed into moose equivalents. GLMM models showed that ungulate species rich-ness, ungulate density and ungulate feeding strategy all have a significant effect on browsing pressure. Ungulate species richness had a negative impact on browsing pressure which likely means that increased interspecific competition could cause a decrease in browsing pressure. Ungulate total density had a positive effect on brows-ing pressure, which was not unexpected given previous research on the subject. Feed-ing strategy was found to have some, although weak indications that it could be a contributing factor to browsing pressure. In all the final models moose had a rela-tively large positive estimate, which agree with previous studies that moose is one of the main perpetrators behind browsing pressure carried out by ungulates in Sweden. To conclude there are clear indications that new interactions and connections will emerge with changing ungulate populations.
Keywords: browsing pressure, interspecific competition, multi-species
Abstract
1 Introduction 5
1.1 Aim 7
2 Method 8
2.1 Study areas 8
2.2 Study design 10
2.2.1 Fecal pellets surveys 10
2.2.2 Browsing pressure survey 11
2.3 Statistical analysis 11
3 Results 13
3.1 Main findings 13
3.2 Statistical analysis 17
4 Discussion 20
4.1 Is browsing pressure on tree saplings more strongly related to the number of ungulate species than to their combined densities? 20 4.2 To what extent is browsing pressure influenced by the identity of ungulate
species? 20
4.3 Evaluation of the methods used in this study 21
4.4 Conclusion 22
The forestry industry in Sweden is an important revenue stream for the Swedish economy (Skogsindustrierna 2015). Forests in Sweden cover 28.3 million hectares of which 23.6 million hectares are productive woodland (Skogsdata 2017). Fifty percent of the forest is owned by private landowners, 25 percent owned by compa-nies and the rest by the state and other private owners (Skogsdata 2017). Private owners stand for 66% of clear cuts annually (Skogsdata 2017), for a majority of the private landowners’ forestry used to be an important part of their economy and would offer a financial security (Lönnstedt 1987) but with increased urbanization and increasing life standards other values take place among the economic aspects (Mattila et al. 2014).
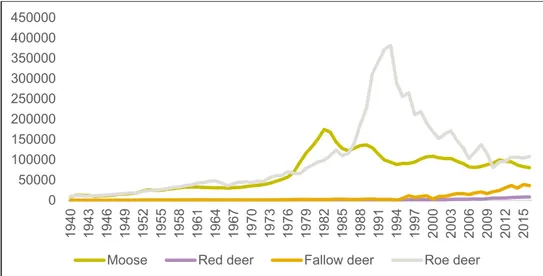
Forestry in Sweden underwent a paradigm shift in the 1940-1950’s when it went from small-scale to the industrial and intense process it is today (Ericsson et al. 2000; Östlund et al. 1997).This paradigm shift meant an increase in clear-cut areas where the food available for ungulate browsers increased enormously while the for-est regenerated. Around the same time there was a change in hunting policy into new hunting practices such as a decreased harvest of female moose compensated by an increased harvest of bulls and calves. These new hunting practices combined with increased forage availability contributed to sharp increases in ungulate populations, especially moose (Alces alces) responded quickly (Figure 1; Hörnberg 1991; Cederlund et al. 1987). In recent decades, populations of red deer (Cervus elaphus),
fallow deer (Dama dama) and roe deer (Capreolus capreolus) have increased in
both densities and distribution (Bergström et al. 2009; Apolonio et al. 2010). Red deer and fallow deer have been slowly increasing while roe deer had a strong crease mainly caused by declining fox populations because of Sarcoptic mange, in-creased supplementary feeding by hunters and mild winters which inin-creased surviv-ability (Apolonio et al. 2010). With harder winters, recovering fox populations and increasing lynx populations during the later 90’s the roe deer population have de-creased and is today roughly on the same level as moose (figure 1).
Figure 1. Swedish hunting bag statistics 1940-2016 (SJF Viltdata 2017).
According to Hofmann (1989), ungulates can be classified depending on their feed-ing strategy; Swedish ungulates can be divided into browsers and grazers; moose and roe deer are classified as concentrate selectors which are characterized by a diet
consisting of mainly highly digestible content. Red deerand fallow deer are
classi-fied as intermediate grazers, which are characterized by a selective diet with a sub-stantial fiber tolerance (Hoffman 1989; Bergqvist et al. 2002). Browsers have a high rate of reproduction and dispersal, allowing them to take quick advantage of dis-turbances in the forest ecosystem while grazers have a slower rate of reproduction and dispersal as an adaption to open or semi-open landscapes which are character-ized by a slower change and higher stability than the forest ecosystem (Bergquist et al. 2002).
Moose food preferences in Sweden are thoroughly studied; during summer moose prefer plants in the field layer, shrubs and deciduous trees such as rowan, willow, aspen and oak, while during winter it prefers shoots and twigs of mainly pine but also birch, partially depending on forage availability (Månsson et al. 2007; Berg-ström et al. 2010). Roe deer have similar diet as moose; during winter roe deer will mainly browse shoots and twigs of coniferous trees, heather and berry shrubs, dur-ing summer they switch the coniferous trees for deciduous trees and also include herbs and grass in their diet (Bergström et al. 2010; Nichols et al. 2015).
Red deer and fallow deer prefer grazing on grass, herbs and shrubs during summer, they also feed on twigs and shoots of the same substrate as roe deer and moose if the forage availability is high (Bergström et al.2010).
Wildlife is an ecosystem service that offer and affect a large number of factors. For example, ungulate browsing cause large monetary damages for landowners by neg-atively affecting reforestation, timber quality (Bergquist 2011) and cause harm to
biodiversity by disfavoring biologically important species such as oak or aspen
(Bergquist et al. 2002; Ericsson et al. 2001; Angelstam et al. 2000). Ungulates can also create dangerous situations in traffic for railway (Seiler et al. 2011) and car
0 50000 100000 150000 200000 250000 300000 350000 400000 19 40 19 43 19 46 19 49 19 52 19 55 19 58 19 61 19 64 19 67 19 70 19 73 19 76 19 79 19 82 19 85 19 88 19 91 19 94 19 97 20 00 20 03 20 06 20 09 20 12 20 15
traffic (Seiler et al. 2004). The actual monetary cost of ungulate damages is hard to asses, but an estimate by Seiler (2004b) places the cost of vehicle damages by col-lision with ungulates in Sweden to 100 million Euros annually. Kempe (2012) esti-mates the future forest production loss in Sweden caused by current damages to 1 million m3sk if current damage-levels are retained (93.3 million m3sk were gross felled in Sweden during 2016, Skogsstyrelsen 2017)
On the other hand, wildlife is a great resource to natural tourism, provides hunting experiences, climate neutral meat and can also positively affect biodiversity by in-creasing structural heterogeneity (Edenius et al. 2002) and by inin-creasing light expo-sure to the ground by browsing in tree canopies (Mathisen 2011). According to an estimate by Kindberg et al. (2010), moose provides approximately 8.5 million kg meat annually. Boman et al. (2011) places the value on moose hunting to 1.45 billion sek.
Wildlife in Sweden hence offers many possibilities and potential problems, and the debate in Sweden have been heated since Sweden have many strong stakeholder groups involved, e.g. Swedish Hunters’ Association, the forest industry, Swedish Environmental Protection agency, farmers, landowners, traffic, etc.
In order to strike a balance between the moose population, available food resources and damages on forest, a new moose management system was implemented in Swe-den in 2012 (Regeringen 2009). The new system is an ecosystem-based adaptive management system that implements iterative decision making and learning on a regional level.
Since focus have mainly been on moose, little is known about ungulate browsing in multi-species systems where both intraspecific and interspecific competition can be contributing factors to size and variation in browsing pressure. With the appearance of new multi-species ungulate communities, new connections and interactions might emerge. There are few studies regarding browsing in areas with a high rich-ness and densities of ungulate species (Gordon et al. 1989; Nicols et al. 2015; Måns-son et al. 2015; Ånöstam 2017).
1.1 Aim
The aim of my thesis is to investigate the complex conditions that affect browsing pressure in forest landscapes with multiple ungulate species in Sweden by investi-gating browsing pressure by large mammalian herbivores in relation to their occur-rence, densities and feeding strategy.
I aim to answer the following question:
Is browsing pressure on tree saplings more strongly related to the
num-ber of ungulate species than to their combined densities?
To what extent is browsing pressure influenced by the identity of
2.1 Study areas
I used ungulate browsing survey data collected within the Foma (Fortlöpande miljöanalys) project “Reference areas for ungulate management southern Sweden” 2012-2015 (Edenius 2012b). Surveys were carried out in two areas in southern Swe-den (Växjö and Öster Malma).
Öster Malma is situated outside the city of Nyköping in Sörmland province (mid-point coordinate – 58.950778, 17.159450 – WSG84), and distinctive for the Öster Malma area is high densities of ungulate species, partially due to extensive support-ive feeding by hunters in the area.
Växjö is situated in Småland province in southern Sweden (midpoint coordinate – 57.084610, 14.812889 – WSG84). During early January 2005 the area was hit hard by the storm Gudrun, which knocked down large areas of forest; according to Frid-man et al. (2006) 272 000 hectares were damaged and between 110 000 to 130 000 hectares were so damaged that reforestation was demanded (Wallstedt et al. 2013). Ten years after the storm areas affected by the storm had luxurious regrowth of birch, spruce and other tree species. In contrast, Scots pine has been very sparsely regenerated due to the perceived risk of browsing damages (Bergquist 2009). Many stands could not be immediately treated through salvage logging because of the enormous task to clear all felled logs so many areas were resting for several years before reforestation (Bergquist 2009).
Figure 2, Öster Malma study area and sampling design.
2.2 Study design
Inventories of pellets and browsing were carried out in 100 m2 large sample plots
with 16 sample plots clustered within 1 x 1 km tracts, with 50 tracts per study area. The tracts were placed in a regular grid system with 3km distance between tracts. Further description of the method is available in (Edenius 2012).
2.2.1 Fecal pellets surveys
Each fresh pile was counted if it was considered representative and more than half was within the plots. For moose and red deer 20 pellets in a pile were used as a lower limit and 10 pellets in a pile for fallow deer and roe deer. Pellets belonging to roe deer and fallow deer are very hard to differentiate so piles with fewer than 45 pellets were attributed to roe deer while piles with more than 45 pellets were at-tributed to fallow deer (Eckervall 2007; Pfeffer 2016).
The fecal pellets survey use circular plots with a radius of 5.64 (100m2) in case of
moose and red deer. Due to the smaller and therefore harder to detect pellets from roe deer and fallow deer fecal pellet groups of these species were surveyed in
circu-lar plots with a radius of 1,78m (10m2).
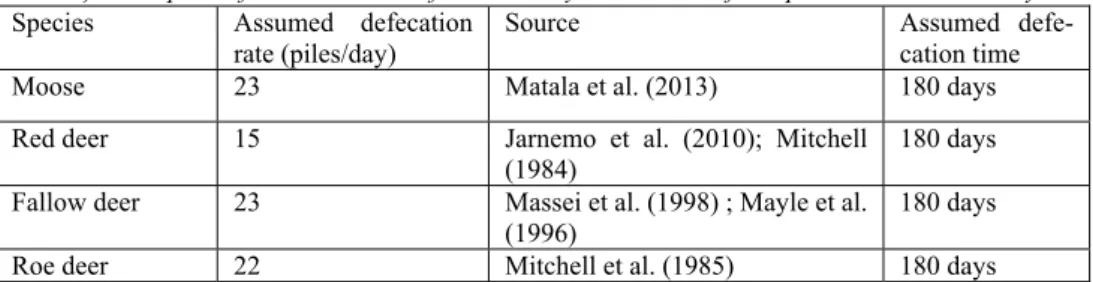
Fecal pellet survey is a low cost method to monitor ungulate populations (Suther-land 2006) over large areas over time. The method have been partially evaluated with the main focus on moose where it was found that the method offers the best relationship between the moose population and forage utilization considering the cost of inventory (Rönnegård et al. 2008; Hörnell-Willebrand et al. 2010). Whereas pellet count surveys have proved a reliable method for moose population monitor-ing, the method’s applicability in case of other ungulate species is more uncertain. For example, Pfeffer et al. (2017) has suggested that dung counts can underestimate density of roe deer. The output from the method can be used as an index of popula-tion size to compare between years and areas and total densities can be calculated. However, uncertainty about defecation rate and age of counted pellet groups limits the accuracy of the method for estimates of absolute density (Table 1).
Density (animals per 1000 hectares) can be calculated through the formula: (S*K) / (P*D*T) where S = Sum of all piles on all visited plots, K = Scaling factor, P = Number of visited plots, D = Defecation rate and T = Deposition time.
The method allows survey of multiple species simultaneously and can be carried out voluntary by hunters, forest owners and other stakeholders. Unlike aerial invento-ries, counting pellet groups are not depending on snow which makes it useful in areas where snow is absent or rare (Hörnell-Willebrand 2010).
The counting of past winters pellets is preferably carried out in spring after the snow have melted yet before the pellet groups have been covered by the greening up of vegetation. In my survey the sampling was carried out in April. In order to increase
accuracy of the method, permanent plots can be used where pellets are cleared dur-ing fall, in my survey the plots were not cleaned, instead the inventory personnel were instructed to count only fresh piles. Knowledge of site-specific defecation rate were not available but would improve the accuracy of the survey.
Table 1
,
Assumptions for calculations of total density based on the fecal pellet data in this study.Species Assumed defecation
rate (piles/day) Source Assumed defe-cation time
Moose 23 Matala et al. (2013) 180 days
Red deer 15 Jarnemo et al. (2010); Mitchell
(1984) 180 days
Fallow deer 23 Massei et al. (1998) ; Mayle et al. (1996)
180 days
Roe deer 22 Mitchell et al. (1985) 180 days
2.2.2 Browsing pressure survey
The browsing survey was carried out simultaneously with the fecal pellets surveys
within the same100 m2 circular plot areas. Pine (Pinus sylvestris), silver birch
(Bet-ula pubescens), pend(Bet-ular birch (Bet(Bet-ula pend(Bet-ula), rowan (Sorbus aucuparia) and oak
(Quercus robur) were surveyed.
The definition of browsing pressure was the proportion of last year’s shoots browsed during winter. This was surveyed by estimating the number of freshly browsed shoots and the total number of shoots. Browsing pressure was assessed on the tree closest to the center point with a height between 0.3–3.0 meters for each tree species.
2.3 Statistical analysis
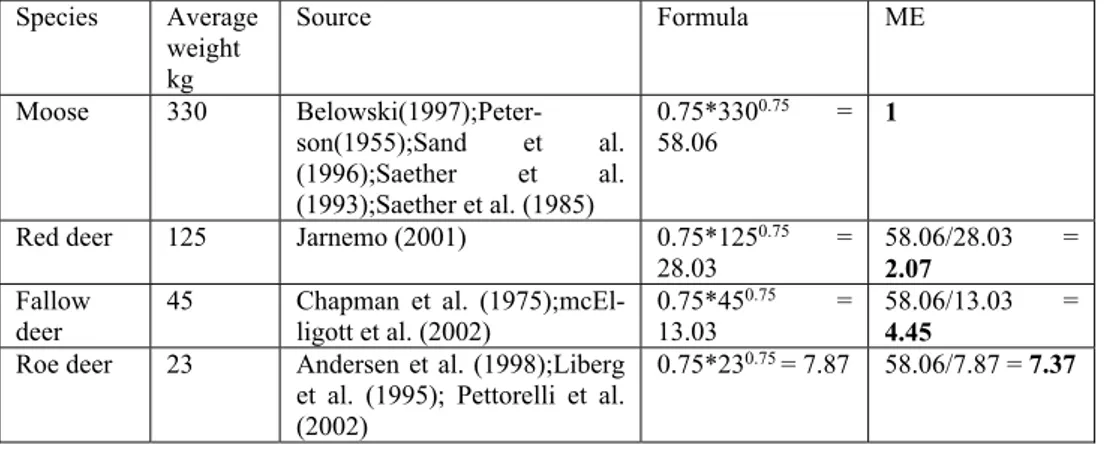
Generalized linear mixed models (GLMM) were used to analyze the species-brows-ing relationship. GLMMs are a mixture between linear mixed models and general-ized linear models, and are preferably used for analysis of data that defy normal statistic procedures (Bolker et al. 2009). I transformed all densities to moose equiv-alents by using a formula that includes female body weight (table 2). After transfor-mation of the ungulate densities into moose equivalents the variables could be uti-lized together in statistical models. Variables included in the models were; i) number of ungulate species present, ii) total density of the 4 ungulates expressed in moose equivalents, iii) combined ungulate densities in moose equivalents based on feeding strategy, iv) browsing pressure for the 5 different tree species and weighted
brows-ing pressure for all tree species combined.
Browsing pressure was used as response variable, whereas species identities were used as fixed variables. Year, area and tract were set as random effects with tract nested within area. A logit link function with binomial distribution was used. Pres-ence of multicollinearity was investigated with the variance inflation factor (VIF),
descriptive statistics were calculated and significance was tested with two sample t-test.
Models were compared based on Acaice information critera (AIC) which takes into account the ability of the model to fit the data, it is based both on model simplicity and goodness of fit; a lower AIC indicate a better model. I elected to use the cut-off points for ΔAIC from Burnham et al. (2004) Where ΔAIC = 10 is used as final limiting factor for candidate models, model support is rated depending on ΔAIC where ΔAIC<2 indicate models with very strong support, models with ΔAIC be-tween 2-4 were considered to have strong support, models with ΔAIC bebe-tween 4-7 were considered to have moderate support, models with ΔAIC between 7-10 were considered to have weak support, finally models with ΔAIC>10 were considered to have no support (Appendix 2). AIC-weights were also calculated and used for ex-planatory purposes. Models were created in the statistical program R-studio (R core team 2017) using the package lme4.
Table 2. Assumptions and calculations for transformations to moose equivalents (ME) in order to
include the variables in the same models.
Species Average weight kg Source Formula ME Moose 330 Belowski(1997);Peter-son(1955);Sand et al. (1996);Saether et al. (1993);Saether et al. (1985) 0.75*3300.75 = 58.06 1
Red deer 125 Jarnemo (2001) 0.75*1250.75 =
28.03 58.06/28.03 2.07 = Fallow
deer 45 Chapman et al. (1975);mcEl-ligott et al. (2002) 0.75*45
0.75 =
13.03 58.06/13.03 4.45 = Roe deer 23 Andersen et al. (1998);Liberg
et al. (1995); Pettorelli et al. (2002)
3.1 Main findings
The composition of the four ungulate species at tract scale varied between the areas for the duration of the study-period. Öster Malma (Figure 4) exhibited a signifi-cantly higher (two sample t-test – (t (337) =8.62, p <0.0005)) richness of ungulate species than Växjö (Figure 5).
Figure 4. Number of tracts with numbers of different ungulate species recorded for the years
2012-2015 for Öster Malma.
0 5 10 15 20 25 30 35 2012 2013 2014 2015 Num ber of tracts 4 3 2 1 0
3 Results
Figure 5. Number of tracts with numbers of different ungulate species recorded for the years
2012-2015 for Växjö.
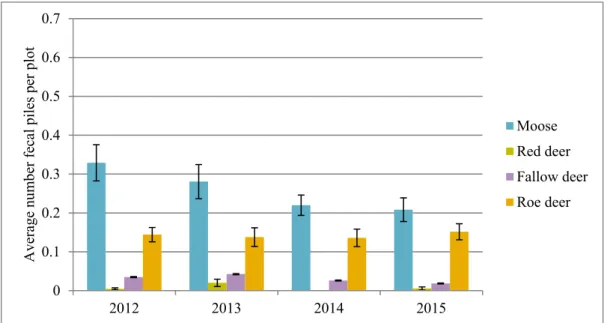
The main difference for the fecal dropping piles found was the significantly higher presence of red deer (two sample t-test (t(174) =7.11, p-value <0.0005)) and fallow deer (two sample t-test (t(182)=9.30, p-value <0.0005)) in the Öster Malma area (Figure 6) compared with the Växjö area (Figure 7) where both species occurs to a much lesser extent.
Figure 6. Average number of fresh piles per year and ungulate species on plot level in Öster Malma
2012 – 2015, standard error visualized per bar.
0 5 10 15 20 25 30 35 2012 2013 2014 2015 Num ber of tracts
Species richness on tract level Växjö 2012-2015
4 3 2 1 0 0 0.1 0.2 0.3 0.4 0.5 0.6 0.7 2012 2013 2014 2015 Average num ber f
ecal piles per plot
Moose Red deer Fallow deer Roe deer
Figure 7. Average number of fresh piles per year and species on plot level in Växjö 2012 – 2015,
standard error visualized per bar
The overall weighted browsing pressure for all tree species was significantly higher (two sample t-test (t(204) = 4.37, p-value <0.0005)) in the Öster Malma area than the Växjö area; the yearly variation was higher in the Växjö area (Figure 8).
Figure 8. Weighted browsing pressure for all tree species combined, standard error visualized per
bar. 0 0.1 0.2 0.3 0.4 0.5 0.6 0.7 2012 2013 2014 2015 Average num ber f
ecal piles per plot
Moose Red deer Fallow deer Roe deer 0 0.02 0.04 0.06 0.08 0.1 2012 2013 2014 2015 W ei ght ed browsi ng pressure Öster malma Växjö
In Öster Malma, pine browsing pressure decreased during the study period whereas the deciduous browsing pressure was generally stable with the exception of oak dur-ing 2014 (figure 9).
Figure 9. Average browsing pressure for each tree species at tract scale Öster Malma 2012-2015,
standard error visualized per bar.
In Växjö, the tree species specific browsing pressure during the study period had a larger variation between species and year than Öster Malma during the same period (figure 10).
Figure 10. Average browsing pressure for each tree species at tract scale Växjö 2012-2015, standard
error visualized per bar.
0 0.1 0.2 0.3 0.4 0.5 2012 2013 2014 2015 B rowsi ng pressure Pine Silver Birch Pendular Birch Rowan Oak 0 0.1 0.2 0.3 0.4 0.5 2012 2013 2014 2015 Browsing pressure Pine Silver Birch Pendular Birch Rowan Oak
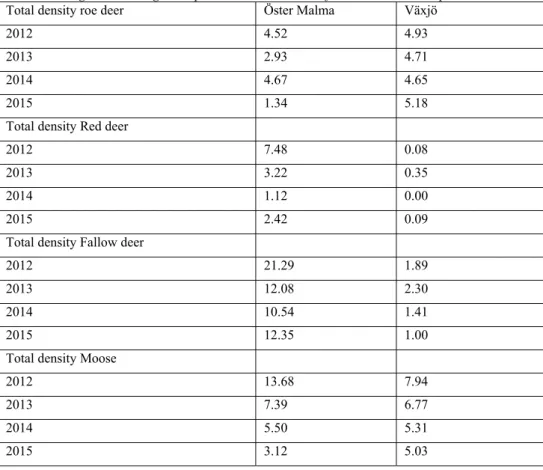
There was a relatively high density of fallow deer (10.54 – 21.29 units of moose-equivalent per 1000 hectares) in the Öster Malma study-area for the entire study period and a high density of moose in Öster Malma during year 2012 (13.68 animals per 1000 hectares) (Table 3).
Table 3. Average number ungulates per 1000 hectares, transformed into moose equivalents
Total density roe deer Öster Malma Växjö
2012 4.52 4.93
2013 2.93 4.71
2014 4.67 4.65
2015 1.34 5.18
Total density Red deer
2012 7.48 0.08
2013 3.22 0.35
2014 1.12 0.00
2015 2.42 0.09
Total density Fallow deer
2012 21.29 1.89
2013 12.08 2.30
2014 10.54 1.41
2015 12.35 1.00
Total density Moose
2012 13.68 7.94
2013 7.39 6.77
2014 5.50 5.31
2015 3.12 5.03
3.2 Statistical analysis
In total 106 GLMM-models were created to explain the browsing data (Appendix 2). Each model was investigated for multicollinearity, no evidence of multicolline-arity was found in any of the models. Out of the 106 models I selected 39 models as candidate models as having a higher probability of explaining the data (Appendix 1) Out of the candidate models I selected one or several models considered to be the strongest model (Table 5) or having an equally strong probability to explain the data (Table 4). Support codes - ΔAIC; 0 – 2 ****, 2-4 ***, 4-7 **, 7-10*.
****
Model Variables df AIC ΔAIC Support Relative Likelihood Aic weight
modelv Richness+Moose+Reddeer 7 4428,9 0 **** 1 0,551
modelu Richness+Totaldensity+Moose+Reddeer 8 4429,3 0,412 **** 0,814 0,449
model Variables df AIC ΔAIC Support Relative Likelihood AIC-weight
modelq1 Intermediate+Moose 6 2518,2 0 **** 1 0,443
modeln1 Moose+Red+Fallow 7 2520,2 1,975 **** 0,373 0,165
Model Variable df AIC ΔAIC Support Relative Likelihood AIC-weight
modelv2 Moose+Roedeer+Totaldensity 7 2908,5 0 **** 1 0,234
modelu2 Roedeer+Totaldensity 6 2908,6 0,066 **** 0,968 0,226
modelk2 Moose + Roe + Red + Fallow 8 2909,2 0,645 **** 0,724 0,169
modelo2 Moose+Roe+Fallow 7 2910,1 1,555 **** 0,460 0,107
modelt2 Roe+Totaldensity+Richness 7 2910,2 1,639 **** 0,441 0,103 models2 Moose+Roe+Totaldensity+Richness 8 2910,4 1,846 **** 0,397 0,093
model Variables df AIC ΔAIC Support Relative Likelihood Aic-weight modelu3 Moose+Reddeer+Roedeer+Totaldensity+Richness 9 4987,4 0 **** 1 0,693 modelw3 Reddeer+Fallowdeer+Totaldensity+Richness 8 4989,1 1,647 **** 0,439 0,304
model Variables df AIC ΔAIC Support Relative Likelihood AIC-weight
modelg4 Moose 5 1315,3 0 **** 1 0,193
modelc4 Total density 5 1316,1 0,799 **** 0,671 0,130
modelf4 Concentrate 5 1316,1 0,849 **** 0,654 0,126
modelo4 Moose+Totaldensity 6 1316,9 1,569 **** 0,456 0,088
modeln4 Moose+Reddeer 6 1317,2 1,906 **** 0,386 0,075
modelp4 Moose+Richness 6 1317,3 1,987 **** 0,370 0,072
model Variable df AIC ΔAIC Support Relative Likelihood AIC-weight
modelp5 Richness+Moose+Red 7 1691,6 0 **** 1 0,730 modelo5 Totaldensity+Richness+Moose+Red 8 1693,6 1,99 *** 0,370 0,270 Oak Rowan Pendular birch Silver Birch Pine All tree species
Table 5. The final GLMM-model fitted to the browsing data.
Response Model# Variable Estimate Std.error Pr(>|z|) Weighted all
browsing pressure
Model-v (Intercept) -3.891 0.473 <2e-16*** Richness -0.181 0.029 8.69e-10***
Moose 0.040 0.003 <2e-16***
Red deer -0.041 0.005 2.16e-12*** Pine browsing
pressure
Model-q1 (Intercept) -2.294 0.216 <2e-16*** Intermediate 0.015 0.003 4.84e-06***
Moose 0.011 0.005 0.0223*
Silver Birch
brows-ing pressure Model-v2 (Intercept) -4.526 0.468 <2e-16***
Moose 0.014 0.009 0.144
Roe deer -0.102 0.011 <2e-16*** Total density 0.026 0.006 2.12e-05*** Pendular Birch
browsing pressure Model-u3 (Intercept) -2.763 0.397 3.17e-12***
Moose 0.036 0.003 <2e-16***
Red deer -0.044 0.006 4.61e-12*** Roe deer 0.022 0.006 0.0002*** Total Density 0.008 0.002 9.92e-05*** Richness -0.414 0.035 <2e-16*** Rowan browsing
pressure
Model-g4 (Intercept) -1.953 0.456 1.89e-05***
Moose 0.019 0.008 0.0299*
Oak browsing pres-sure
Model-p5 (Intercept) -2.037 0.431 2.33e-06*** Richness -0.454 0.076 3.31e-09***
Moose 0.073 0.017 2.24e-05***
Red deer -0.059 0.013 2.10e-05*** The combined average weighted browsing pressure for all tree species could best be explained by a model containing ungulate species richness, moose and red deer. For pine I found that including moose and intermediate grazers (red deer and fallow deer) in my model explained most of the variation in the data. For silver birch I found that most of the variation could be explained by a model containing moose,
roe deer and total density. For pendular birch I found that the model that best
ex-plains the variation included moose, red deer, roe deer, total density and ungulate
species richness. For rowan I found that the variation could be explained best by
only including the variable moose in my model. For oak I found that including
ungulate species richness, moose and red deer in my model could best explain the
This study investigated the impact of multi-species ungulate communities on brows-ing pressure in boreal forests and semi-open landscapes in southern Sweden in order to gain knowledge of factors contributing to browsing pressure with focus on po-tential interspecific or intraspecific competition where knowledge previously have been limited.
4.1 Is browsing pressure on tree saplings more strongly
related to the number of ungulate species than to their
combined densities?
The ungulate species richness-variable had a negative estimate in all three models where it is present (model-v, model-u3 and model-p5) This goes against my expec-tation that species richness could be an contributing factor to increasing browsing pressure, on the other hand I found that species richness is still to be considered an important variable in explaining browsing pressure as a negative estimate could mean that a higher interspecific competition might cause a decrease in browsing pressure, this is supported by previous studies that show interspecific competition as an important factor on ungulate condition (Stewart et al. 2005) and resource par-titioning (Gordon et al. 1989). The total density - variable was included in two mod-els (model-v2 and model-u3) where it has a positive effect on browsing pressure in each one, which is not very surprising given that it is an established fact that brows-ing pressure increases with increasbrows-ing ungulate densities on a habitat-specific scale (Bergquist et al. 2002; Månsson 2007; Tremblay et al. 2007).
4.2 To what extent is browsing pressure influenced by the
identity of ungulate species?
In four out of six models there are indications that presence of several ungulate spe-cies with different feeding strategy will have an impact on browsing pressure. I
4 Discussion
found clear evidence in only one model (Model-q1 with pine browsing as response variable) where intermediate grazers had a slightly larger positive estimate than
moose. In six out of six models I found that moose had a relatively large, positive
estimate, which is in line with previous studies (Bergquist et al. 2001) that moose is responsible for a considerable part of the browsing carried out by ungulates in
Swe-den
.
4.3 Evaluation of the methods used in this study
The models presented in table 5 as the final GLMM-models are considered the strongest, the competing models with ΔAIC<2 should not be regarded as having exactly the same explanatory power as the model with ΔAIC = 0, but they should be regarded as having a significant possibility to explain the data while not being the strongest model. AIC-weights are defined as the probability that an model is the actually best model to explain the data compared to the next one, in this case, the strongest model (model-v) explaining the total weighted browsing pressure have an AIC-weight of 0.55, that can be regarded as model-v being 5.5 times more likely to explain the data than the second best model.
When modelling reality there are always simplifications and assumptions that might create a misleading result. In this case a number of assumptions that could have a large effect on the final result have been made. Relevant assumptions to be aware of relating to the survey method and basic data preparation are: the defecation rate, the assumed accumulation time and the assumed average weight for ungulate fe-males used to calculate moose equivalents.
All assumptions have been scientifically based as far as possible and to the authors’ greatest knowledge. The calculations into moose equivalents were made in order to be able to compare ungulate species of different size, unfortunately, the formula does not correct for size difference, which in this case is the higher energy need per kg body mass that a smaller ungulate need in comparison with a larger one. The defecation rate is assumed to be constant over the entire area and time period, the correct defecation rate is very hard to estimate accurately since it is depending on local conditions, the climate and other factors. Aerial inventories could be combined with pellet inventories to calibrate and improve the method (Rönnegård et al.2008) but then the original reason of why the method was chosen would be ignored and the profits disregarded.
The choice of GLMM to model the browsing – ungulate presence relationship was made with the structure of the data in mind, to shoehorn data into classical statistical procedures is not recommended and will likely result in pseudo-replication (Bolker et al. 2009). When modelling with GLMM we include random factors which are factors related to the experimental design that might have an effect on the result while not being what we are interested in investigating
4.4 Conclusion
Ungulate species richness, ungulate density and ungulate feeding strategy all have a significant effect on browsing pressure. Hunters and foresters need to hold the moose population on a sustainable level while keeping in mind that there are other factors such as interspecific competition and ungulate species richness which will have a significant effect on browsing pressure. Another challenge is to differentiate between ecological systems with different ungulate species richness depending on site in the country; a moose management system adapted to northern Sweden might not work in southern Sweden where previously described factors might interfere. The result from my thesis might be valuable when predicting areas where occur-rence of multi-species ungulate communities might be a contributing factor to un-gulate browsing. The result from my thesis can also be valuable when predicting effects from introducing ungulate species to new areas in Sweden, one example would be evaluation of a possible whitetail deer establishment in Sweden. Whitetail deer is a concentrate selector and is thus partially included in this study by extension.
Acknowledgements
I would like to thank my supervisors Therese Löfroth and Lars Edenius and my co-supervisor Joris Cromsigt at the department of wildlife, fish and environmental stud-ies for their support and feedback!
I would also like to thank Jaime Uria Diez and Hilda Edlund at the department for forest resource management for their statistical support and finally I would like to thank everyone involved with the field work between the years 2012 – 2015. The environmental monitoring program (Foma, SLU) financed the Öster Malma and Växjö studies.
References
Andersen, R., & Linnell, J. D. (1998). Ecological correlates of mortality of roe deer fawns in a preda-tor-free environment. Canadian Journal of Zoology, 76(7), 1217-1225.
Angelstam, P., Wikberg, P. E., Danilov, P., Faber, W. E., & Nygren, K. (2000). Effects of moose density on timber quality and biodiversity restoration in Sweden, Finland, and Russian Karelia. Alces, 133-146.
Apollonio, M., Andersen, R., & Putman, R. (Eds.). (2010). European ungulates and their management
in the 21st century. Cambridge University Press.
Bergström, R. & Danell, K. 2009 Trenden tydlig: Mer vilt idag än för 50 år sedan. Aktuell forskning om vilt, fisk och förvaltning, 2009(4), Institutionen för vilt, fisk och miljö, Sveriges Lantbruksu-niversitet, Umeå.
Bergqvist, G., Bergström, R., & Edenius, L. (2001). Patterns of stem damage by moose (Alces alces) in young Pinus sylvestris stands in Sweden. Scandinavian Journal of Forest Research, 16(4), 363-370.
Bergquist, J., Björse, G., Johansson, U. & Langvall, O., (2002). Vilt och skog -Information om aktuell forskning vid SLU om vilt och dess påverkan på skogen och skogsbruket. Sveriges lantbruksuni-versitet.
Bergquist, J., Kalén, C. & Berglund, H. (2011). Hjortdjurens inverkan på tillväxt av produktionsträd och rekrytering av betesbegärliga trädslag. Jönköping: Skogsstyrelsen
Bergquist, J., 2009. Skogsproduktion i stormområdet, Jönköping: Skogsstyrelsen
Belovsky, G. E. (1978). Diet optimization in a generalist herbivore: the moose. Theoretical population
biology, 14(1), 105-134.
Bolker, B. M., Brooks, M. E., Clark, C. J., Geange, S. W., Poulsen, J. R., Stevens, M. H. H., & White, J. S. S. (2009). Generalized linear mixed models: a practical guide for ecology and evolution.
Trends in ecology & evolution, 24(3), 127-135.
Boman, M., Mattsson, L., Ericsson, G. & Kriström, B. (2011). Moose hunting values in Sweden now and two decades ago: The Swedish hunters revisited. Environmental and Resource Economics 50(4), 515-530
Burnham, K. P., & Anderson, D. R. (2004). Multimodel inference: understanding AIC and BIC in model selection. Sociological methods & research, 33(2), 261-304.
Cederlund and Markgren, 1987;G. Cederlund, G. MarkgrenThe development of the Swedish moose population 1970-1983 Swedish Wildl. Res. Suppl., 1 (1987), pp. 55-62.
Chapman, D., & Chapman, N. (1975). Fallow deer: their history, distribution, and biology. Dalton. Eckervall, A. (2007). Comparison of plot survey and distance sampling as pellet group counts for deer
in Sweden. Honours thesis
Edenius, L. (2012). Referensområden för klövviltförvaltning i södra Sverige-Årsrapport 2012. SLU, Project: Skog, Fortlöpande miljöanalys(Foma).
Edenius, L. (2012b). Referensområden för klövviltsförvaltning i södra Sverige. Sveriges Lantbruksu-niversitet. https://www.slu.se/institutioner/vilt-fisk-miljo/miljoanalys/referensomraden-for-klov-viltforvaltning-i-sodra-sverige/ (Retrieved 2018-07-28)
Edenius, L., Bergman, M., Ericsson, G., & Danell, K. (2002). The role of moose as a disturbance factor in managed boreal forests. Silva Fennica, 36(1), 57-67.
Ericsson, G., Edenius, L., & Sundström, D. (2001). Factors affecting browsing by moose (Alces alces L.) on European aspen (Populus tremula L.) in a managed boreal landscape. Ecoscience, 8(3), 344-349
Ericsson, S., Östlund, L. & Axelsson, A.-L. (2000). A forest of grazing and logging: Deforestation and reforestation history of a boreal landscape in central Sweden. New Forests 19: 227-240
Fridman, J., Lundström, A., Ottosson Löfvenius, M. & Valinger, E., 2006. Analys av stormskador efter Gudrun. SLU, Fakulteten för Skogsvetenskap, Umeå. Fakta Skog
Gordon, I. J., & Illius, A. W. (1989). Resource partitioning by ungulates on the Isle of Rhum.
Oecolo-gia, 79(3), 383-389.
Hofmann, R. R. (1989). Evolutionary steps of ecophysiological adaptation and diversification of ru-minants: a comparative view of their digestive system. Oecologia, 78(4), 443-457.
från Högskolan i Hedmark, Norge och Grimsö forskningsstation, SLU, Riddarhyttan.
Jarnemo, A. (2001). Artfakta kronvilt (kronhjort) Cervus elaphus. Rev. Anders Jarnemo 2005, 2011 © ArtDatabanken, SLU 2010.
Jarnemo A., Bergström R. & Söderberg B. 2010. Spillningsfrekvens samt nedbrytning av spillning hos kronvilt Cervus elaphus. Svenska Jägareförbundet. Viltforum 2/2010.
Kindberg, J., Holmqvist, N. & Bergqvist, G. (2010). Årsrapport Viltövervakningen 2007/2008 (Annual wildlife surveillance report). Öster-Malma: Swedish Association for Hunting and Wildlife Man-agement.
Liberg, O., & Wahlström, K. (1995). Habitat stability and litter size in the Cervidae; a comparative analysis. Wahlström, K. Natal dispersal in roe deer-an evolutionary perspective. Ph. D. thesis.
University of Stockholm.
Lönnstedt, L. (1987). Avverkningsintensitet samt privat- och socioekonomiska beslutsvarialbler hos
olika småskogsägarkategorier. I: Garpenbergsseminariet om skogsbrukets potential för
arbetstill-fällen och försörjning på landsbygden. 113-122. Garpenberg: Sveriges Lantbruksuniversitet, Svenska sällskapet för landbygdsutveckling.
Massei, G., & Genov, P. V. (1998). Fallow deer (Dama dama) winter defecation rate in a Mediterra-nean area. Journal of Zoology, 245(2), 209-211.
Matala, J., & Uotila, A. (2013). Diurnal defecation rate of moose in Southwest Finland. Alces: A
Jour-nal Devoted to the Biology and Management of Moose, 49, 155-161.
Mattila, O., & Roos, A. (2014). Service logics of providers in the forestry services sector: evidence from Finland and Sweden. Forest policy and economics, 43, 10-17.
Mathisen, K. M. (2011). Indirect Effects of Moose on the Birds and the Bees. Swedish University of Agricultural Sciences.
Mayle, A. B., Doney, J., Lazarus, G., Peace, A. J. & Smith, D. E. (1996). Fallow deer (Dama dama) defecation rate and its use in determining population size. Suppl. Ric. Biol. Selvaggina 25: 63±78. McElligott, A. G., Altwegg, R., & Hayden, T. J. (2002). Age-specific survival and reproductive
prob-abilities: evidence for senescence in male fallow deer (Dama dama). Proceedings of the Royal
Society of London B: Biological Sciences, 269(1496), 1129-1137.
Mitchell, B. (1984). The defecation frequencies of red deer in different habitats. Annual report of the
Institute of Terrestrial Ecology, 1983, 15-17.
Mitchell B., Rowe, J. J., Ratcliffe, P., Hinge, M., 1985, Defecation frequency in roe deer (Capreolus capreolus) in relation to the accumulation rates of faecal deposits, Journal of Zoology London, vol. 207, 1-7
Månsson, J., Roberge, J. M., Edenius, L., Bergström, R., Nilsson, L., Lidberg, M., ... & Ericsson, G. (2015). Food plots as a habitat management tool: forage production and ungulate browsing in ad-jacent forest. Wildlife biology, 21(5), 246-253.
Månsson, J., Kalén, C., Kjellander, P., Andrén, H., & Smith, H. (2007). Quantitative estimates of tree species selectivity by moose (Alces alces) in a forest landscape. Scandinavian Journal of Forest
Research, 22(5), 407-414.
Månsson, J. (2007). Moose management and browsing dynamics in boreal forest (Vol. 2007, No. 82). Nilsson, P., Cory, N. (2017). Skogsdata 2017. Dept. Forest Resources Management, Swedish
Univer-sity of Agricultural Sciences, Umeå.
Nichols, R. V., Cromsigt, J. P., & Spong, G. (2015). DNA left on browsed twigs uncovers bite-scale resource use patterns in European ungulates. Oecologia, 178(1), 275-284.
Peterson, R. L. (1955). North American moose. North American moose. Univ. of Toronto Press, To-ronto.
Pettorelli, N., Gaillard, J. M., Van Laere, G., Duncan, P., Kjellander, P., Liberg, O., & Maillard, D. (2002). Variations in adult body mass in roe deer: the effects of population density at birth and of habitat quality. Proceedings of the Royal Society of London B: Biological Sciences, 269(1492), 747-753.
Pfeffer, S. (2016). Comparison of three different indirect methods to evaluate ungulate population densities.
Pfeffer, S. E., Spitzer, R., Allen, A. M., Hofmeester, T. R., Ericsson, G., Widemo, F., & Cromsigt, J. P. (2017). Pictures or pellets? Comparing camera trapping and dung counts as methods for esti-mating population densities of ungulates. Remote Sensing in Ecology and Conservation. Regeringen (2009). Regeringens proposition 2009/10:239
Rönnegård, L., Sand, H., Andrén, H., Månsson, J., & Pehrson, Å. (2008). Evaluation of four methods used to estimate population density of moose Alces alces. Wildlife Biology, 14(3), 358-371. Sæther, B. E., & Heim, M. (1993). Ecological correlates of individual variation in age at maturity in
female moose (Alces alces): the effects of environmental variability. Journal of Animal Ecology, 482-489.
Sæther, B. E., & Haagenrud, H. (1985). Geographical variation in body weight and sexual size‐dimor-phism of Norwegian moose (Alces alces). Journal of Zoology, 206(1), 83-96.
Sand, H., & Cederlund, G. (1996). Individual and geographical variation in age at maturity in female moose (Alces alces). Canadian Journal of Zoology, 74(5), 954-964.
Seiler, A., Helldin, J. O., & Seiler, C. (2004). Road mortality in Swedish mammals: results of a drivers' questionnaire. Wildlife Biology, 10(3), 225-233.
Seiler, A. (2004b). Trends and spatial patterns in ungulate-vehicle collisions in Sweden. Wildlife
Biol-ogy, 10(4), 301-313.
Seiler, A., Olsson, M. and Helldin, J.O. 2011. Klövdjursolyckor på järnväg – kunskapsläge, problem-analys och åtgärdsförslag. Trafikverket publikation 2011:058. Borlänge.
Stewart, K. M., Bowyer, R. T., Dick, B. L., Johnson, B. K., & Kie, J. G. (2005). Density-dependent effects on physical condition and reproduction in North American elk: an experimental test.
Oecologia, 143(1), 85-93.
Skogsindustrierna (2015). Branschstatistik 2015
https://www.skogsindustrierna.se/skogsindu-strin/branschstatistik/
Skogsstyrelsen (2016). Bruttoavverkning. https://www.skogsstyrelsen.se/statistik Svenska jägareförbundet (2017). Viltdata. https://rapport.viltdata.se/statistik/
Sutherland, W. J., Ecological Census Techniques. Second edition (2006). Cambridge: Cambridge Uni-versity Press.
Team, R. C. (2017). R: A language and environment for statistical computing. Vienna, Austria: R Foundation for Statistical Computing; 2017.
Tremblay, J. P., Huot, J., & Potvin, F. (2007). Density‐related effects of deer browsing on the regen-eration dynamics of boreal forests. Journal of Applied Ecology, 44(3), 552-562.
Wallstedt, A. Bergqvist, J. Claesson, S. Ludvig, T. Nilsson, J. (2013). Återväxtstöd efter stormen Gud-run. Jönköping: Skogsstyrelsen (Rapport 2013:1).
Ånöstam, F. (2017). Timing of ungulate browsing and its effect on sapling height and the field layer vegetation.
Appendix 1 - Candidate models
model Variables df AIC ΔAIC Support Relative Likelihood Aic weight
modelv Richness+Moose+Reddeer 7 4428,9 0 **** 1 0,551
modelu Richness+Totaldensity+Moose+Reddeer 8 4429,3 0,41 **** 0,814 0,449
model Variables df AIC ΔAIC Support Relative Likelihood AIC-weight
modelq1 Intermediate+Moose 6 2518,2 0 **** 1 0,443
modeln1 Moose+Red+Fallow 7 2520,2 1,97 **** 0,373 0,165
modelo1 Moose+Fallow 6 2521,2 3,02 *** 0,221 0,098
modele1 Intermediate 5 2521,3 3,13 *** 0,210 0,093
modelb1 Concentrate + Intermediate 6 2521,4 3,19 *** 0,203 0,090
modelc1 Total density 5 2522,8 4,6 ** 0,100 0,044
modell1 Total density + Richness + Intermediate + Concentrate 7 2523 4,82 ** 0,090 0,040
modela1 total density + Richness 6 2524,1 5,88 ** 0,053 0,023
modelj1 Fallow 5 2527,3 9,08 * 0,011 0,005
Model Variable df AIC ΔAIC Support Relative Likelihood AIC-weight
modelv2 Moose+Roedeer+Totaldensity 7 2908,5 0 **** 1 0,234
modelu2 Roedeer+Totaldensity 6 2908,6 0,07 **** 0,968 0,226
modelk2 Moose + Roe + Red + Fallow 8 2909,2 0,64 **** 0,724 0,169
modelo2 Moose+Roe+Fallow 7 2910,1 1,56 **** 0,460 0,107
modelt2 Roe+Totaldensity+Richness 7 2910,2 1,64 **** 0,441 0,103
models2 Moose+Roe+Totaldensity+Richness 8 2910,4 1,85 **** 0,397 0,093
modelq2 Moose+Roe+Red+Fallow+Richness+Totaldensity 9 2911 2,47 *** 0,292 0,068
model Variables df AIC ΔAIC Support Relative Likelihood Aic-weight
modelu3 Moose+Reddeer+Roedeer+Totaldensity+Richness 9 4987,4 0 **** 1 0,693
modelw3 Reddeer+Fallowdeer+Totaldensity+Richness 8 4989,1 1,65 **** 0,439 0,304
model Variables df AIC ΔAIC Support Relative Likelihood AIC-weight
modelg4 Moose 5 1315,3 0 **** 1 0,193
modelc4 Total density 5 1316,1 0,8 **** 0,671 0,130
modelf4 Concentrate 5 1316,1 0,85 **** 0,654 0,126
modelo4 Moose+Totaldensity 6 1316,9 1,57 **** 0,456 0,088
modeln4 Moose+Reddeer 6 1317,2 1,91 **** 0,386 0,075
modelp4 Moose+Richness 6 1317,3 1,99 **** 0,370 0,072
modela4 total density + Richness 6 1317,8 2,48 *** 0,289 0,056
modelb4 Concentrate + Intermediate 6 1317,9 2,57 *** 0,277 0,054
models4 Totaldensity+Intermediate+Moose 7 1318,8 3,56 *** 0,169 0,033
modelj4 Fallow 5 1318,9 3,61 *** 0,165 0,032
modele4 Intermediate 5 1319,2 3,9 *** 0,142 0,027
modelh4 Roe 5 1319,2 3,95 *** 0,139 0,027
modeld4 Richness 5 1319,3 4,06 ** 0,131 0,025
modell4 Total density + Richness + Intermediate + Concentrate 7 1319,6 4,29 ** 0,117 0,023
modeli4 Red 5 1319,8 4,54 ** 0,104 0,020
modelk4 Moose + Roe + Red + Fallow 8 1320,5 5,23 ** 0,073 0,014
modelr4 Moose+Concentrate+Roedeer+Reddeer+Richness+Intermediate+Totaldensity 9 1322,1 6,84 ** 0,033 0,006
model Variable df AIC ΔAIC Support Relative Likelihood AIC-weight
modelp5 Richness+Moose+Red 7 1691,6 0 **** 1 0,730
modelo5 Totaldensity+Richness+Moose+Red 8 1693,6 1,99 *** 0,370 0,270
All tree species
Pine
Silver Birch
Pendular birch
Rowan
Appendix 2 - All models
All tree species
model Variables df AIC ΔAIC Support Relative Likelihood Aic weight
modelv Richness+Moose+Reddeer 7 4428,88 0 **** 1 5,51E-01
modelu Richness+Totaldensity+Moose+Reddeer 8 4429,29 0,412 **** 8,14E-01 4,49E-01
modelq Moose+Red 6 4464,08 35,202 2,27E-08 1,25E-08
modelk Moose + Roe + Red + Fallow 8 4466,76 37,882 5,94E-09 3,28E-09
modeln Moose + Roe + Richness 7 4473,23 44,35 2,34E-10 1,29E-10
models Richness+Concentrate+Intermediate 7 4481,15 52,268 4,47E-12 2,46E-12
modelt Richness+Concentrate 6 4481,88 52,999 3,10E-12 1,71E-12
modelg Moose 5 4513,16 84,28 5,00E-19 2,76E-19
modelo Moose+Fallow 6 4514,81 85,927 2,19E-19 1,21E-19
modelp Moose+Roe 6 4515,16 86,28 1,84E-19 1,01E-19
modelb Concentrate + Intermediate 6 4538 109,116 2,02E-24 1,11E-24
modelf Concentrate 5 4545,9 117,015 3,90E-26 2,15E-26
modela total density + Richness 6 4571,47 142,584 1,09E-31 6,02E-32
modeld Richness 5 4609,75 180,872 5,30E-40 2,92E-40
modeli Red 5 4619,56 190,675 3,94E-42 2,17E-42
modelc Total density 5 4620,62 191,734 2,32E-42 1,28E-42
modele Intermediate 5 4634,12 205,24 2,71E-45 1,49E-45
modelj Fallow 5 4639,8 210,917 1,58E-46 8,74E-47
modelh Roe 5 4640,11 211,224 1,36E-46 7,49E-47
Pine
model Variables df AIC ΔAIC Support Relative Likelihood AIC-weight
modelq1 Intermediate+Moose 6 2518,2 0 **** 1 4,43E-01
modeln1 Moose+Red+Fallow 7 2520,17 1,975 **** 3,73E-01 1,65E-01
modelo1 Moose+Fallow 6 2521,22 3,022 *** 2,21E-01 9,77E-02
modele1 Intermediate 5 2521,32 3,126 *** 2,10E-01 9,27E-02
modelb1 Concentrate + Intermediate 6 2521,38 3,187 *** 2,03E-01 8,99E-02
modelc1 Total density 5 2522,8 4,599 ** 1,00E-01 4,44E-02
modell1 Total density + Richness + Intermediate + Concentrate 7 2523,02 4,82 ** 8,98E-02 3,97E-02
modela1 total density + Richness 6 2524,08 5,883 ** 5,28E-02 2,34E-02
modelj1 Fallow 5 2527,28 9,078 * 1,07E-02 4,73E-03
modelg1 Moose 5 2536,88 18,687 8,75E-05 3,87E-05
modeli1 Red 5 2538,83 20,637 3,30E-05 1,46E-05
modelh1 Roe 5 2541,74 23,547 7,71E-06 3,41E-06
modelf1 Concentrate 5 2542,63 24,436 4,94E-06 2,19E-06
modeld1 Richness 5 2544,44 26,247 2,00E-06 8,84E-07
Silver Birch
Model Variable df AIC ΔAIC Support Relative Likelihood AIC-weight
modelv2 Moose+Roedeer+Totaldensity 7 2908,53 0 **** 1 2,34E-01
modelu2 Roedeer+Totaldensity 6 2908,59 0,066 **** 9,68E-01 2,26E-01
modelk2 Moose + Roe + Red + Fallow 8 2909,17 0,645 **** 7,24E-01 1,69E-01
modelo2 Moose+Roe+Fallow 7 2910,08 1,555 **** 4,60E-01 1,07E-01
modelt2 Roe+Totaldensity+Richness 7 2910,17 1,639 **** 4,41E-01 1,03E-01
models2 Moose+Roe+Totaldensity+Richness 8 2910,37 1,846 **** 3,97E-01 9,28E-02 modelq2 Moose+Roe+Red+Fallow+Richness+Totaldensity 9 2910,99 2,465 *** 2,92E-01 6,81E-02
modeln2 Moose+Fallow 6 2979,19 70,659 4,54E-16 1,06E-16
modelh2 Roe 5 2985,45 76,917 1,98E-17 4,64E-18
modelg2 Moose 5 2986,64 78,108 1,09E-17 2,56E-18
modell2 Total density + Richness + Intermediate + Concentrate 7 3001,17 92,638 7,65E-21 1,79E-21
modele2 Intermediate 5 3007,33 98,8 3,51E-22 8,21E-23
modelb2 Concentrate + Intermediate 6 3008,06 99,534 2,43E-22 5,69E-23
modela2 total density + Richness 6 3011,74 103,216 3,86E-23 9,02E-24
modelc2 Total density 5 3016,76 108,227 3,15E-24 7,37E-25
modeli2 Red 5 3020,83 112,299 4,12E-25 9,62E-26
modelp2 Concentrate+Fallowdeer 6 3027,95 119,419 1,17E-26 2,73E-27
modelj2 Fallow 5 3029,77 121,243 4,70E-27 1,10E-27
modelf2 Concentrate 5 3035,52 126,992 2,65E-28 6,20E-29
Pendular birch
model Variables df AIC ΔAIC Support Relative Likelihood Aic-weight modelu3 Moose+Reddeer+Roedeer+Totaldensity+Richness 9 4987,44 0 **** 1 6,93E-01 modelw3 Reddeer+Fallowdeer+Totaldensity+Richness 8 4989,09 1,647 **** 4,39E-01 3,04E-01 modelx3 Moose+Reddeer+Totaldensity+Richness 8 4998,56 11,125 3,84E-03 2,66E-03 modelr3 Moose+Reddeer+Richness 7 5019,46 32,018 1,12E-07 7,73E-08 modelp3 Richness+Concentrate 6 5031,21 43,768 3,13E-10 2,17E-10 modell3 Total density + Richness + Intermediate + Concentrate 7 5032,53 45,092 1,62E-10 1,12E-10
modelq3 Moose+Reddeer 6 5120,35 132,914 1,37E-29 9,53E-30
modelk3 Moose + Roe + Red + Fallow 8 5123,52 136,078 2,83E-30 1,96E-30 modela3 total density + Richness 6 5161,98 174,54 1,26E-38 8,71E-39
modelg3 Moose 5 5183,72 196,283 2,39E-43 1,65E-43
modeln3 Moose+Fallow 6 5185,62 198,176 9,26E-44 6,42E-44
modelb3 Concentrate + Intermediate 6 5205,6 218,162 4,23E-48 2,93E-48
modelf3 Concentrate 5 5209,78 222,342 5,24E-49 3,63E-49
modeld3 Richness 5 5236,77 249,333 7,21E-55 5,00E-55
modelc3 Total density 5 5314,85 327,414 8,00E-72 5,54E-72
modeli3 Red 5 5317,76 330,325 1,87E-72 1,29E-72
modele3 Intermediate 5 5333,95 346,507 5,71E-76 3,96E-76
modelh3 Roe 5 5334,98 347,536 3,42E-76 2,37E-76
modelj3 Fallow 5 5338,64 351,201 5,47E-77 3,79E-77
Rowan
model Variables df AIC ΔAIC Support Relative Likelihood AIC-weight
modelg4 Moose 5 1315,29 0 **** 1 1,93E-01
modelc4 Total density 5 1316,08 0,799 **** 6,71E-01 1,30E-01 modelf4 Concentrate 5 1316,13 0,849 **** 6,54E-01 1,26E-01 modelo4 Moose+Totaldensity 6 1316,85 1,569 **** 4,56E-01 8,82E-02 modeln4 Moose+Reddeer 6 1317,19 1,906 **** 3,86E-01 7,45E-02 modelp4 Moose+Richness 6 1317,27 1,987 **** 3,70E-01 7,16E-02 modela4 total density + Richness 6 1317,77 2,482 *** 2,89E-01 5,59E-02 modelb4 Concentrate + Intermediate 6 1317,85 2,568 *** 2,77E-01 5,35E-02 models4 Totaldensity+Intermediate+Moose 7 1318,84 3,559 *** 1,69E-01 3,26E-02
modelj4 Fallow 5 1318,89 3,608 *** 1,65E-01 3,18E-02
modele4 Intermediate 5 1319,19 3,905 *** 1,42E-01 2,74E-02
modelh4 Roe 5 1319,24 3,953 *** 1,39E-01 2,68E-02
modeld4 Richness 5 1319,35 4,062 ** 1,31E-01 2,54E-02
modell4 Total density + Richness + Intermediate + Concentrate 7 1319,57 4,289 ** 1,17E-01 2,26E-02
modeli4 Red 5 1319,82 4,536 ** 1,04E-01 2,00E-02
modelk4 Moose + Roe + Red + Fallow 8 1320,51 5,229 ** 7,32E-02 1,41E-02 modelr4 Moose+Concentrate+Roedeer+Reddeer+Richness+Intermediate+Totaldensity 9 1322,13 6,842 ** 3,27E-02 6,32E-03
Oak
model Variable df AIC ΔAIC Support Relative Likelihood AIC-weight
modelp5 Richness+Moose+Red 7 1691,57 0 **** 1 7,30E-01
modelo5 Totaldensity+Richness+Moose+Red 8 1693,56 1,99 *** 3,70E-01 2,70E-01 modelq5 Richness+Moose+Red 6 1707,41 15,845 3,62E-04 2,65E-04 modelk5 Moose + Roe + Red + Fallow 8 1724 32,43 9,08E-08 6,62E-08 modell5 Total density + Richness + Intermediate + Concentrate 7 1734,17 42,604 5,61E-10 4,09E-10
modelr5 Moose+Red 6 1737,03 45,461 1,34E-10 9,81E-11
modela5 total density + Richness 6 1739,3 47,732 4,32E-11 3,15E-11
modelg5 Moose 5 1750,73 59,161 1,42E-13 1,04E-13
modeld5 Richness 5 1753,57 62,002 3,44E-14 2,51E-14
models5 Richness+Reddeer 6 1754,47 62,908 2,19E-14 1,60E-14
modelh5 Roe 5 1775,04 83,479 7,46E-19 5,45E-19
modelf5 Concentrate 5 1777,54 85,97 2,15E-19 1,57E-19
modelb5 Concentrate + Intermediate 6 1779,5 87,93 8,06E-20 5,88E-20
modelc5 Total density 5 1780,28 88,718 5,43E-20 3,97E-20
modelj5 Fallow 5 1780,85 89,282 4,10E-20 2,99E-20
modeli5 Red 5 1782,53 90,969 1,76E-20 1,29E-20