IS THERE ECONOMIC
CONVERGENCE IN THE EU?
The case of the 2004 and 2007 expansions
Bachelor’s thesis within Economics
Authors: Maria-Desislava Klimentova Julija Firsova
Tutor: Johan Klaesson, Mark Bagley Jönköping International Business School Jönköping May 2015
i
Bachelor’s Thesis in Economics
Title: Is there economic convergence in the EU? The case of the 2004 and 2007 expansions Authors: Maria-Desislava Klimentova, Julija Firsova
Tutor: Johan Klaesson, Mark Bagley
Date: [2015-05-11]
Subject terms: Convergence, EU, Solow growth, factors of convergence, speed of convergence
Abstract
One of the main objectives of the European Union is the economic convergence between member countries. In the following paper we examine how this objective has been met in the case of two of the most recent expansions of the union (in 2004 and 2007) for the periods 2001-2006 and 2001-2012. The model developed in this paper aims to find evidence for convergence, as well as determine some important causing factors of it. Furthermore, we look at the different speeds of convergence between the more recent and the older EU members. Our empirical work shows that convergence is present in the European Union in both periods discussed in the paper and has been faster in the group of new member states in the period 2001-2006. Moreover, we have concluded that migration turnover is significant factor fostering convergence, while the effect of corruption is ambiguous.
ii
Contents
1 INTRODUCTION ... 1 2 THEORETICAL BACKGROUND ... 3 2.1 Convergence ... 3 2.2 The EU ... 52.3 Monopolistic competition model ... 6
3 EMPIRICAL BACKGROUND ... 8
4 HYPOTHESES ... 11
5 METHOD ... 12
6 EMPIRICAL FINDINGS ... 14
6.1 Economic growth in the EU ... 14
6.2 Convergence test ... 16
6.3 Factors of convergence ... 17
6.4 Difference between new and old member states ... 18
7 CONCLUSION ... 22
REFERENCES ... 24
1
1 INTRODUCTION
Economic convergence is one of the main political ideas behind the European Union. In Article 158 of the Amsterdam treaty of 1997 is stated:
“In order to promote its overall harmonious development, the Community shall develop and pursue its actions leading to the strengthening of its economic and social cohesion. In particular, the Community shall aim at reducing disparities between the levels of development of the various regions and the backwardness of the least favored regions or islands, including rural areas.” (European Commission. DG Regional Policy, 2003, p. 3)
It is a clear objective for the new member states to reach the level of economic development of older members. This is also of huge impotence for the stability of the Union, since extensive differences in living standards can disturb the normal economic and cultural development of the area. When a new country enters the Union boarders towards other member countries open up, allowing new member states to benefit and to “catch up” with the wealthier countries in the union. This paper focuses on the expansions of the EU in 2004 and 2007, when twelve new countries joined. This is a unique expansion for the Union, not only because of its scope, but also since it is the first time countries with considerably less developed economies entered. This makes the issue of convergence crucial for the further development of the EU, with an eventual success to failure of the countries to integrate in the common economic community having strong political implications for the future expansions of the area.
The following pages aim to investigate different aspects of economic convergence within the member countries. The first question we aim to answer is whether there is evidence for convergence between all member states for the periods 2001-2006 and 2001-2012. Moreover, the presence of convergence leads to the further question of main determinants of economic growth, and especially those factors which make some countries grow faster than others. The paper pays great amount of attention to this matter, as we believe that this information could be of huge importance in decision making regarding the economic development of the European countries. In order for this information to be more comprehensive, in this paper the countries are separated in two groups depending on the entry date in the Union. We believe that there is significant difference between what determines the economic growth in countries which have been in the economic area for a long period of time and in those who have just entered.
In the first part of this paper we present the main economic theories which can be used to explain the existence of convergence. Depending on the essence of their assumption different models find reasons for convergence in different economic factors, or even fail to explain the phenomenon at all. Considering the specifics of the case we are discussing in our paper, in the center of our research we place the Solow growth model, together with the concepts of unconditional and conditional convergence. We also present the market mechanisms, which
2
could reinforce convergence between member states. The transformation which occurs in the economy when borders are removed can be theoretically explained using the monopolistic competition model by increasing the size of the market itself, meaning an increase of demand as well as competition. Thus, we also rely on the theories of Porter, Jacob’s and Marshall-Arrow-Romer externalities.
Furthermore, we discuss the empirical background of the problem, presenting some of the main academic works which have covered the topic of convergence. Later on we use them as a base for developing a convergence model which reflects the exact purpose of our study.
Since there are a few rather different, although closely related issues in this paper, we develop our model in three stages. The first one deals with the issue of overall convergence in the European Union. We discuss the speed of convergence in the two different periods represented by the years 2006 and 2012. Later on we add explanatory variables, which aim to capture the main factors leading to convergence other than the initial GDP per capita of the countries. In the third stage of our empirical work we further expand the model by adding dummy variables representing the different groups of countries we are discussing, aiming to account for the different growth paths of the old and new member states.
The paper continues with analysis of the situation in the European Union regarding convergence in 2006 and 2012. We aim to distinguish the different phases of convergence when a new country enters the Union. The differentiation between the immediate short term adjustments and the long term changes that occur in the factors we consider fundamental for the growth of the discussed groups. The difference between the groups gives us space to draw a number of conclusions, which contain information that could be useful for political decision making regarding the development of economics in the area, and also can be the base for further research on the topic. The paper finishes with a conclusion, summarizing our findings.
3
2 THEORETICAL BACKGROUND 2.1 Convergence
In this section we discuss the major theories explaining economic convergence and on the basis of which we are going to conduct our analysis.
First, we focus our attention on the Solow growth model which can be used to illustrate convergence in the case discussed in this paper. Solow growth model is a model of economic development, which studies the changes of the capital-output ratio with the per capita availability of capital in the economy. One of the most important assumptions of this model is diminishing returns to capital (Ray, 1998). This assumption states that countries with low income per capita tend to grow at a faster pace than countries with higher income per capita (Ray, 1998). The graphical implication of it is the decreasing slope of the production function with increasing capital to labor ratio (Figure 1). In the context of convergence, diminishing returns to capital is the assumption which allows for the gap between rich and poor countries to decrease over the time through automatic market mechanisms.
Solow growth model assumes that each country has a level of capital to labor ratio, which leads to a steady state level of output per worker, meaning that if there are no exogenous shocks in the model, the productivity of the country does not change with the increase of the capital per worker. A country achieves a steady state point when it has reached its maximum potential of growth, meaning that at this level the growth is not significant anymore (Ray, 1998). Based on the underlying functions of the Solow growth model, the steady state is achieved in point k*, where the production function and the output-capital ratios intersect (Ray, 1998). It is exactly at this level of economic development, when the theory expects convergence to be present. In the case of the European Union, however, there is empirical evidence for growth in all member states, thus at this point of time it is not possible to talk about actually having the same level of income in all countries in the Union.
Nevertheless, it is clearly visible on the figure, that the slope of the production function curve (y= f(k)) in the model changes for different levels of capital per worker. This makes it possible to observe different rates at which countries grow, depending on their capital per worker ratio. We believe this is the case between older and newer members of the European Union, where there is a large gap in the economic output between countries.
4 Figure 1, Solow Growth Model
Furthermore, another reason for us to choose the Solow growth model for testing convergence between the countries recently joined the Union and the older member states is the fact that it captures the effects of technological progress. The technological progress, however, allows for better use of existing resources, leading to increase in the output. Thus, the production function of the model shifts upwards, leading to higher output per worker for any given capital per worker ratio.
We believe that joining the EU gives a country access to a large pool of knowledge, fostering innovation and increasing productivity. Since, based on the Solow growth model, we assume that technology is a common good, opening up the boarders between countries is supposed to indeed shift the production function of the new members, boosting their growth rates. Essentially, we rely on the concepts of Marshall-Arrow-Romer (MAR) and Jacob’s externalities, which explain the significance of shared knowledge at both inter and intra industry level. (Brakman et al, 2009). Moreover, the new member countries have the possibility to use the fact that in some cases the technology used in production is at a lower level than that in older member states, meaning that they are able to “copy” the technology used in the high income countries to achieve greater productivity in their production processes, thus boost their growth rates (Baumol et al, 1994). Another important component influencing the equilibrium in the Solow growth model is the investments function (i= s*y). The assumption of the model is that the savings in the economy are equal to the investments. In the modern economy, however, this seems to be a rather
5
inaccurate assumption. Financial flows between countries allow for difference in the investment and the saving rate. Countries with low capital to labour ratio are perceived as an attractive investment opportunity, since their marginal increase in productivity is significantly higher than that of countries which have high level of capital per worker. Removing the boarders between countries and on a later stage – adopting a common currency – makes it easier for foreigners to invest, increasing the capital stock of new EU members. We believe that this change in the investment can be a noteworthy factor for convergence.
However, just talking of convergence as such does not give a complete view of the phenomenon. In the literature there are different types of convergence, each of which we have reasons to believe is present in the case discussed in this paper.
Unconditional or Absolute convergence arises when countries with their average GDPs converge to one another in the long-run independently on their initial conditions (Barro et al, 1991). When we apply this to the case discussed in our paper, we can expect that all low-income countries in the European Union are going to grow faster than the rich countries, and after some time they will fully converge in their incomes and growth rates.
Another concept we use in order to get a deeper understanding about the situation between older and newer members of the European Union is that of conditional convergence. Unlike absolute convergence, it predicts that only countries with identical structural characteristics tend to converge to one another (Black, 2010). Conditional convergence is a very important idea when analyzing the economic development of the new member states in the EU. It gives us the opportunity to focus on the structural characteristics of the countries, such as institutions. Since the European Union helps its new members to develop similar structural characteristics (for example by providing guidance and enforcing certain laws), we believe that there can be a difference whether a country is a member of the Union or not. Thus, we consider that both conditional and absolute convergence go hand in hand in the case discussed in the paper, providing incentives for new member states to converge to the more wealthy ones, presumably at a faster rate.
2.2 The EU
The European Union is politico-economic union, which has its roots in the European Coal and Steel Community (ECSC) and the European Economic Community (EEC). It aims to develop a single market and ensure the free movement of people, goods, services, and capital (Barnard, 2013).
The importance of convergence for the harmonious development of the EU is emphasized by the political willingness to work for the economic and social cohesion within the Union. The main
6
tool that is established with this purpose is The Cohesion policy of the EU. It consists of number of project throughout the area, which are financed by funds such as the European Regional Development Fund (ERDF), the European Social Fund (ESF) and the Cohesion Fund. According to the budget for 2000-2006 all countries from the 2004 expansion will all (or almost all) of their regions have access to those funds (EU Cohesion policy, 2010). The same is true about the budget for the next period (2007-2013) where as possible recipients are also added Bulgaria and Romania (EU Regional policy, 2007).
Currently the Union has 28 members. In this paper we focus our attention on the biggest expansion in the history of the European Union which happened in 2004, when 10 countries became members (The Czech Republic, Estonia, Hungary, Latvia, Lithuania, Poland, Slovakia, Slovenia, Malta and Cyprus). This expansion is unique for the union not only because of its scope, but also because this was the first time when countries with significantly less developed economies entered the union.
Although they could not fulfill the necessary requirements in time in order to be part of the same expansion, three years later, in 2007, two more Eastern European countries entered – Romania and Bulgaria. For our further analysis we are going to group Bulgaria and Romania together with the countries of the 2004 expansion. We believe that the behavioral patterns of the economies of those countries are rather similar since the Bulgarian and the Romanian economies are highly historically and geographically connected to the Central and the other parts of Eastern Europe, and thus, to the countries of the 2004 expansion.
But why do countries want to join the EU? Although there are many other reasons of various natures such as cultural exchange, stability in the international relations and others, in this paper we are going to focus on the benefits which the common EU market bring to the economy of a joining country.
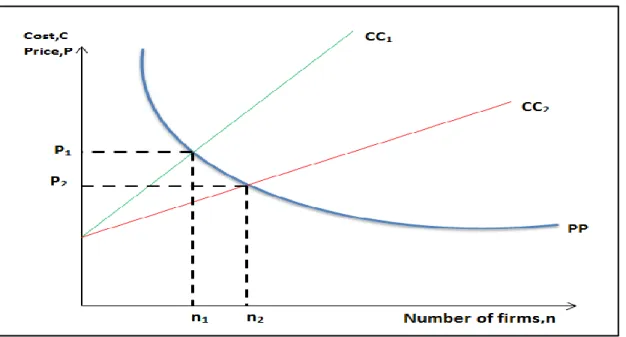
2.3 Monopolistic competition model
In order to visualize the effect of a country opening up its boarders to other member states we can use the monopolistic competition model (the CC-PP model). In this model the PP curve shows how the price is driven down by competition between firms and the CC curve represents the increase in the average costs as more firms enter the market. In the discussed model, the CC
curve takes the following form: c
S F n c Q F AC
* , where AC is the average cost, F: the
fixed costs, Q stands for quantity produced, S - for the total sales in the industry, n is the number of firms in the market and c is the marginal cost (McDowell et al,2012). Like in perfect competition, the average cost can be calculated by dividing the fixed costs among all production
7
produced in the industry. However, in monopolistic competition the average cost curve is affected by the marginal cost. If there are no exceptional assumptions made, the market sells as much production as it produces, meaning that in the monopolistic competition model the average cost can be defined as the fixed costs divided by the total sales of the whole market from all firms, plus marginal cost.
The PP curve is based on the following equation:
n b c P * 1
, where P is the price, c is the
marginal cost and n b *
1
is a measure of monopoly power, expressed by the possibility of mark-up pricing (McDowell et al,2012). According to this, the price on the market can be determined by the number of firms (the degree of competition in the market) and the marginal cost.
An increase in the market size (we assume that by becoming a member of the European Union a country becomes part of a larger common market), allows each firm to produce more and to take advantage of economies of scale, thus – to have a lower average cost (this can be observed on the figure in the shift from to ). The decrease in the price from to increases the output of the good, since consumers will demand higher quantity at the lower price (McDowell et al, 2012). Thus, the increase in the market size can be transferred into increase in production, and therefore – higher economic growth. Although the entry of new members in the European Union would mean similar effect for old members as well (since the size of the common market increases by the size of the market of the newly accepted country), the effect is much smaller for older members, accordingly to the scope of the increase of the market.
8 Moreover, the measure of monopoly power
n b *
1
is negatively related to the number of firms in the economy. This would mean that the mark up that companies can charge their customers decreases, benefitting consumers in all countries in the Union.
This would also imply that if on the market of the joining country there has been an oligopoly (or a monopoly), the entry of new firms can change the market structure to a more socially efficient one. Breaking up an oligopoly (or a monopoly) drives the price of the good down, increases consumer surplus and eliminates the deadweight loss associated with these market structures (Carlton and Perloff, 2004). As firms from other member countries penetrate the domestic markets of new members, the competition on those markets increases. Thus, after joining the union countries can exploit the benefits of Porter externalities – inter industry knowledge spillovers, which are based on the competitiveness of the market. According to Porter, companies on more competitive market tend to innovate more and to be more productive, because otherwise other firms on the market which do so could drive them out of business. (Porter, 1998). Thus, competition would lead to an increase in the technological level in the whole economy (if we assume that Porter externalities are applicable for most industries), and therefore according to the Solow growth model – to higher economic growth and convergence.
3 EMPIRICAL BACKGROUND
The topic of convergence is widely discussed in the academic world. There is not, however, a strong empirical evidence for neither the existence nor for the absence of convergence. The same is true for the causing forces of the phenomenon. Thus, it is important to present some influential papers in the field of development economics and provide a broad view of the factors which can be considered incentives for new member countries to develop faster than the more wealthy EU countries.
A number of papers discuss the importance of labour mobility when talking about convergence. Trade theories based on mobile labour always assume perfect convergence of income. In their paper, Razin and Yuen (1997) also conclude that labour mobility generates equalization of income. However, some scholars have found evidence of labour mobility being an obstacle for economic convergence, since it dampens the incentives for capital investment in the low income country, and thus lower the capital stock (Rapparport, 2005) (Faini, 1996). In the case of countries, recent members of the EU, though, it is safe to say that investments in capital do not decrease. The Union has mechanisms made to encourage investment to its less developed members, both through guidance and financial help for members having GDP per captia less than 75 % of the EU average (European Commission Directorate-General for Regional Policy, 2008). Moreover, labour mobility allows labour to move from places with high
9
unemployment to places with low unemployment. This contributes further to the convergence in the Union, since high unemployment is associated with the lack of convergence in some empirical cases (Soukiazis, 2000). In our paper, we focus on the actual migration flows occurring in the countries. We have calculated a variable that we refer to as Migration turnover as emigration divided by total population. We use this variable as a proxy for the adjustments happening in a country when it enters the EU.
Considerably less controversial is the evidence on the importance of human capital. It is considered one of the main drivers for higher economic growth and convergence. Many papers on the topic of convergence are focusing their attention on the benefits which a high level of human capital can bring in terms of productivity and innovation. Human capital is central in the research of Barro and Sala-i-Martin (1991), Fagelberg (1994), Sadgley (1995). In their paper “Economic convergence and economic policies” Sachs and Warner (1995), talk about “international flows of knowledge” as one of the main factors benefiting countries with open market economies. Furthermore, Cuaresma, Ritzberg-Grunwald and Silgoner (2011) also conclude that human capital is of huge importance for convergence. Since we are investigating countries with high literacy rate, we can assume that it cannot further improve with the EU membership of the country. Thus in our paper we are not going to focus on human capital as a factor of convergence, assuming that the change in this aspect in the countries discussed is negligible.
Closely related to human capital is the level of innovations in the economy. However, relationship between innovation and economic growth and therefore convergence, is not always present. Researchers, who take technology as a private good rather than public, tend to believe that it is not significant for growth on the country level. In this case, technology is endogenous for growth and there is clearly visible gap between poor and rich counties, without any automatic mechanisms that can foster convergence (Chatterji, 1992). Such is the reasoning behind one of the most influential growth models, developed by Paul Romer (1986). Another reason for believing that there is no relationships between innovation and growth in the case discussed lays in the core principles of geographical economics. When looking at the economic activity throughout Europe, one can see that most innovative industries are operating in already established clusters, which exploit the great advantages of positive externalities. Thus, there are no reasons to believe that there are opportunities in that sphere, which a country could take in order to increase its growth rate, and consecutively foster convergence. There is, however, evidence for technology being a public good, meaning that it can influence the economic growth of the country. Innovation is one of the main forces of convergence in the works of Fagerberg (1994), Sadgeley (1992), Cuaresma, Ritzberg-Grunwald and Silgoner (2011) and others. Sachs and Warner (1995) discuss the importance of property right for economic growth, which can also be connected to innovation. However, measuring innovation is a rather hard task and misleading information on the topic can lead to biased results from the regressions tested. Since there is rather scarce data on the matter (when taking the number of patents in the country as a proxy for
10
innovation, which is the most common practice in previous research on the topic), we have decided to exclude the variable from the empirical research done in the paper.
Another factor which scholars often relate to economic grow is the level of corruption in the country. Throughout the literature, corruption has been associated with lower economic growth on the country (Mauro 1995; Tanzi 1997; Gupta 2000; Gyimah-Brempong 2001 and others) and on the firm level (Fisman and Svenson 2007). The effect of corruption on growth is happening through a number of channels (Chêne 2014). Lucrative practices drive down the investment to GDP ratio (Mauro 1995), distort the tax structure by increasing the size of the underground economy (Attila 2008) increases costs for companies (Clarke 2011). Thus, we believe that by including a measure of corruption in our analysis, we might capture an important trend for the economic development of the new member countries from the time when they have joined the EU. As a measure for the level of corruption in a country we are using the Corruption Perception Index published annually by Transparency International, which takes values between 1 and 10, with 1 meaning high level of corruption, and 10 – low. This index for simplicity is referred to in the following pages as “corruption”.
11
4 HYPOTHESES
Based on the major theories discussed, and on the results from previous research on the topic which we have presented in the prior sections, we have formulated the following hypotheses:
Hypothesis 1: The process of convergence is present among the 27 European Union member
states for the periods 2001-2006 and 2001-2012
Hypothesis 2: Migration turnover rate has a positive influence on the development of the
economy in European Union, and more specifically on the relationship between initial GDP per capita and economic growth which defines convergence for the periods 2006 and 2001-2012
Hypothesis 3: The corruption level in a country has a negative influence on development of the
economy in European Union, and more specifically on the relationship between initial GDP per capita and economic growth which defines convergence for the periods 2006 and 2001-2012
Hypothesis 4: Countries of the expansions in 2004 and 2007 tend to have more rapid growth
than older European Union member states, and therefore they do converge faster compared to older members of the Union for the periods 2001-2006 and 2001-2012
12
5 METHOD
The data type we choose to use in the paper is cross-sectional, which helps us to avoid the problems with insufficient data on some of the tested variables and at the same time examine the presence of convergence in the EU in a period of 12 years. We are focusing our analysis on three years, which we believe are representing the period rather well. For starting point which represents the initial settings for the countries, we have chosen 2001. The year 2006 shows how the first two years after joining the Union had affected the countries from the 2004 expansion, as well as the preparation period for Bulgaria and Romania. 2012 is the final year discussed in our paper, which aims to provide information for the longer term changes which occurred with EU membership.
All regression outputs in the paper are based on 27 observations, 10 of which belong to countries from the expansions of 2004 and 2007, and the other 17 to the 15 older members of the Union and Malta and Cyprus.
In order to test for convergence in the European Union over the period, we rely on a model of absolute convergence, presented by Baumol (1986). Baumol (1986) suggests testing for the presence of convergence with only two variables: initial GDP per capita and the change in GDP per capita. According to this, the convergence equation can be written as the following:
Y/H 1
ln
Y/H
0
ln
Y/H
0
iln (1)
Where Y/H1 stands for GDP per capita in year 1; Y/H0 is the GDP per capita in year 0, ln
[(Y/H)1] – ln [(Y/H)0] represents the observed change in GDP per capita during the period under
question ; α and β are the estimated parameters of the regression. In order to simplify the model, we use ln transformation formulas, and as a result obtain the following new regression equation:
Y H
i H Y H Y 0 0 1 / ln / / ln (2)In our paper equation (2) takes the form of:
Y H
i H Y H Y 2001 2001 2006 / ln / / ln (3)
Y H
i H Y H Y 2001 2001 2012 / ln / / ln (4)13
The model states that if the estimated β coefficient in the equations above is negative there is evidence of convergence. Absolute convergence can be described by -1 β value, meaning that in order to conclude that there is convergence between the countries we are discussing, the estimated coefficient for the slope of this regression should be somewhere in the values between 0 and -1. Moreover, according to the model we are using, the more negative the estimated β coefficient is, the higher is the strength of convergence observed in the data set (Baumol, 1986). In order to account for the effect of additional variables, we expand equation (2) to the
following:
ln (ΔY/H 2006) = α + β1 ln (Y/H 2001) + β2 ln (Migration turnover rate2001) + β3 (Corruption2001) +
εi , (5)
ln (ΔY/H 2012) = α + β1 ln (Y/H 2001) + β2 ln (Migration turnover rate2001) + β3 (Corruption2001) +
εi , (6)
where, ΔY/H2006 and ΔY/H2012 are the changes in the GDP per capita from the initial level in
2001.
This regression model aims to give us further view of the convergence in the European Union and the causing factors of it. Basing on previous research papers on the topic of convergence, we believe that migration turnover, corruption (corruption perception index) and initial GDP per capita can be the major reasons for the phenomenon to exist.
Furthermore we add dummy variables to our regression in order to compare the difference of the speed of convergence between newer and older member countries. The dummy variables take the value of 1 for the following countries: Latvia, Lithuania, Estonia, Hungary, Bulgaria, Romania, Czech Republic, Slovakia, Slovenia and Poland; and the regressions take the following form: ln (ΔY/H2006) = α + β1 ln (Y/H2001) + β2D + β3D* ln (Y/H2001) + β4 ln (Migration turnover
rate2001) + β5 (Corruption2001) + εi , (7)
ln (ΔY/H2012) = α + β1 ln (Y/H2001) + β2D + β3D* ln(Y/H2001)+ β4 ln (Migration turnover
14
6 EMPIRICAL FINDINGS 6.1 Economic growth in the EU
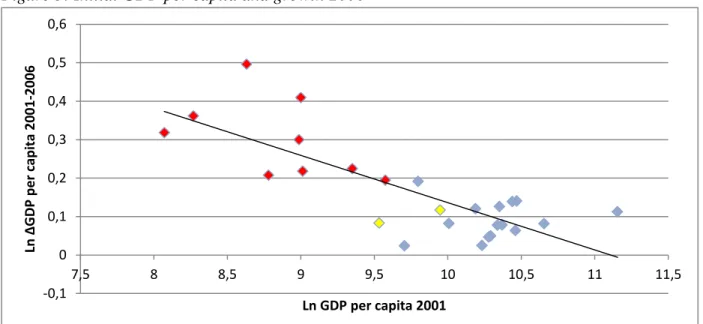
The graphical illustration of the relationship between the initial GDP per capita and the growth in the periods 2001-2006 and 2001-2012 is presented respectively in the following figures:
Figure 3: Initial GDP per capita and growth 2006
Note: blue = old member states; red = new member states; yellow = Cyprus and Malta Figure 4: Initial GDP per capita and growth 2012
Note: blue = old member states; red = new member states; yellow = Cyprus and Malta
-0,1 0 0,1 0,2 0,3 0,4 0,5 0,6 7,5 8 8,5 9 9,5 10 10,5 11 11,5 Ln Δ GDP p e r cap ita 2001 -2006 Ln GDP per capita 2001 -0,1 0 0,1 0,2 0,3 0,4 0,5 0,6 7,5 8 8,5 9 9,5 10 10,5 11 11,5 Ln Δ GDP p e r cap ita 2001 -2012 Ln GDP per capita in 2001
15
It is clearly visible from both figures that there is a negative relationship between the GDP per capita in 2001 in the countries and the rate of growth that they have experienced in the following years.
Important for our paper is the positioning on these figures between newer and older members of the European Union. The distinction between the two groups is rather clear, with the exception of Malta and Cyprus, which joined in 2004, but seem to have somewhat higher GDP per capita in 2001, and lower growth rate for the following years than countries which joined at the same time. The reasons behind that might be that both countries are small island countries, which are geographically distant from other members of the Union, making it harder for them to integrate in the common European market. Moreover, the two main industries of Malta’s economy (electronic industry and tourism) had a sharp decline of demand over the period (Ebejer,2006). As another reason for Cyprus’s low growth rate can be mentioned the instable situation of the country in the field of international relations and financial system.
In the longer period 2001-2012 we can see that Malta has overcome some of the difficulties from the previous period, having growth rate higher than older members of the Union. Cyprus is still experiencing low economic growth over this extended period of time. Most probably this happens because of the close relations between the Cypriot economy and the southern European economies, and Greece in particular, which were hit strongly by the financial crisis of 2008. Exactly the financial crisis of 2008 is the reason behind the relatively low increase in the growth between the periods.
These characteristics of the Maltese and Cypriot economies give us reason to believe that they behave differently from the countries in Eastern and Central Europe. Thus, although they are part of the same expansion of the European Union, we are not going to include them in our analysis as such. Although Malta seems to have overcome the difficulties it faced after joining the EU, for the purpose of objectively comparing the regression results between the two periods discussed we exclude it from the group of new countries in both equation (7) and (8).
As noted before, we believe that the Bulgarian and Romanian economies have strong connections with the other Eastern and Central European countries, which have joined the Union in 2004. This trend is confirmed by observing figures (3) and (4). It can be seen that low initial GDP per capita is a common characteristic of the mentioned countries, and so are the high growth rates during both periods.
As they have common growth path and for simplicity, further in the text we are going to refer to Latvia, Lithuania, Estonia, Estonia, Hungary, Slovakia, Slovenia, the Czech Republic, Bulgaria and Romania as “New Members”.
16
6.2 Convergence test
In this section, we are going to present and analyze the results obtained by implementing the three different models, which have been introduced in earlier section of this paper.
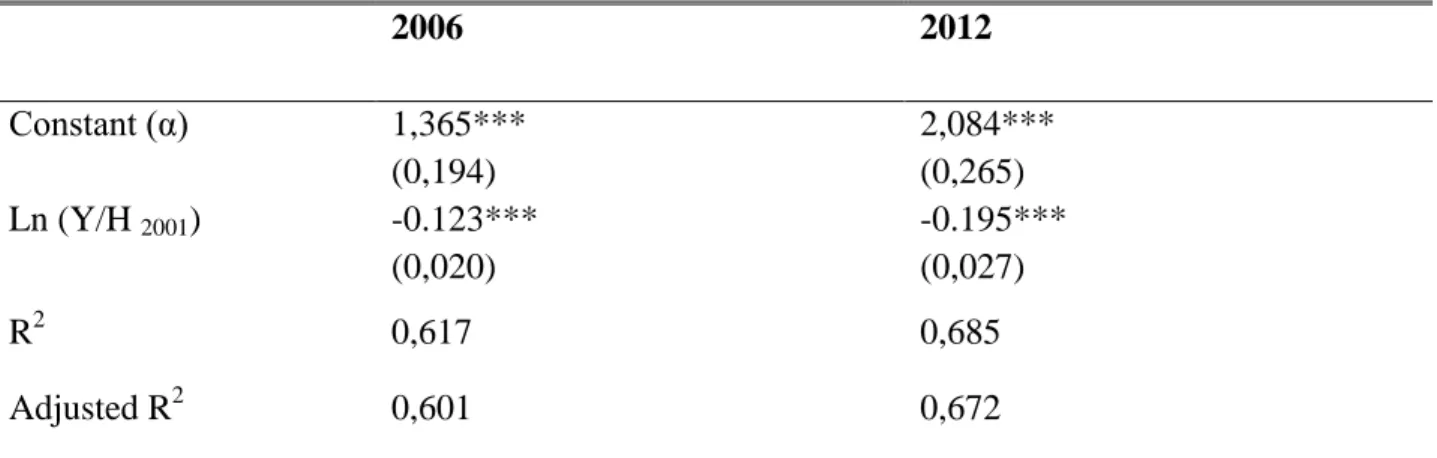
The first thing that we want to test for is the presence of economic convergence among all European Union member states. Since convergence can be seen as a negative relationship between the GDP per capita and the growth rate in a country, we base our analysis on Equation (3) and equation (4). The regression output is summarized in the following table:
Table 1 : Testing for convergence in 2006 and 2012
2006 2012 Constant (α) 1,365*** (0,194) 2,084*** (0,265) Ln (Y/H 2001) -0.123*** (0,020) -0.195*** (0,027) R2 0,617 0,685 Adjusted R2 0,601 0,672
Note: *** Significant at the 1% level; the standard errors are reported in brackets below the estimated coefficients
As it can be seen from Table 1, the coefficients for Ln GDP 2001 for both 2006 and 2012 are negative and thus indicate the presence of economic convergence.
Since the coefficient of Ln GDP 2001 in this regression represents the negative relationship between the initial GDP and growth rates of the countries, comparing the results for 2006 and 2012 we can conclude that this relationship had grown stronger, indicating faster convergence. In 2006 the regression shows that if there is 1% increase in the initial GDP per capita, growth rate is going to decrease by 0,123%. In contrast, if there is an increase in the initial GDP per capita by 1%, this will lead to a decrease in GDP per capita growth by 0,195%.
We have to note that the first year we are discussing is only 2 years after most of the countries in consideration have joined the Union and before Bulgaria and Romania have joined. The slower speed of convergence might be due to the fact that the market in the new member states needs some time to adjust to the new environment in order to take advantage of it. The results are likely to be affected by the fact that two of the countries in the group are not EU members at that point of time, meaning that their economies do not exploit the advantages associated with EU membership. Moreover, very often institutions in new member countries has to be tailored in a
17
way which gives better opportunities for the country to take advantage of its membership. This is also a long process, thus we can conclude that a certain period of time after joining is needed for a country in order to adjust in a way that will allow it to explore positive effect of EU membership and boost its growth rates, consequently fostering convergence.
6.3 Factors of convergence
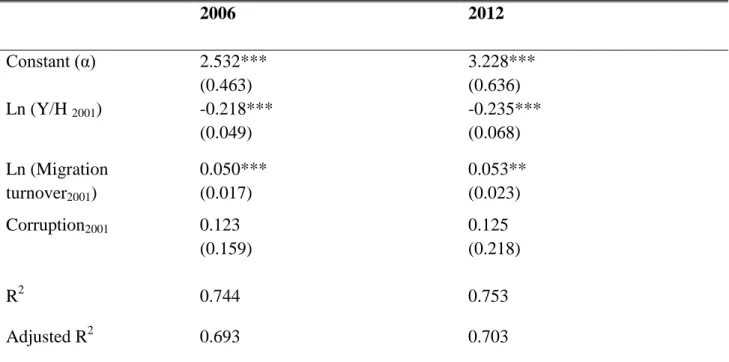
One of the main questions that we are trying to answer in this paper is which factors in addition to the initial GDP per capita are likely to explain the presence of convergence. That is the reason why we expand Model 1 by adding more explanatory variables, resulting in equations (5) and (6). Table 2 summarizes the regression results.
Table 2 : Factors of growth in 2006 and 2012
2006 2012 Constant (α) 2.532*** (0.463) 3.228*** (0.636) Ln (Y/H 2001) -0.218*** (0.049) -0.235*** (0.068) Ln (Migration turnover2001) 0.050*** (0.017) 0.053** (0.023) Corruption2001 0.123 (0.159) 0.125 (0.218) R2 0.744 0.753 Adjusted R2 0.693 0.703
Note: *** Significant at the 1% level; ** Significant at the 5% level; the standard errors are reported in brackets below the estimated coefficients
Migration is significant in both years we are discussing, at the 1% and 5% level respectively. In 2006 the coefficient of the variable is 0.050, compared to 0.053 in the latter year. However, the standard error has also risen for the second regression, making it hard to analyze the change that has happened to the variable over the discussed period. Nevertheless, the higher significance in 2006 might be connected to the adjustment processes that occurred in the economies of the countries when they opened their boarders towards the rest of the Union which increased
18
mobility of labour. In contrast, the labour market might have adjusted in the period 2004-2012, which leads to less significant movements of labour between countries in the Union.
Although corruption is not significant in both years we are discussing, we believe that it has effect on the GDP per capita growth, since it does improve the goodness of fit of our regression, increasing the adjusted R2. Moreover, theoretically, there is a strong negative relationship between the level of corruption and the economic development of countries. This is complemented by the decrease in corruption that we see for the countries we are focusing on. For the period 2001-2006 there has been a 13.27% on average increase in the corruption perception index for the recent members of the Union, while other EU members remain relatively stable with only 2.77% increase averagely. In the extended period of time the difference between the two groups of countries is even larger – there is an average increase of the index of 23.85% when looking at the data for new member states, while there is a negative growth of 5.22% averagely for the countries we have defined as old members. This makes us believe that corruption is indeed affected by EU membership, which combined with the theoretical linkage between the variable and growth, is a sufficient reason to include it in our regression equations and later – in the analysis based on them.
As expected, the coefficient of the GDP per capita in 2001 variable is negative for both years. The significance has not decreased compared to the previous model, which gives us reason to believe that the variables added in this expanded model do not pick up information, which was previously explained by the initial GDP per capita.
Moreover, the overall goodness of fit for the expanded version of the model has increased for both years discussed, with adjusted R2 going up from 0.601 to 0.693 in 2006 and from 0.672 to 0.703 in 2012.
6.4 Difference between new and old member states
So far in this paper we have concluded that there is economic convergence in the EU, and we have provided some explanatory factors of the phenomenon. However, we believe that new members of the Union have the tendency to converge faster. For the purpose of investigating this statement we include a Dummy variable, which takes a value of 1 for country which we have defined as New members and 0 for the other members of the Union. The regression output based on equations (7) and (8) is summarized in the following table.
19 Table 3: Comparing new and old member states
2006 2012 Constant (α) 1.70*** (0.479) 2.855*** (0.826) Ln (Y/H 2001) -0.145** (0.048) -0.254*** (0.083) Dummy 1,451*** (0,498) 0,799 (0,86) D*Ln (Y/H2001) -0,147*** (0.052) -0.084 (0.089) Ln (Migration turnover2001) 0.039** (0.015) 0.046* (0.025) Corruption 2001 0.152 (0.132) 0.144 (0.228) R2 0.848 0.768 Adjusted R2 0.79 0.679
Note: *** Significant at the 1% level; ** Significant at the 5% level; * Significant at the 10% level; the standard errors are reported in brackets below the estimated coefficients
According to the equation (7), we differentiate countries between new members and old members depending on their initial GDP per capita in 2001 and their economic ties. It can be clearly seen that new members of European Union have had greater growth rates according to the regression output table 3. This can be confirmed by the negative value of the slope dummy for Y/H2001, which in this case states that there is more rapid growth in newer member states of
the EU.
Moreover, migration turnover rate in 2006 has a significant effect on GDP per capita growth. Thus, we can conclude that migration flows are one of the factors which promote economic convergence in the Union. As mentioned before, the entry of a country in the European Union is associated with adjustments of the labour market, with people often moving abroad in order to look for more attractive job opportunities. These movements of labour are completely market driven, leading to better efficiency, improved human capital and knowledge spillovers, as often people working abroad do travel back to their home countries and share their experience and understanding of production and organizational processes. We believe that these changes in the labour market, expressed by the migration turnover variable, are among the main reasons why the EU is beneficial for the economic development of new as well as old members, and a key
20
factor for the faster convergence in the area compared to countries which no not exploit the opportunities which an open labour market could bring.
Furthermore, the level of corruption does not significantly affect the growth of GDP per capita. However, we keep this variable firstly because it does seem to have some effect on the dependent variable, positively affecting the explanatory power of the regression - the adjusted R2 of the regression improves by adding corruption in the equation. Moreover, an even more important issue has to be mentioned – there is a strong theoretical connection between the variables, making us believe that excluding corruption can lead to omitted variable bias. Finally, we believe that the effect on GDP per capita growth that is cause by corruption needs more time to be observed, which could be the main cause of the insignificant probability which we observe in our regression results.
Implementation of a dummy variable in this regression led to improved strength of the regression. After adding the dummy variable, the adjusted R2 has risen from 0,693 to 0,79 This gives us reasons to believe that the growth within European union is highly dependent on whether country is a new-joiner or older member of the Union. This confirms our assumptions discussed earlier in the paper that after joining, a country goes through transformation of its economy, allowing it to exploit the opportunities of the common market and of the EU represented by its institutions.
The results from the regression over the period 2012 are rather different. Unlike in 2001-2006, both dummy variables added have insignificant coefficients. Thus, in the extended period we are discussing there is no difference in the speed of convergence between new and old members of the Union. We believe that the reasons behind this originate from the disturbance of the economic activity caused by the financial crisis which hit Europe in 2007-2008.
The crisis had a strong impact on the migration flows in the European Union. The rising unemployment forced some of the labour force which has migrated in the previous years to move back to their home countries due to lack of attractive job opportunities. This dampens the positive effect of labour migration on the economy, affecting convergence negatively. This can be also seen by the decreased significance of the control variable Migration turnover, which is significant on the 10% level, compared to 5% in the previous period.
Another effect of the financial crisis is the less efficient banking sector. The number of institutions in the sector in the European Union has decreased from 9363 in 2001 to 8356, although two new countries (Bulgaria and Romania) have joined the common market over the period. This is also accompanied by compulsory (given the situation) mergers and acquisitions. (Eken et al, 2012). These disturbances in the financial sector negatively affect the investments in the economies, and thus- the growth which the countries experience.
Although the origins of corruption lie on national level, there is undeniable connection between the rising levels of corruption in many European economies and the financial crisis which hit the
21
region in 2007-2008 (Koch, 2012). As noted before, throughout the literature there is evidence for strong connection between corruption and growth, and therefore – convergence. Be believe that this linkage has substantial effect on the output we have gotten for the regression based on equation (8).
The level to which each European country has been affected by the financial crisis, as well as the policy response to the changes occurring in the economy is specific for each individual country. Thus, countries which we have defined as new and old members do not necessary follow a common pattern in this period with the others from the same group. For example, most of the countries in the northern part of Europe behave rather stable during the discussed years, while the South is experiencing great troubles handling the situation. The same is true within the set of new member countries– some of them have managed to dampen the effects of the crisis, while others have been hit strongly, with the respective effect on growth. The economic crisis has restricted the normal adjustment processes in the area. However, those disturbances are not symmetrical throughout our data set. Thus, we do not find it surprising that there is no significant difference between the two groups of countries discussed.
22
7 CONCLUSION
In conclusion, we can say that there is clear evidence for convergence in the European Union for both periods tested. Our empirical research has showed a clear negative relationship between initial GDP per capita and the growth rates which countries have experienced over the following years. Moreover, during the period 2001-2006 there is significant difference whether a country is a recent or old member of the European Union. As causing forces for convergence we have tested for migration turnover (associated with the higher level of labour mobility in the Union) and corruption.
Migration turnover, which is highly influenced by the labour market in the whole economic area, is significant for both new and old members. However, it is not particularly easy for new members to take advantage of the freedom of labour movement, since this commonly cause some negative effects due to outflow of skilled labour. Thus, it is crucial for the stability of the Union that there is increased level of opportunities for trained labour in new member states which can make it less likely for people with the right qualifications to search for better opportunities in the more developed countries in the Union. Even considering those negative effects which our findings show, however, there is still positive impact of the migration turnover for all groups of countries.
On the other hand, corruption is not significant in all versions of the model presented in the paper. Nevertheless, the variable has some effect on the economic growth of the countries. The data shows that there is significant increase in the corruption perception index for new members of the Union, making us believe that externalities on the government level can be beneficial for the joining countries. We consider the possibility that a longer period of time is needed in order for the economy of the respective countries to take advantage of the lower corruption level, and that exactly this fact is the reason behind the insignificant coefficient for the variable which we observe in the tested regressions. However, further research on the effect of corruption on the economic growth of the EU countries is needed, since the ambiguity of our results keeps us from drawing a clear conclusion on the matter.
We believe that the economic disturbance caused by the financial crisis which hit Europe in 2007-2008 is most probably the main causing factor of the lack of faster convergence in the group of new member states during the period 2001-2012. The crisis has negatively influenced the adjustment process of the labour market in the area, as well as the financial sector and thus, the investment in the following years. We also believe, in accordance with some of the previous research done on the topic, that corruption tends to rise during period of crisis, deviating countries from the normal path of achieving greater political stability, thus causing further problems with testing the phenomenon of convergence in the extended period discussed in the paper. All those problems disturb the economic processes associated with entering the European
23
Union and therefore prevent the economies of new member states of achieving growth rates which would be possible in times of economic prosperity.
Also, we have found that convergence is greater in the second period discussed in the paper. However, this does not give us reasons enough to claim that convergence does necessarily increase with the length of the period for which the country has been in the Union. Our results might be misleading, because our analysis includes a period of economic recession which proved to be rather tough for the economies of some of the older EU members, particularly in the southern part of Europe. The Eurozone crisis negatively influenced the growth rates in the whole area, but the strength with which it hit Greece, Portugal, Spain and Italy might be increasing the speed of convergence in the second period discussed based on an unusual event. However, previous research on the matter does find a relationship between the length of the EU membership and the growth of the country (Cuaresma et al, 2011).
Although in the results of our study show that the difference between the initial GDP per capita is the most significant factor for convergence, other factors do influence the speed of economic development as well. Thus, we have reasons to believe that EU membership might in fact foster faster convergence between members of the Union. This is also consistent with economic theory and the major growth concepts discussed in the paper.
24
REFERENCES
Attila, J. (2008). Corruption, taxation and economic growth: Theory and evidence. CERDI-CNRS Working paper. Retrieved March 30, 2015, from https://halshs.archives-ouvertes.fr/halshs-00556668/document
Barnard, C. (2013). The Substantive Law of the EU: The Four Freedoms. Oxford: Oxford University Press
Barro, R. J., & Sala-I-Martin, X. (1991). Convergence Across States and Regions. Brooking Papers on Economic Activity, 1, 107-182
Baumol ,W. J., Nelson, R. R. & Wolff, E. N. (1994).Convergence of Productivity:Cross-National Studies and Historical Evidence. New York: Oxford University
Baumol, W. (1986). Productivity growth, convergence, and welfare. American economic review, 76, 1072-1085
Black, J., (2010). A Dictionary of Economics (Oxford Paperback Reference). Oxford: Oxford University Press
Brakman, S., Garretsen, H., & van Marrewijk, C. (2009). The new Introduction to Geographical Economics. Cambridge University Press: New York
Carlton, D., & Perloff, J. (2004). Modern industrial organization, 4th edition, New Jersey, Prentice Hall
Chatterji, M. (1992). Convergence clubs and endogenous growth, Oxford Review of Economic Policy, 8, 57-69
Chene, M. (2014). The impact of corruption on growth and inequality. Retrieved April 20, 2015, from:http://www.transparency.org/whatwedo/answer/the_impact_of_corruption_on_growth_and _inequality
Clarke, G. (2011). How Petty is Petty Corruption? Evidence from Firm Survey in Africa, World Development, 39, 1122-1132
Cuaresma, J., Ritzberg-Grunwald, D., & Silgoner, M. (2011). Growth, convergence and EU membership, Applied Economics, 40:5, 643-656
Ebejer, I. (2006). Malta’s growth predicament: from frontrunner to laggard…and back ?. ECFIN Country focus, 3
25
European Commission Directorate-General for Regional Policy (2008). Working for the regions: EU regional policy 2007-2013. Retrieved April 13, 2015, from
http://ec.europa.eu/regional_policy/sources/docgener/presenta/working2008/work_en.pdf European Commission, DG Regional Policy (2003). Impact of community policies on cohesion: Executive summary. Retrieved May 1, 2015, from
http://ec.europa.eu/regional_policy/sources/docgener/studies/pdf/3cr/impact_summary.pdf European Union Regional Policy (2007) Cohesion policy 2007–13 Commentaries and offi cial texts. Retrieved May 23, 2015 from
http://ec.europa.eu/regional_policy/sources/docoffic/official/regulation/pdf/2007/publications/gui de2007_en.pdf
European Union Cohesion policy (2010) Ex-Post Evaluation of Cohesion Policy programmes 2000-06 co-financed by the ERDF (Objective 1 & 2). Retrieved May 23, 2015, forom: http://ec.europa.eu/regional_policy/sources/docgener/evaluation/pdf/synthesis_eval2000_2006.p df
Faini, R. (1996). Increasing returns, migrations and convergence. Journal of Development Economics, 49, 121-136
Fegerberg, J. (1994). Technology and International Differences in Growth Rates. Journal of Economic literature, 32, 1147-75
Fisman R., & Svenson, J. (2007). Are corruption and taxation really harmful to growth?. Journal of Development economics, 83, 63-75
Porter, M. E. (1998). Clusters and the new economics of competition. Harvard Business Review 76(6):77-90
Gupta, S., & Davoodi, H. (2000). Corruption and the provision of healthcare and educational services. IMF Working papers, WP/00/116
Gyimah-Brempong, K. (2001). Corruption, economic growth and income inequality in Africa. Economics of Governance, 3, 183-209
Mauro, P., (1995). Corruption and Growth. Quarterly Journal of Economics, 110
McDowell, M., Thom, R., Pastine, I., Frank, R., & Bernanke, B. (2012). Principles of economics. Berkshire: McGraw-Hill Higher Education
Rappaport, J. (2005). How does labour mobility affect income convergence?. Journal of Economic dynamics and Control, 29, 567-581
26
Razin, A., & Yuen, C. (1997). Factor Mobility and Income Growth: Two Convergence Hypotheses. Review of Development Economics , 1 , 171-190
Romer, D. (2012). Advanced Macroeconomics. New York: McGraw-Hill
Romer, P. (1986). Increasing returns and long run growth. Journal of Political Economy, 94, 1002-1037
Sachs, J., & Warner, A. (1995). Economic convergence and economic policies. NBER Working Paper Series. Retrieved April 29, 2015, from http://www.nber.org/papers/w5039.pdf
Soukiazis, E. (2000). What have we learnt about convergence in Europe? Some theoretical and empirical considerations. Retrieved March 28, 2015, from
http://www4.fe.uc.pt/ceue/working_papers/iconv.pdf
Tanzi, V., Davoodi, H. (1997). Corruption, public investment and growth. IMF Working papers, WP/97/139
27
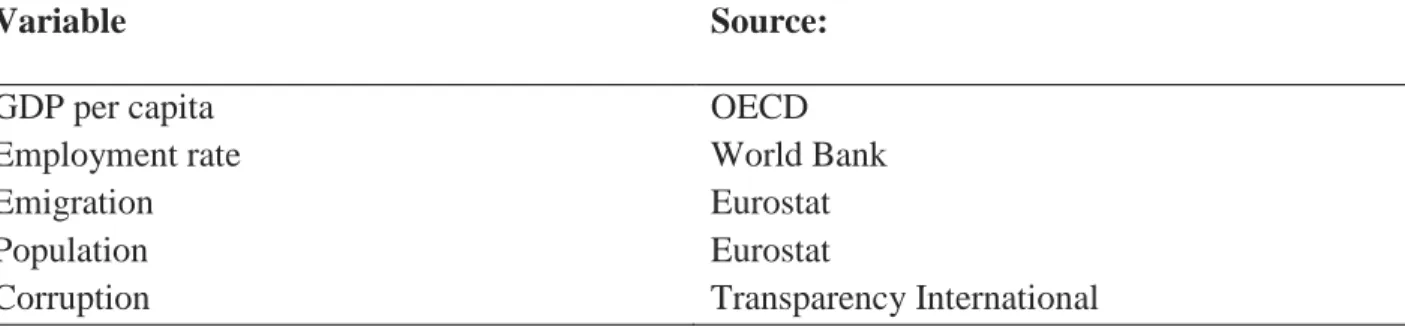
APPENDIX
Variable Source:
GDP per capita OECD
Employment rate World Bank
Emigration Eurostat
Population Eurostat
Corruption Transparency International