VTI notat 30A-2011 Published 2011
www.vti.se/publications
Report of the first round robin test for mobile
reflectometers
Research carried out in the frame of the activities of
CEN/TC 226/WG2
Luc Goubert Sven-Olof Lundkvist
Preface
This work has been carried out within the work of CENTC 226/WG2. The project was sponsored by the road authorities in Belgium, Denmark, Finland, Norway and Sweden. Project manager was Luc Goubert at the Belgian Road Research Centre (BRRC). Sven-Olof Lundkvist at the Swedish National Road and Transport Research Institute (VTI) was vice-project manager.
Thanks to all participants who took part in the mobile measurement without any expenses!
Brussels and Linköping October 2011
Quality review
Internal peer review was performed on by Jan Andersson, VTI. Sven-Olof Lundkvist has made alterations to the final manuscript of the report. The research director of the project manager Jan Andersson, VTI, examined and approved the report for publication on 28 November 2011.
Kvalitetsgranskning
Intern peer review har genomförts av Jan Andersson, VTI. Sven-Olof Lundkvist har genomfört justeringar av slutligt rapportmanus. Projektledarens närmaste chef Jan Andersson, VTI, har därefter granskat och godkänt publikationen för publicering 2011-11-28.
Table of contents
Summary ... 5
Sammanfattning ... 7
1 Introduction and aim of the study ... 9
2 Method ... 10
3 Analysis ... 12
3.1 Output from the instruments ... 12
3.2 Statistical calculations ... 14
4 Results ... 17
4.1 Measured retroreflection ... 17
4.2 Accuracy (systematic errors) ... 18
4.3 Precision (random errors) ... 18
4.4 Uncertainty ... 19
4.5 Repeatability ... 19
5 Correlation to the hand-held measurements ... 20
6 Use of the results ... 24
Appendices
Appendix A Description of the LTL-M
Appendix B Description of the Ecodyn 30
Appendix C Description of the Zehntner ZDR 6020
Appendix D Results with test site number 17, 1L and 4L excluded
Report of the first round robin test for mobile reflectometers – Research carried out in the frame of the activities of CEN/TC 226/WG2
by Luc Goubert1 and Sven-Olof Lundkvist
VTI (Swedish National Road and Transport Research Institute) SE-581 95 Linköping Sweden
Summary
Mobile reflectometers have been commercially available since the late 1990’s. It has been speculated that measurement errors are larger for these mobile instruments than for the traditional hand-held reflectometers. In order to get basic data for a new standard, CEN/TC 226/WG2 asked the Expert Panel to investigate measurement accuracy of mobile reflectometers. This investigation was carried out in a round robin test, in which the three most commonly used instruments in Europe participated: Ecodyn 30, LTL-M and Zehntner ZDR 6020. Two instruments of type Ecodyn were tested and one of each of the other two instruments; thus four reflectometers participated in the test. These instruments were denoted No. 1–4.
A test route of 19 edge lines and 2 lane lines was defined. All edge lines were
continuous, plane or profiled, while the lane lines were plane, 3 metres long with a gap of 9 metres. At each test site a section of 200 metres was measured, twice with each instrument. As reference, a hand-held reflectometer of type LTL-2000 was used. At each test site, a number of 32–38 readings were taken with this instrument.
The results show that the uncertainty of one instrument was extremely large. From earlier experience it is obvious that the measurement errors of this instrument were not representative, and therefore should be neglected. The uncertainty of the other three mobile instruments was in the range 7–15%, which, as expected, is larger than the uncertainty of the reference instrument. For different reasons, three of the test sites could be excluded. In that case, the results show somewhat better uncertainty: 6–13%. The repeatability was 2–3%.
When interpreting the results, it is important to note that the four types of instrument (three mobile and the hand-held) in fact do not measure the same area of the road marking. Consequently, one should not expect a one to one relationship between the readings, especially if the retroreflectivity of the road marking surface is inhomo-geneous.
It is up to the Expert Panel of CEN/TC 226/WG2 to interpret the results and implement them into a standard.
Test av mobila reflektometrar – studie utförd inom ramen för verksamheten i CEN/TC 226/WG2
av Luc Goubert2 och Sven-Olof Lundkvist
VTI
581 95 Linköping
Sammanfattning
Instrument för mobil mätning av vägmarkeringars retroreflexion har varit kommersiellt tillgängliga sedan slutet av 1990-talet. Det har spekulerats i att mätfelen hos dessa instrument är större än hos de traditionella, handhållna instrumenten. För att få underlag till en standard för mobila instrument har CEN/TC 226/WG2:s expertpanel i ett round robin-test undersökt mätonoggrannheten för tre typer av mobila instrument: Ecodyn 30, LTL-M och Zehntner ZDR 6020. I testet deltog två Ecodyn samt ett instrument av vardera typ LTL-M och Zehntner. Instrumenten numrerades 1–4.
En testslinga innehållande 19 kantlinjer och 2 körfältslinjer definierades. Samtliga kant-linjer var heldragna, plana eller profilerade, medan körfältskant-linjerna var plana och hade längden 3 meter med 9 meters lucka. Varje teststräcka var 200 meter lång och denna mättes två gånger med varje mobilt instrument. Referensmätning gjordes med det handhållna instrumentet LTL-2000 i 32–38 mätpunkter.
Resultaten visade att mätonoggrannheten var extremt stor för ett av instrumenten. Med tidigare erfarenhet av denna typ av instrument som bakgrund, finns det skäl att negligera detta resultat. För de tre övriga instrumenten var mätonoggrannheten 7–15 %, vilket som väntat var något högre än för det handhållna. Av skilda orsaker finns det skäl att utesluta resultat från tre av provsträckorna. Görs detta skattas mätonoggrannheten till 6–13 %. Repeterbarheten var 2–3 %.
Vid tolkning av resultaten är det viktigt att minnas att mätområdet för de fyra typerna (tre mobila och ett handhållet) av instrumenten inte är lika. Det finns därför inget skäl att förvänta sig ett ett-till-ett förhållande mellan mätvärden, framförallt om retro-reflexionen är olika på olika delar av vägmarkeringens yta.
Det är nu CEN/TC 226/WG2:s uppgift att tolka resultaten och implementera dessa i en standard.
1
Introduction and aim of the study
Since the late 1990’s mobile reflectometers have been commercially available and used for check of the retroreflection of road markings. Earlier, road marking performance was checked using hand-held instruments, but increasing traffic was one reason for development of mobile instruments. The requirements on hand-held measurements and instruments are regulated in EN-1436, Annex B. This Annex also mentions mobile (vehicle mounted) instruments:
Vehicle mounted instruments are used to measure RL values of road markings while
moving at traffic speed, and can be used for longer stretches of road than portable instruments and in cases where the use of portable instruments requires extensive precautions, in particular on motorways.
Vehicle mounted instruments should in principle comply with the same requirements as for portable instruments, and should be able to cope with the movements of the vehicle and with changing conditions of daylight. However, the operation at speed may cause additional difficulties of the measurement, which may lead to compromises with
requirements or cause additional variation of measured values.
Portable and vehicle mounted instruments are to be calibrated, maintained and used according to instructions by the instrument supplier.
When those paragraphs were written the experience of mobile reflectometers was small. That is the reason why it was written in rather vague terms like “operation at speed ….may lead to compromises with requirements or cause additional variation of measured values”.
Since EN-1436 was revised in 2006, the use of mobile instruments has increased and several instruments are now commercially available. However, experience from older instruments has shown that the speculations above were correct: measurement errors are larger for the mobile than for the hand-held instruments.
During its meeting on 18 and 19 April 2010 in Istanbul, CEN/TC 226/WG2 asked the Expert Panel to investigate this aspect further by means of the organization of a round robin test. The aim of this study was to quantify those measurement errors, i.e. to estimate the accuracy, precision, uncertainty and repeatability of the mobile instruments commercially available today (September 2010). The aim was to increase knowledge, not only of measurement errors, but also of the operation of mobile instruments, and to use this new information in a standard.
In order to get more experience of mobile instruments, the Expert Panel of WG2 arranged demonstration and validation measurements in Belgium between September
13th and September 15th 2010. The measurement programme was set up by BRRC (Luc
2 Method
Users and manufacturers of mobile reflectometers in Europe were invited to participate in the evaluation and demonstration of different types of mobile instruments. Positive response came from two users and two manufacturers according to table 1 (in alpha-betical order).
Table 1 Participants in the test measurements in Belgium in September 2010.
Company Country Instrument User/manuf.
DELTA Light and Optics Denmark LTL-M manufacturer
Ennis Prismo UK Ecodyn 30 user
Euroconsult NT Spain Ecodyn 30 user
Zehntner GmbH Switzerland Zehntner ZDR 6020 manufacturer
The users and manufacturers participated on their own expense. Each participant was responsible for the calibration of the instrument and for delivery of the data. The three types of mobile instruments, LTL-M, Ecodyn 30 and Zehntner ZDR 6020, are described in detail in Annex A, B and C, respectively. A commitment to the participants was that the instrument could not be identified in the chapters describing the results and conclu-sions. Therefore, the instruments were by random assigned a number between 1 and 4. In advance, 23 test sites were defined. However, two of the sites were excluded: one because of road work and one because the hand-held measurements were impossible to carry out due to the amount of traffic. Thus, measurement on 21 test sites remained – 19 continuous plane and profiled edge lines and two broken (3 m line, 9 m gap) lane lines, each of the length 200 metres. The locations of the test sections and pictures of the concerned markings can be found in Annex E.
In order to estimate the repeatability of the mobile instruments, more than one measure-ment round was carried out at eight of the sites. The remaining twelve test sites were only measured once. The mobile measurements were carried out in approximately 50 km/h and at every site all mobile readings were taken within a couple of minutes. Figure 1 shows the mobile instruments, measuring test site number 1.
Figure 1 The four mobile instruments measuring test site number 1.
As reference readings of a hand-held instrument of type LTL-2000 of manufacturer DELTA were used. This instrument was checked and calibrated both before and after the measurement series to make sure that there was no bias in the reference data. Readings with the hand-held instrument were taken approximately every sixth metre. This meant 32–38 readings at each test site, except at four sites with very heavy traffic, where only 18 readings, distributed evenly over the stretch, were taken. It should be noted that, although the hand held instrument was properly serviced, calibrated and operated, there is also an uncertainty on its results, due to the sampling on the one hand and the usual instrument uncertainty (not exceeding 5% RMS deviation according to the manufacturer) on the other hand. To consider the results of the hand held instrument as the “true” values is hence only an approximation of the reality.
All measurements were carried out between the 13th and 15th of September 2010 on dry
road marking surfaces in partly cloudy weather conditions. The time between the hand-held and mobile measurements was short – less than one hour.
3 Analysis
3.1
Output from the instruments
In this study, four different instruments of three types have been tested against readings from a hand-held instrument. It is important to stress that the reading from each type of instrument does not represent the retroreflection of exactly the same area:
The hand-held readings with the LTL-2000 were taken in the middle (transverse) of the road marking. This means that the operators made a judgement of where the middle was. This may be difficult on a wide road marking (some were of the width 0.30 met-res) which means that on this type of marking the measurement point may be misaimed a couple of centimetres or so. The measurement area of the hand-held instrument is approximately 0.040.4 metres and on most test sites approximately 35 readings were taken. Sampling means that there is an uncertainty in the average RL-value which is
dependent on the sample size and the variance of the retroreflection, both along and transverse the road marking.
The measured area of the mobile instrument 1 coincides with the road marking area, both longitudinally and transversally. Consequently, the readings of this instrument are comparable to the hand-held readings only if the road marking retroreflection is
homogenous.
The measurement results of the mobile instrument 2 can be analysed after the measurements have been completed and readings can be obtained from the whole, or any part of the road marking. This means that, when comparing with the hand-held measurements, the measurement area should be located in the centre of the road line and when comparing with instrument 1, the entire area should be used. Therefore, the
delivery of mobile instrument 2 was readings representing 0.05 metres in the middle (transverse) of the road marking, and, also readings representing the entire road marking area.
Mobile instrument 3 uses 14 photocells to measure the road marking retroreflection.
The output is an average of the two photocells which show the highest value. As each photocell covers approximately 0.04 metres, the reading represents a value of width 0.08 metres. If the road marking retroreflection is homogenous, the output from this instrument should be comparable with the output of the other instruments. However, if the retroreflection varies widely transverse to the road marking, in most cases
instrument 3 should read a higher value than the hand-held instrument. Only if the maximum is in the middle of the line, readings from instrument 3 would be comparable to readings of the hand-held and the mobile instrument 2.
Mobile instrument 4 is of the same make as instrument 3, and, therefore the output
should be comparable to readings from that instrument.
Figure 2 shows the difference in retroreflection dependent on if the entire area or 0.05 metres in the middle of the road marking is taken into consideration.
Figure 2 Comparison of the retroreflection of 22 road markings when the output represents the entire area or 0.05 metres in the middle of the marking.
Figure 2 shows a deviation of in average about 11%. Obviously, the majority (18 out of 22) of the road markings has the highest value in the middle (transverse) of the surface as the readings are lower when the output derives from the entire surface. However, in all calculations below, accuracy, precision and uncertainty is calculated using the hand-held readings as reference. In other words, LTL-2000 is considered to measure the “true” retroreflection.
The delivery from the mobile instruments was an average value of the entire 200 metres long test site, but also of this site divided into stretches of 50 metres. This latter output has not been used, as it is difficult to divide the output from the hand-held files into stretches of exactly 50 metres. Consequently, such an analysis would not contribute to the conclusions of the measurements. However, one test site, number 9, was partly located in a tunnel (50 metres in the beginning of the stretch), where the road marking was extremely dirty. This part of that test site has been excluded and, therefore, the length of test site number 9 is 150 metres.
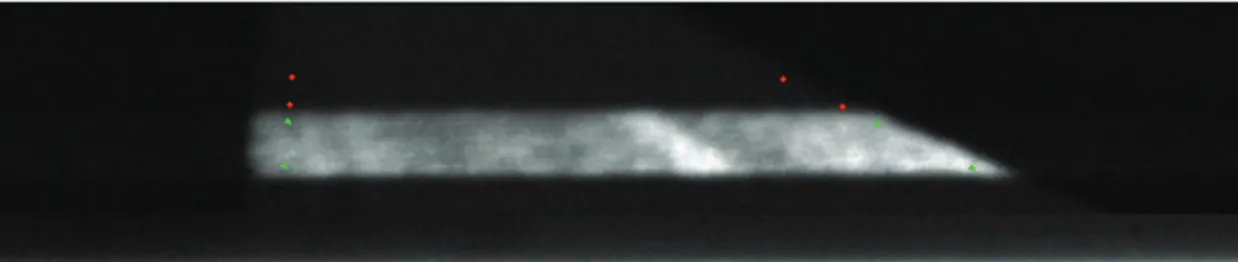
The analysis of the readings of one of the mobile instruments shows that the retro-reflection of the road markings at one test site, number 17, has a very large variation in the transverse direction of the road line. This fact is illustrated in Figure 3, where a narrow light band to the right of the centre of the surface, can be seen. This band is located just a couple of centimetres from the centre of the road marking and shows a retroreflection of more than 210 mcd/m2/lx, while the RL-value in the centre is
approximately 150 mcd/m2/lx.
One can realize that, regarding this test site, the discrepancy between the readings of the instruments may be great as the retroreflection shows a large transverse variation close to the middle of the road marking. Generally, it is no good idea to exclude data, but in
this case it is obvious that including number 17 in the analysis may introduce large errors in the result.
Just before the round robin test instrument 1 had a small accident which unfortunately destroyed the instrument. This meant that this instrument was replaced by a devices used for development of filters. Therefore, by mistake, some filter settings of the
software were set incorrectly. This fact has probably caused the large deviation between readings of the LTL-2000 and instrument 1 for centre lines.
Referring to what is stated above, a separate analysis where test sites 17, 1L and 4L have been excluded is shown in Annex D.
Figure 3 The appearance of the road marking at test site number 17. The bright band, meaning high retroreflection, is located towards the shoulder a few centimetres from the middle of the edge line.
3.2 Statistical
calculations
Below, the following denotations are used:
RL(X) The average RL of the 21 test sites when using instrument X.
RL(LTL2000) The average RL of the 21 test sites when using LTL-2000.
RLharm(X) The average RL of the 21 test sites when the individual readings of the
mobile instrument X are harmonized3 with RL(LTL2000).
ΔRL(X) The average difference between RL(X) and RL(LTL2000).
) ( X
RLharm
The absolute value of the average difference between individual
readings of RLharm(X) and RL(LTL2000).
) ( X
RL
The absolute value of the average difference between individual
readings of RL(X) and RL(LTL2000).
εacc The accuracy (systematic error) of the measurements.
εprec The precision (random error) of the measurements.
εunc The uncertainty (total measurement error) of the measurements.
εrep The repeatability of the measurements.
3
For mobile instrument X the accuracy, εacc (X), is calculated as n LTL R LTL R X R X n i Li Li Li acc
1 ) 2000 ( / )) 2000 ( ) ( ( ) ( (1)where RLi(X) is the reading of instrument X at test site i, RLi(LTL2000) is the hand-held
reading at test site i and n the number of test sites.
Furthermore n LTL R LTL R X R X n i Li Li Liharm prec
1 ) 2000 ( ) 2000 ( ) ( ) ( (2)where RLiharm(X) is the harmonized retroreflection when using instrument X at test site i:
) ( ) ( ) (X R X R X RLiharm Li L (3)
Finally, the concept uncertainty, εunc(X) is defined as
n LTL R LTL R X R X Li n i Li Li unc ) 2000 ( / ) 2000 ( ) ( ) (
1 (4)At those test sites where more than one measurement round was carried out with the mobile instruments, the repeatability was calculated as
n X R X R X R X n i Liq Liq Lip rep
1 ) ( / ) ( ) ( ) ( (5)where RLip and RLiq refer to the retroreflection of measurement round p and q,
respectively, at test site i using instrument X. Thus,rep, refers to the repeatability of two measurement rounds. Some test sites were measured more than twice with each mobile instrument. In that case the repeatability was calculated as an average of all possible combinations.
When interpreting the measurement errors, it is important to bear in mind that the accuracy, precision, uncertainty and repeatability are related to the variance in data
between the test sites. Besides, there is also a variance within each test site, which partly
is a true variance in the retroreflection along the stretch, partly a measurement error. However, this within test site variance has not been analysed.
Furthermore, it can be stressed that linear error terms have been calculated. Error terms based on the standard deviation would have been larger and outliers would have had a larger influence on the estimated measurement errors. This is shown by the r2-values in Figures 4–7.
4 Results
4.1 Measured
retroreflection
Table 2 shows the estimated average retroreflection for each of the 21 test sites.
Table 2 The retroreflection at 21 test sites of 200 metres. Average of 1–6 measurement rounds at a stretch of approximately 200 metres.
Test site LTL-2000 Mobile instrument 1 Mobile instrument 2 Mobile instrument 3 Mobile instrument 4 1 110 120 101 223 157 2 260 254 257 367 293 3 279 251 265 362 254 4 260 363 213 464 327 6 353 314 355 362 348 7 247 229 231 319 239 8 263 238 255 342 254 9 178 172 154 278 183 10 242 210 251 371 293 11 365 286 359 451 359 12 383 292 375 374 383 13 215 230 238 411 321 14 359 325 342 487 390 15 338 341 351 374 406 16 307 303 312 194 325 17 231 207 159 141 239 18 359 345 328 475 399 19 489 512 434 385 477 20 507 539 541 444 581 1L 150 62 148 144 161 4L 419 176 366 405 362
4.2
Accuracy (systematic errors)
Table 3 shows the accuracy of the four mobile instruments calculated according to Eqn. (1).
Table 3 The accuracy estimated from field measurements at 21 test sites. Four mobile instruments compared to the hand-held measurements using the LTL-2000.
Instrument RL ΔRL εacc LTL-2000 301 - - Mob. Instr. 1 275 -26 -8.4% Mob. Instr. 2 287 -13 -4.8% Mob. Instr. 3 351 +50 +23.7% Mob. Instr. 4 321 +21 +9.1%
As stated before, the measurement area of the four types of instrument is not equal. Therefore, instruments 3 and 4 should read a higher value than the LTL-2000 and instrument 2 a value equal to the hand-held instrument. The output from instrument 1 represents the entire road marking area and can, therefore, be higher or lower than the hand-held reading, dependent of the distribution of RL across the line. All these
assumptions are in good agreement with the results, even if it is impossible to estimate if the size of the differences is correct.
4.3 Precision
(random
errors)
To find the precision of the instruments, the RL-values in Table 3 are harmonized
according to Eqn. (3). This harmonization enables an analysis of the precision, independent of the accuracy. Table 4 shows the random errors when the systematic deviation has been rejected, which estimates the precision of the measurement.
Table 4 The precision estimated from field measurements at 21 test sites. Four mobile instruments compared to hand-held measurements using the LTL-2000.
Instrument RLharm RLharm εprec
LTL-2000 301 - -
Mob. Instr. 1 301 44 14.8%
Mob. Instr. 2 301 21 7.1%
Mob. Instr. 3 301 72 26.9%
Mob. Instr. 4 301 30 10.8%
Particularly, the precision of instrument 3 is poor. It is worth to note that instruments 3 and 4 are of the same type and they should therefore have about the same perfor-mance. It is difficult to explain the large difference in precision between these two instruments, but earlier experience tells that the figure for instrument 3 is too high.
4.4 Uncertainty
The concept “uncertainty” is the overall concept which involves both accuracy and precision according to Eqn. (4). Table 5 shows the uncertainty of the four mobile instruments.
Table 5 The uncertainty estimated from field measurements at 21 test sites. Four mobile instruments compared to the hand-held measurements using the LTL-2000.
Instrument RL L R εunc LTL-2000 301 - - Mob. Instr. 1 275 44 14.8% Mob. Instr. 2 287 22 7.4% Mob. Instr. 3 351 88 35.0% Mob. Instr. 4 321 32 12.4%
Some of the uncertainty for instrument 1, 3 and 4 may be explained by the difference in measurement area as discussed in Chapter 3. However, the uncertainty of instrument 3 is extremely large, which probably is due to some malfunction or operational mistake.
4.5 Repeatability
Table 6 shows the repeatability of the four mobile instruments.
Table 6 The repeatability of the four mobile instruments.
Average of 1–5 repetitions at eight test sites (Mob. Instr. 1 only 2).
Instrument εrep
Mob. Instr. 1 1.8% Mob. Instr. 2 1.8% Mob. Instr. 3 2.9% Mob. Instr. 4 3.3%
5
Correlation to the hand-held measurements
Figures 4 to 7 show the regression between on one hand the hand-held and on the other hand the mobile measurements based on 21 test sites. In each figure the r2-value is given. This value can be interpreted as the percentage of the total variance in data that is explained by a true variance in road marking retroreflection. The rest are measurement errors. The square root of r2 is the correlation coefficient.
Figure 4 shows the regression line between readings from the mobile instrument 1 and the LTL-2000.
Figure 4 The regression line for mobile instrument 1 and LTL-2000 shown as the solid line. The dashed line is x = y.
As can be seen in figure 4 there are some outliers; among them are the two lane lines. r2 shows that 64 % of the total variance in data is explained by the variation in road marking retroreflection. The rest of the variance, 36%, is due to the random errors in measurements.
Figure 5 shows the regression line between readings from the mobile instrument 2 and the LTL-2000.
Figure 5 The regression line for mobile instrument 2 and LTL-2000 shown as the solid line. The dashed line is x = y.
Figure 5 shows that the regression line of intrument 2 is very close to x = y. r2 indicates that 6% of the total variance in data arises from measurement errors; the rest, 94%, is the true variance of the road marking retroreflection among the 20 test sites.
Figure 6 shows the regression line between readings from the mobile instrument 3 and the LTL-2000.
Figure 6 The regression line for mobile instrument 3 and LTL-2000 shown as the solid line. The dashed line is x = y.
Figure 6 shows that both systematic and random errors are large for instrument 3. In fact most of the variance in data arises from the measurement errors – only 35% from the variance in road marking retroreflection.
Figure 7 shows the regression line between readings from the mobile instrument 4 and the LTL-2000.
Figure 7 The regression line for mobile instrument 4 and LTL-2000 shown as the solid line. The dashed line is x = y.
Figure 7 shows a high correlation between readings of the two instruments. The syste-matic discrepancy of approximately 10% (see Table 3) can probably to some extent be explained by the difference in measurement areas.
6
Use of the results
It is for the Expert Panel of CEN/TC 226 WG2 to evaluate the uncertainties derived in this study and to arrive at recommendations for mobile measurement in view of the methods used by the instruments that took part and as described in annexes.
At this point it is recommended that mobile instruments are designed to be easy to handle and robust in use, so that the errors as observed in the study are avoided. Further, it is recommended that a single method of dealing with the width of road markings is chosen in view of the transverse non-uniformity observed in this study.
Appendix A Page 1 (4)
Description of the LTL-M
A1 Introduction to the LTL-M
The LTL-M measures the coefficient of retroreflected luminance RL while driving at
speed. The measuring geometry is the 30 m geometry of EN 1436 in a scale of 1:5
meaning for instance that the nominal measuring distance D0 is 6 m. The locations of
the detector and the light source are interchanged.
The light source is a xenon flash lamp that emits flashes with duration of typically 10 to 20 microseconds. By means of suitable optics the flash lamp illuminates a field on the road that is approximately 1 m long and 1 m wide.
The detector is a digital camera used with a fixed exposure time set typically to 10 to 20 microseconds.
The flashes of the flash lamp and the exposures of the camera are synchronized. The current rate is 25 flashes and exposures per second. The software analyses mentioned in the following are carried out in real time.
A field of the road is shown in a part of the image that has a width of more than 1,000 pixels and a height of typically 100 pixels. This field is a bit wider than the illuminated field but much longer, covering a distance range from approximately 4 to 8 m.
Suitable software analyses this part of the image and determines if it contains a longi-tudinal road marking. If so, the software determines the sides enclosing the road
marking surface and also possible fronts and ends of road markings in broken lines. The software also identifies those parts of the road marking surface that are illuminated by the flash lamp. Additionally, the software determines the actual distances D to locations on the surface that correspond to each of the pixels.
Figure A1 shows a typical image with a 30 cm edge line.
By means of suitable optics another part of the image is made to show the light source itself in such a way that it represents the distribution of the illuminance E0 on a vertical surface at the distance D0. The software uses this distribution to determine the
illuminance E created by the flash lamp at locations on the road marking surface by E = E0×(D0/D)2. The term (D0/D)2 represents the distance law of illumination.
Appendix A Page 2 (4)
Figure A1 contains also a typical image of the light source.
Figure A1 The illuminated part of a 30 cm edge line (upper image) and the flash lamp (lower image).
On this basis, the RL value at a location is derived by: RL = C0×C×(P-D)/E
where C0 is a correction factor
C is a calibration factor
P is the value of the pixel corresponding to the location
and D is a residual level of daylight.
The result is expressed as the average RL value for a field on the illuminated part of the road marking surface.
Two such fields are indicated in figure A2. The upper field corresponds to a 5 cm wide lane in the middle of the marking surface, while the lower field includes almost all the width of the road marking.
Figure A2 Two fields for integrating the RL value.
NOTE: The images are actually wider than shown in figures A1 and A2.
The retroreflected luminance of the road marking surface dominates over daylight during the brief period of the flash. However, in bright daylight there is a residual level of daylight which is determined for a field on a part of the road marking surface that is not illuminated by the flash lamp.
Appendix A Page 3 (4)
The residual level of daylight that is used in the current image is actually one that has been determined from a previous image, while the level determined from the current image is saved for use with a later image. In this way, the residual level of daylight is determined at the correct location and just a short time before it is used, typically 1/25 of a second earlier.
Linearity and uniformity of the response of the camera pixels is ensured on the basis of an initial procedure carried out in laboratory conditions.
The LTL-M by its construction and way of working ensures an almost constant sensi-tivity over the width of the illuminated field. However, a global calibration is carried out at intervals in order to eliminate possible small variations. To this purpose, the
LTL-M is aimed to illuminate a uniform white surface placed at the distance D0 and
addi-tional software is initiated. The software determines and stores an array of the
above-mentioned correction factors C0 as an average of 100 exposures and stores the values.
The software also derives some geometrical measures that are used for the above-mentioned analyses of road images during driving.
The value of the above-mentioned calibration factor C is derived in a calibration proce-dure using a calibration standard of one of the types used for the handheld retroreflec-tometers LTL 2000, LTL-X or LTL-XL. Other calibration standards may be used as well. The calibration standard is placed at the distance D0, the LTL-M is aimed to illuminate the ceramic front surface of the standard and additional software is initiated. This software determines C as an average for 100 exposures and stores the value.
The software used during driving determines not only the RL value as described in the
above, but also:
- the geometry of the road marking including the width and gaps in broken lines - the geometry of measurement including the height position of the equipment, the
measuring distance and three angles relating to the orientation of the equipment relative to the road marking surface.
The software derives all the above-mentioned values for one or two lines (for instance double centre lines) simultaneously.
A2 Compliance with EN 1436
The LTL-M works in accordance with EN 1436 by:
- having a spectral correction that allows measurement of both white and yellow road markings
- complying with the standard measuring condition in terms of angles, apertures and measured field
- having sufficient linearity and range
- providing RL values that are unaffected by ambient daylight
- providing RL values that are robust to tilts and lifts
- using a calibration standard with a traceable RL value that can also be independently
calibrated.
Tilts and lifts are unavoidable in practical driving conditions being caused by movements of the vehicle, camber of the road or other factors. Compensation for the effects of the distance law of
Appendix A Page 4 (4)
illumination is obtained in the way explained in A1. Additionally, effects of a geometrical factor that is inherent in the RL value are avoided by excluding the geometrical factor in the measured
value. This is obtained by the interchange of the detector and the light source.
NOTE 1: This kind of robustness is provided also by the handheld retroreflectometers LTL 2000, LTL-X and LTL-XL. In these handheld retroreflectometers, robustness to distance is provided by the use of collimating optics that create a virtually infinity measuring distance. The exclusion of the geometrical factor from the measured value is obtained by an arrangement of the fields of illumination and measurement, so that the illuminated field is enclosed within the measured field.
NOTE 2: The geometrical factor is the ratio sin/sinα, where and α are the illumine-tion and observaillumine-tion angles. The correct value for the 30 m geometry is 0,542 which is applied as a factor.
A3 Other comments
The various features of the LTL-M (robustness to tilts and lifts, feedback from the light source, precise identification of the relevant field and precise compensation for any residual daylight) brings validity to not only average RL values for 50 or 100 m site, but also to the individual measured RL values at locations.
The value of calibration factor C is stable over time because of the feedback from the flash lamp. However, it is easy to do calibrations on location.
The width of the field of more than 1 m, refer to D.1, allows for comfortable steering of the vehicle.
The information on the geometry of measurement, refer to D.1, ensures that the alignment can be kept within tolerances.
Appendix B Page 1 (4)
Description of the Ecodyn 30
Ecodyn
A device for continuous single-pass day-time surveys
of the night- and day-time visibility of road markings
Ecodyn continuously measures the coefficients of retroreflected luminance of road markings as well as their day- and night-time contrasts with the pavement. This helps the road manager to schedule campaigns for the replacement of road markings, to check the quality of laying of marking products, and to monitor their development with time. In this way a substantial contribution can be made to improving road safety.
Principle
The coefficient of retroreflected luminance of road markings characterizes their capability of backscattering light from vehicle headlamps to the driver. It is denoted as RL and expressed in mcd/m³.lx. To measure it, Ecodyn emits a frequency-modulated white light and receives the retroreflected luminous flow, superimposed by the flow from ambient illumination. Appropriate signal processing makes it possible to separate the two types of light and to calculate the RL coefficients as well as the day- and night-time contrasts of the marking with the pavement.
The measuring geometry complies with the prevailing European standard NF EN 1436, i.e., an angle of 1.24° with the plane of the pavement surface for transmission and an
Appendix B Page 2 (4)
angle of 2.29° for reception. It simulates the visibility of a road marking to a vehicle driver viewing it at a distance of 30 m.
Description
Ecodyn is installed on a specially equipped one-box vehicle. It comprises a measuring box carried outside the vehicle, an electronic box for sending out and receiving signals, and a microcomputer for data acquisition and processing.
Data acquisition (readings ≈ every 40 cm) does not depend on the speed of the vehicle. The position of the device with respect to the road marking is monitored by the driver using a bargraph situated on the dashboard in the vehicle.
Principle drawing
(Lumière ambiante = Ambient light; Marquage = Marking; Récepteur = Receiver; Emetteur = Transmitter)
Characteristics
Metrological characteristics
Transmission (“entrance”) angle: 1.24° Reception (“observation”) angle: 2.29° Average illumination distance: 6 m Width of illuminated area = 0.5 m
Length of observed area = 1 m; width of observed area = 0.5 m.
Mechanical and electrical characteristics
Host vehicle: climate-controlled one-box vehicle (with a rigid suspension) Measuring box: length = 0.75 m, width = 0.21 m, height = 0.42 m
General power supply by the 12-V battery of the vehicle Light source: 75-W halogen lamp with a life of 3,000 h
Detection of luminous flow received by linear photodiode matrix Reception on 14 tracks.
Appendix B Page 3 (4)
Visualization of a marking strip
(Mesure détaillée sur la distance = Measured values versus distance; Voir toute l’exploitation … = See the full range of data …)
(RESULTATS = RESULTS; Histogramme … = Histogram of retroreflection coefficients (area locations are disregarded in the calculation)
Appendix B Page 4 (4)
Conditions of operation and limitations to use
Clean and dry marking, no traces of salt Weather conditions: dry weather, t° > 5°C Speed: 0 to 110 km/h
Integrated with the traffic stream, no special protection – except on 2 x 2-lane roads (measurements on left edge lines).
Applications
Continuous measurement of the night- and day-time visibility of road markings (readings ≈ every 40 cm)
Representation of results as values averaged over zones with a length do be defined by the operator (100 m, 500 m …)
The measuring range extends from a few mcd/m².lx to about 2,000 mcd/m².lx.
Expression of results
In addition to visual displays in the form of lists and graphs, the results can be incorporated in a data bank and presented in the form of route or map diagrams.
mlpc® equipment items for road condition surveys are designed by LCPC and the Centres d’Etudes Techniques de l’Equipement (CETE).
They are distributed by Vectra, the only company licensed by LCPC for manufacture and marketing.
Head office: 34, rue de Panicale – 78320 La Verrière (France)
Tel.: + 33 1 30 66 01 77 – Fax: + 33 1 30 62 90 06 – E-mail: vectra@vectra.fr
Centre d’Etudes et de Construction
ZI route de Tours – 36500 Buzançais (France)
The information provided on this sheet has no contractual value; LCPC and Vectra reserve the possibility to modify certain supplies and characteristics in keeping with technological developments.
Appendix C Page 1 (1)
Description of the Zehntner ZDR 6020
The ZDR 6020 measures the night visibility of road markings (RL) under day light
conditions. The measuring geometry is fully in accordance with EN1436 and ASTM 1710. Every popular road marking system can be measured. Moreover the ZDR 6020 system is also approved by StrausZert, an accredited test institute. The device is also calibrated to a traceable standard.
The measuring area is illuminated by a stabilized halogen lamp which projects a field on the road that is 6m in front of the measuring head.
The detector consists of 16 V(λ) adapted sensors which measure the retroreflected light over a measuring area which is 500mm wide and 1000mm long. Because the illumi-nated area is larger than the measuring area the system is largely immune against tilts and lifts caused by the vehicle. The day- and stray light gets eliminated by a system which is derived from the lock-in principle. All sensors are aligned by an initial procedure in our laboratory for perfect linearity.
During periodic intervals a dynamic calibration is carried out. A dynamic calibration gives the advantage that the ZDR 6020 measuring system gets calibrated under measuring conditions. In dynamic measuring mode the system gets calibrated to a calibration standard which was measured with a handheld device before. However if there is no possibility for a dynamic calibration also a static calibration can be done while standing.
In measure mode 600 single measurements per second will be done. This high speed data acquisition gives the possibility to measure also under fast changing light
conditions such as alleys. Digital signal processors analyze the signal from every sensor in real time. Software computes the width of the measured marking to adapt software filters for calculating an average RL value from the whole width of the road marking. Additionally the software detects also gaps and raised reflective pavement markings
(RRPM’s) for computing a RL value only from the road marking. Furthermore a self
diagnostic algorithm assures that the system is always in good condition.
Fast data acquisition in combination with a large measuring field gives the advantage that the measuring vehicle can drive up to 120 km/h.
According to the customer needs the interval where an RL average gets stored can be
adapted manually in the software, typically is an interval of 50m but it can also continuously be set down to 10 m.
Appendix D Page 1 (2)
Results with test site number 17, 1L and 4L excluded
Tables D2–D6 show the tables corresponding to Tables 2–6, but when test sites number 17, 1L and 4L have been excluded.
Table D2 The retroreflection at 18 test sites of 200 metres. Average of 1 – 6 measure-ment rounds at stretches of approximately 200 metres.
Test site LTL-2000 Mobile instrument 1 Mobile instrument 2 Mobile instrument 3 Mobile instrument 4 1 110 120 101 223 157 2 260 254 257 367 293 3 279 251 265 362 254 4 260 363 213 464 327 6 353 314 355 362 348 7 247 229 231 319 239 8 263 238 255 342 254 9 178 172 154 278 183 10 242 210 251 371 293 11 365 286 359 451 359 12 383 292 375 374 383 13 215 230 238 411 321 14 359 325 342 487 390 15 338 341 351 374 406 16 307 303 312 194 325 18 359 345 328 475 399 19 489 512 434 385 477 20 507 539 541 444 581
Table D3 The accuracy estimated from field measurements at 18 test sites. Four mobile instruments compared to the hand-held measurements using the LTL-2000.
Instrument RL ΔRL εacc LTL-2000 306 - - Mob. Instr. 1 296 -11 -2.7% Mob. Instr. 2 298 -8 -3.1% Mob. Instr. 3 371 +65 +30.2% Mob. Instr. 4 333 +26 +10.8%
Appendix D Page 2 (2)
Table D4 The precision estimated from field measurements at 18 test sites. Four mobile instruments compared to hand-held measurements using the LTL-2000.
Instrument RLharm RLharm εprec
LTL-2000 306 - -
Mob. Instr. 1 306 30 9.8%
Mob. Instr. 2 306 17 5.7%
Mob. Instr. 3 306 69 24.6%
Mob. Instr. 4 306 30 11.2%
Table D5 The uncertainty estimated from field measurements at 18 test sites. Four mobile instruments compared to the hand-held measurements using the LTL-2000.
Instrument RL RL εunc LTL-2000 304 - - Mob. Instr. 1 271 45 10.2% Mob. Instr. 2 294 19 6.1% Mob. Instr. 3 362 88 38.3% Mob. Instr. 4 326 34 13.1%
Appendix E Page 1 (8)
Measurement locations
1. Measurement point MP1: Tervurenlaan in Tervuren, edge line.
2. Measurement point MP1L: Tervurenlaan in Tervuren, centre line.
3. Measurement point MP2: Meerdaalboslaan in Leuven, edge line.
Appendix E Page 2 (8)
4. Measurement point MP3: N227b-Steenokkerzeel, edge line.
5. Measurement point MP4L: N21 – Nieuwe Haachtse Steenweg–Machelen, centre line.
6. Measurement point MP4: N21 – Nieuwe Haachtse Steenweg–Machelen, edge line.
Appendix E Page 3 (8)
7. Measurement point MP5: Brusselsesteenweg-Zemst, edge line.
8. Measurement point MP6: N227 Mechelsesteenweg–Wezembeek–Oppem, edge line.
9. Measurement point MP7: N227 Tervuursesteenweg-Hofstade, edge line.
Appendix E Page 4 (8)
10. Measurement point MP8: N270 Rubenslaan-Zemst, edge line.
11. Measurement point MP9: N25 Naamsesteenweg-Oud-Heverlee, edge line.
12. Measurement point MP10: E40-Hoegaarden, edge line.
Appendix E Page 5 (8)
13. Measurement point MP11: E40-Oud-Heverlee, edge line.
14. Measurement point MP12: E40-Bierbeek, edge line.
15. Measurement point MP13: E314-Leuven, edge line.
Appendix E Page 6 (8)
16. Measurement point MP14: E19-Vilvoorde, edge line
17. Measurement point MP15: E19-Zemst, edge line.
18. Measurement point MP16: E19-Vilvoorde, edge line.
Appendix E Page 7 (8)
19. Measurement point MP17: E19-Machelen, edge line.
20. Measurement point MP18: Haachtsesteenweg-Kampenhout, edge line.
21. Measurement point MP19: E19-Mechelen, edge line.
Appendix E Page 8 (8)
22. Measurement point MP20: entry E19-Mechelen, edge line.
www.vti.se vti@vti.se
VTI är ett oberoende och internationellt framstående forskningsinstitut som arbetar med forskning och utveckling inom transportsektorn. Vi arbetar med samtliga trafikslag och kärnkompetensen finns inom områdena säkerhet, ekonomi, miljö, trafik- och transportanalys, beteende och samspel mellan människa-fordon-transportsystem samt inom vägkonstruktion, drift och underhåll. VTI är världsledande inom ett flertal områden, till exempel simulatorteknik. VTI har tjänster som sträcker sig från förstudier, oberoende kvalificerade utredningar och expertutlåtanden till projektledning samt forskning och utveckling. Vår tekniska utrustning består bland annat av körsimulatorer för väg- och järnvägstrafik, väglaboratorium, däckprovnings-anläggning, krockbanor och mycket mer. Vi kan även erbjuda ett brett utbud av kurser och seminarier inom transportområdet.
VTI is an independent, internationally outstanding research institute which is engaged on research and development in the transport sector. Our work covers all modes, and our core competence is in the fields of safety, economy, environment, traffic and transport analysis, behaviour and the man-vehicle-transport system interaction, and in road design, operation and maintenance. VTI is a world leader in several areas, for instance in simulator technology. VTI provides services ranging from preliminary studies, highlevel independent investigations and expert statements to project management, research and development. Our technical equipment includes driving simulators for road and rail traffic, a road laboratory, a tyre testing facility, crash tracks and a lot more. We can also offer a broad selection of courses and seminars in the field of transport.