I
N T E R N A T I O N E L L AH
A N D E L S H Ö G S K O L A NHÖGSKOLAN I JÖNKÖPING
T h e p o w e r o f a l l o c a t i o n
A case study at a company concerning the differences in total
production costs between Sweden and China
Master’s thesis within Business Administration
Authors: Brehmer Tommy
Eriksson Nicklas
J
Ö N K Ö P I N GI
N T E R N A T I O N A LB
U S I N E S SS
C H O O L Jönköping UniversityF ö r d e l n i n g e n s m a k t
En fallstudie hos ett företag gällande skillnaderna i totala
produktionskostnader mellan Sverige och Kina
Magisteruppsats inom företagsekonomi Författare: Brehmer Tommy
Eriksson Nicklas
Master’s Thesis in Business Administration
Title: The power of allocation – A case study at a company concerning the differences in total production costs between Sweden and China.
Authors: Brehmer Tommy
Eriksson Nicklas
Tutor: Anderson Helén
Date: 2007-01-30
Subject terms: Absorption cost model, allocation, overhead cost.
Abstract
Background: China is one of the most popular countries to relocate and outsource pro-duction units to. This country has a big advantage when it comes to the manual working cost which is very low. This difference between Sweden and China is huge; the cost of the manual working force is less than one twentieth of the Swedish.
Problem: Massive global relocation of production units can affect some countries in a negative way. One of the most important foundations in the society is that there is a high level of employment and this also contributes for economic growth. This is in terms of both tax incomes for the public society as well as self-esteem for the people.
Purpose: The purpose with this thesis is to examine the differences in total production costs, including allocation of overhead costs for product development and production in Sweden vs. China at a company, in this thesis referred to as Manufacturer AB.
Method: Case study approach with in-depth interviews, phone calls and e-mail follow up. In total 9 respondents consisting of managers in leading positions at Manufacturer AB in Sweden.
Conclusion: The manufacturing cost in the Chinese production unit is about 40-60 per cent compared to the Swedish unit. In the current situation the overhead allocation is 4 % overhead of MC at the Chinese production unit and 133 % at the Swedish unit. The total production costs are not reflected in a correct way per unit. To do a more true allocation, the overhead costs in the Company Group must be identified and allocated in the right proportions on their respective production unit.
By creating an average- and in next step an estimated allocation model we succeeded to do a more justified allocation of the overhead costs on the production units in Sweden and China. This model should be relative simple to implement on product- or unit level and gives a more correct allocation than the current.
However, it is the decision of Manufacturer AB to allocate their overhead as they like, but the estimated allocation model gives a base for strategic decisions on production unit level, referring to; where to locate the production units to reach competitive advantage.
Magisteruppsats inom företagsekonomi
Titel: Fördelningens makt - En fallstudie hos ett företag gällande skillna-derna i totala produktionskostnader mellan Sverige och Kina.
Författare: Brehmer Tommy
Eriksson Nicklas
Handledare: Anderson Helén
Datum: 2007-01-30
Ämnesord Självkostnadskalkyl, allokering, overheadkostnad.
Sammanfattning
Bakgrund: Kina är ett av de mest populära länderna att utlokalisera och outsourca pro-duktionsenheter till. Detta land har en stor fördel när det gäller kostnaden för manuellt ar-bete, som är väldigt låg. Skillnaden mellan Sverige och Kina är enorm; kostnaden för den manuella arbetstiden är ca en tjugondel av den svenska.
Problem: Massiva globala omflyttningar av produktionsanläggningar kan påverka vissa länder negativt. En av de viktiga grundpelarna i samhället är att det finns en hög sysselsätt-ningsgrad som bidrar till ekonomisk tillväxt. Detta gäller såväl skatteintäkter till staten som självkänsla hos folket.
Syfte: Syftet med den här uppsatsen är att undersöka skillnaderna i den totala produktions-kostnaden, inkluderat fördelning av overheadkostnader för produktutveckling och produk-tion i Sverige jämfört med Kina vid ett företag som i denna uppsats refereras till Manufac-turer AB.
Metod: Fallstudie är gjord med hjälp av personliga djupintervjuer, uppföljande telefonsam-tal och elektronisk post. Totelefonsam-talt deltog 9 respondenter bestående av tjänstemän i ledande positioner på Manufacturer AB i Sweden.
Slutsats: Tillverkningskostnaden i den Kinesiska produktionsenheten är ungefär 40-60 procent jämfört med motsvarande enhet i Sverige. I nuläget är overheadpålägget 4% på produktionsenheten i Kina och 133% på enheten i Sverige. Den totala produktionskostna-den speglas inte på ett rättvist sätt per produktionsenhet. För att göra en mer rättvis fördel-ning så måste koncernens totala overheadkostnad identifieras och mätas och sedan alloke-ras i de rätta proportionerna på respektive produktionsenhet.
Genom att skapa en genomsnittlig och i nästa steg en uppskattad fördelningsmodell lycka-des vi att göra en mer rättvis fördelning av overheadkostnaderna på produktionsenheterna i Sverige och Kina. Denna modell borde vara ganska enkel att implementera på produkt- el-ler enhetsnivå och ger en mer korrekt fördelning än den nuvarande.
Hursomhelst, är det upp till Manufacturer AB att fördela deras overheadkostnader som de vill, men den ”uppskattade” modellen ger en bas för strategiska beslutsunderlag på produk-tionsenhetsnivå, som svarar på frågor som; var ska man lokalisera produktionsenheter för att nå konkurrensfördelar.
Table of contents
1
Introduction... 1
1.1 Background... 1 1.2 Problem discussion... 2 1.3 Purpose... 3 1.4 Research questions ... 3 1.5 Definitions ... 3 1.6 Delimitation ... 42
Method ... 5
2.1 Characteristics of the method ... 5
2.2 Choice of company ... 6
2.3 Connection between the study and theory ... 6
2.4 Data collection ... 7
2.5 Analysis of data... 8
2.6 Trustworthiness of the research ... 8
2.6.1 Validity... 9
2.6.2 Reliability ... 9
3
Theoretical framework of cost management ... 10
3.1 Strategic Cost Management ... 10
3.1.1 Total Production Costs... 10
3.1.2 Product Development... 11
3.1.3 Gap – and Product Portfolio Analysis ... 11
3.1.4 Target Costing... 11
3.1.5 Product Lifecycle Management... 12
3.1.6 Identification of Costs... 12
3.2 Categories of Manufacturing Costs ... 13
3.3 Allocation criteria for costs... 13
3.4 Costing Models ... 14 3.4.1 Product Costing... 15 3.4.2 Variable Costing... 15 3.4.3 Absorption Costing... 15 3.5 Overhead Costs ... 16 3.6 Research Model... 17
4
Empirical findings ... 19
4.1 Aggregated costs ... 194.2 Product Development Process Plan ... 19
4.3 Some aspects of performed Product Development... 21
4.4 Production ... 22
4.4.1 Absorption Cost Method at Manufacturer Company Group ... 22 4.4.2 Sweden ... 23 4.4.3 China ... 23 4.4.4 Trading ... 25 4.5 Overhead costs... 25 4.5.1 Sweden ... 25 4.5.2 China ... 26
4.5.3 Trading ... 26
4.6 MC Budget 2007 ... 26
5
Analysis ... 28
5.1 Strategic Cost Management ... 28
5.1.1 Product development ... 28
5.1.2 Product Lifecycle Management... 29
5.1.3 Identification of costs... 29
5.1.4 Product costing ... 30
5.2 Overhead ... 31
5.3 Costing models ... 31
5.4 Company Group Cost Outline... 32
5.5 Scenario 1. Manufacturing cost. ... 33
5.6 Scenario 2. Average allocation. ... 34
5.7 Scenario 3. Estimated allocation ... 36
6
Conclusion ... 41
7
Discussion ... 43
7.1 Authors’ reflections ... 43
7.2 Implications ... 44
Chart
Chart 1-1. Cost per hour for an employer of an industrial worker, (Westerlind
Wigström, 2004)... 2
Figures
Figure 3-1. Absorption costing method (Nilsson, 2003). ... 16Figure 4-1. Absorption Cost Model at Manufacturer AB... 23
Tables
Table 2-1. Amount of Interviews ... 7Table 4-1. Aggregated costs 2005, Company Group. ... 19
Table 4-2. Proportional product calculation Sweden. ... 23
Table 4-3. Proportional product calculation China unit... 25
Table 4-4. Two products that has been moved from Sweden to China. ... 25
Table 4-5. Product calculation trading. ... 25
Table 4-6. Additional overhead costs concerning the Chinese activity. ... 26
Table 4-7. MC budget 2007. ... 27
Table 5-1. Divided costs Company Group... 33
Table 5-2. MC moved products... 33
Table 5-3. Proportional product Swedish production... 34
Table 5-4. Proportional product Chinese subsidiary production... 34
Table 5-5. Costs outlined into Manufacturing and Overhead. ... 34
Table 5-6. Proportional product Swedish production average allocation. ... 35
Table 5-7. Proportional product Chinese subsidiary production average allocation. ... 35
Table 5-8. Trading product average allocation. ... 35
Table 5-9. MC budget 2007 Company Group. ... 36
Table 5-10. Allocation keys Company Group. ... 37
Table 5-11. Administration Overhead Allocation. ... 37
Table 5-12. Sales & Marketing Allocation... 37
Table 5-13. Estimated Allocation Company Group. ... 38
Table 5-14. Additional overhead costs concerning the Chinese activity. ... 39
Table 5-15. Proportional product Swdish production estimated overhead.... 39
Table 5-16. Proportional product Chinese subsidiary production estimated allocation. ... 40
Table 5-17. Trading product estimated allocation. ... 40
Appendices
Appendix 1. Preliminary interview diskussion form ... 47Appendix 2. Detailed questions ... 50
Appendix 3. Product calculation from China... 52
Appendix 4. Product calculation from China... 53
Appendix 5. Absorption Cost Manufacturer AB 2005 ... 54
Introduction
1 Introduction
1.1 Background
In a global market there are opportunities for companies to develop their production effi-ciency. There are many ways to develop production efficiency and one is to reduce costs. In order to maintain the competitive advantage that firms possesses they need to decrease costs in general and production costs in particular. In companies, the reduction of costs is a continuing process. One very big part of the production cost in Sweden is the cost of the manual work time.
The trend is nowadays among many companies to outsource the production or parts of it to geographical areas where the production costs are very low due to the very low salaries (Wallen & Fölster, 2005). The differences in salaries between these areas can vary a lot. Many companies in Sweden have recently relocated or outsourced production to low cost countries (Gatu, 2005). According to Bengtsson, Berggren and Lind (2005) there can be more than 100 000 jobs that have been removed from Sweden in the last five years. They also claim that in a coming five year period, there can be as many as 300 000 jobs leaving Sweden. In addition there can be 200 000 jobs disappearing when taking the suppliers into account (Bengtsson et al., 2005).
China is one of the most popular countries to relocate and outsource production units to. This country has a big advantage when it comes to the very low manual working cost (Gatu, 2005). The difference between Sweden and China in terms of the manual work force is huge; the cost of the manual working force is less than one twentieth of the Swed-ish. Also the level of technological competence and education is increasing in China and this contributes to the relocation and outsourcing phenomena. There is also a growing market in China, which suits the companies that are established there (Westerlind Wig-ström, 2004).
The demand from capital investors for quicker and higher profits has been another driving force to move production to China. It has become more and more common that a ration-alization program in companies contains a relocation of production units (Bengtsson et al., 2005).
Research in this field is pointing at the fact that there is an unused development potential in the Swedish manufacturing industry that not is utilized in the best way. A few researchers even claims that the total production costs do not get lower when companies move their production abroad to low cost countries. Instead, when companies stay in their original country (in-house, for example Sweden) they achieve profitability if they focus on areas like product and production development (Bengtsson et al., 2005). In other words; there are al-ternatives for outsourcing and relocation.
These are the reasons for us to examine this area deeper. This means; is there any eco-nomic reason to keep manufacturing jobs within Sweden. Has it gone too far, meaning are the salaries too high compared to the rest of the world? One company that operates in both Sweden and China is Manufacturer AB. They have product development and produc-tion in both countries and trades products from suppliers in China. They are cooperating with these suppliers when it comes to the development of these products. Therefore, it would be suitable to do a study at Manufacturer AB and examine their total production costs from idea to final product. Compared with theory, the truth are about to be revealed
Introduction
when further looking at the differences in the total production costs in Sweden and China at the company. Finding out where the lowest total cost for production and product devel-opment are for Manufacturer AB.
1.2
Problem discussion
Massive global relocation of production units can affect some countries in a negative way (Wallen & Fölster, 2005). One of the most important foundations in the society is that there is a high level of employment and this also contributes for economic growth. This is in terms of both tax incomes for the public society as well as self-esteem for the people. Given that labour is a big part of development- and production costs, it affects the amount of working opportunities in those areas that are concerned (Gatu, 2005). When the differ-ences are high in certain areas regarding product development and production costs, com-panies choose to move to lower cost areas on the others expense. One of the main driving forces for relocation of production units to China is obvious, and that is the big difference in the cost of manual working force. Compared to China’s manual working force it can be as much as twenty times higher in Sweden as shown in chart 1-1 below.
0 20 40 60 80 100 120 140 160 180 200
Sverige EU Polen Ungern Estland Kina Indien
Chart 1-1. Cost per hour for an employer of an industrial worker, (Westerlind Wigström, 2004).
This big difference in the cost of the manual working force acts as an incentive for compa-nies in Sweden to move or start new production units in China. One of the alternatives for companies instead of relocation could be according to Bengtsson et al. (2005) to put effort into developing the products and increase production competence. These researchers have found out that companies who have done this achieves better result than the ones that have outsourced and relocated production units.
Manufacturer AB is a global company that operates in the manufacturing industry. The turnover is approximately one billion per year. They develop and produce both consumer and professional products with a wide price range. A line of low- and medium-price products manufactured by a subsidiary in China makes it possible to enter new market
Introduction
segments. The fact that Manufacturer AB has production units in both Sweden and China makes it possible to compare the production costs in each country. China is a low salary country and when only direct labour is taken into consideration it is cheaper for Manufac-turer AB to produce in China compared to Sweden. People at ManufacManufac-turer AB claim that they are not really sure if China is the most profitable place to have production in, when taking all aspects into account. These aspects can be the development, administration, sales & marketing, logistic and tied up capital costs. Here it is interesting to see if they use their strategic cost management in a proper way. This means, do they have the capabilities enough to monitor all different cost levels in all parts in the Company Group in such a way that they create the most efficient organisation possible? When examine the calculations concerning the production in each country, we are able to separate the direct from the indi-rect costs. Further we are going deeper into the indiindi-rect costs and sort out where they truly belong in terms of Sweden or China. The managing costs of producing in Sweden and China are going to be measured. After this we can see the differences in the total produc-tion costs for Manufacturer AB to manufacture in China compared to Sweden.
1.3 Purpose
The purpose with this thesis is to examine the differences in total production costs, includ-ing allocation of overhead costs for product development and production in Sweden vs. China at Manufacturer AB.
1.4 Research
questions
• How big is the difference in the manufacturing cost between the production unit in Sweden and China?
• Are there any differences in the current overhead percentages at the production units in Sweden and China?
• Is the allocation of the overhead cost done in a fairly way with all aspects taken into account that can affect the total cost of the products?
1.5 Definitions
Direct Costs – Costs that can be assigned with a certain product. Direct material and Di-rect salary or cost of labour are diDi-rect costs (Andersson, Ekström & Gabrielsson, 2004).
Indirect Cost – Costs that can not be assigned with a certain product. Examples of indi-rect costs are equipment for manufacturing and rental fee for build-ings (Andersson et al., 2004).
Overhead Costs – Costs of management, administration and sales. These costs are com-mon for many departments and can be difficult to divide into indi-vidual products (Andersson et al., 2004).
Expenses – Refers to the total set of indirect costs that are included in the total product cost such as indirect material-, indirect manufacturing-, sales-, admini-stration- and development costs (Andersson et al., 2004).
Introduction
Variable Costing – Only variable manufacturing costs are assigned to products (Drury, 2004). Meaning; specific revenues minus specific costs give a contri-bution. If the contribution is positive and the company has idle capac-ity it can be reasonable to manufacture the product in the short run because it contributes to cover the overhead costs (Ohlsson, 2001). Absorption Costing Model – Summary of all costs at product level, for a particular
prod-uct and activities connected to the prodprod-uct until it is delivered and paid for (Frenckner & Samuelson, 1984).
Total Production Cost – Summary of total direct costs plus indirect costs, such as Over-head costs, at aggregated level. This total cost is distributed down to product level through the Absorption Costing Model (Andersson et al., 2004).
1.6 Delimitation
The Company group operates in a third country; in this thesis called X. However we will only examine the operations in Sweden and China and we do not believe that country X af-fect the final result much.
Method
2 Method
When investigating the differences in total production costs in Sweden and China at Manu-facturer AB, it was preferable to dig deep into the product cost calculations. These calcula-tions reflected how the overhead costs were allocated. The overhead cost includes costs for Product development, Sales & Marketing and Administration. Further, we examined these three and where they were allocated, regarding Sweden or China.
Robson (1993, p40) defines a case study as:
“The development of detailed, intensive knowledge about a single case or a small number of related cases” (Robson, 1993, p 40).
When questions like how and why are going to be examined it is preferable to use the case study approach (Yin, 2003b). How the indirect costs is allocated and why they are allocated in this way, are main questions in this thesis. The case method is also preferred when it comes to in-dept studies of a descriptive type. In other words we had no alternative if it should be an in-depth study. The aim is to go deep enough to find data that will satisfy the purpose of the thesis.
The indirect costs consist of both definable and indefinable costs. Sometimes it can be dif-ficult to estimate correctly the indefinable costs as they often are constructed by humans in a company as a result of different conceptions. These conceptions are often common as-sumptions within certain companies and can also be called culture (Johnson, Scholes & Whittington, 2005). But the main target for this thesis is the costs within Manufacturer AB and the costs that are defined by them.
2.1 Characteristics
of the method
According to Ferreria and Merchant (1992) there are five criteria that characterize a case study. The first criterion is that the researcher should have a deep and direct contact with the members in the organisation that are subject for the study. This is fulfilled because we have had direct contact with the interviewee’s and the information that we received from them was easy to understand and the direct dialogue made it possible to ask follow up questions.
The second criterion is that the study should focus on real, and not constructed informa-tion (Ferreria & Merchant, 1992). This is true in our case because the study is focused on calculations that are used in the company such as absorption costing method. Further, there were more information that was primary in terms of real life situations and costs. The third criterion is that the study does not have to be completely structured from the start but rather to be developed as the study goes on in terms of what the researcher finds out (Ferreria & Merchant, 1992). In our study we used a discussion form from which we developed questions that seemed relevant in each interview and this helped us to develop a direction so we knew were to go deeper and with this, the third criterion is also fulfilled. The fourth criterion is that the result and analyse should contain much and detailed infor-mation from what have been studied (Ferreria & Merchant, 1992). We believe that our study also fulfils the fourth criterion because of the fact that we have received production and overhead cost figures and the product development process.
Method
The fifth criterion is that the study must be published in an academic environment (Ferre-ria & Merchant, 1992). For the reason that this study is a master thesis and it is about to be presented in an academic environment at Jönköping International Business School, the fifth criterion is also achieved.
2.2
Choice of company
It is very important that the source of information that is the foundation of the case study is relevant. The choice of company as a source to gather empirical data from in a case study should according to Ferreira and Merchant (1992) be done in one of the following three ways: First, from a clear purpose, the researcher choose a company that are unique in some way or have some specific facility. That is in terms of more innovative that others or com-panies with some kind of problem. Second, certain criteria such as size and type of industry are the guide when selecting company. The third is, choosing companies without any spe-cific criteria at all. This means companies that the researcher happens to stumble over and find something interesting.
The selection process that we undertook was a combination of all three. This starts with the third alternative above when reading the newspaper with a job advertisement and com-pany presentation. This led to the knowledge that Manufacturer AB had production units in both Sweden and China. This was one criterion in order to compare the total production costs in both countries. This also goes for the purpose for selecting this company.
It turned up during the discussion with the people in the company that they were very in-terested in finding out how the differences in the total manufacturing costs looked like in terms of Sweden and China. They said that they did not have any clear view whether the overhead allocation was fairly calculated or not. They wondered if it really is profitable to manufacture in China compared to Sweden. This is why they gave us full access to their calculated costs. As a consequence of the deep and detailed cost information we received the company wanted to remain anonymous throughout the research.
2.3 Connection
between the study and theory
There are some different types of case studies and for this thesis we have chosen to con-duct the descriptive. The theory for a descriptive case study covers the scope and depth of the research (Yin, 2003a). In order to fully understand where the problem for the thesis are sited the theory are chosen in a specific area. This area is the total cost area in general and the indirect costs in particular. Further, the research also puts some focus on the costs from product idea to the point that the first products reaches the end consumer. This in-cludes theory about the new product development process and product calculation with as much aspects taken into account as possible.
One of the most important parts for this thesis is the current allocation of overhead costs and further on the examination of where they belong. This is in terms of which production unit the overhead costs should be connected to. The theory sources for the basic calcula-tion models and definicalcula-tions are books on the subject. For the deeper study concerning the overhead costs aspects the sources mainly are scientific articles from data bases at the li-brary at Jönköping University such as ABI Inform and Google Scholar. Search words as “cost aspects of overhead”, “total production cost calculation” and “cost management” were used.
Method
2.4 Data
collection
The first step in the data collection process was to in a pre study, make interviews with people which are involved in the calculation of production processes and product devel-opment processes. This is in line with Stake (1995) who claims; the main road to multiple realities is through interviews. This was done in order to in the future know were to go deeper and find more specific data about details in the calculation process.
Notes were taken and key words were written down in order to document the interviews. The two of us (read authors) were present throughout the interviews and when one was asking questions the other was writing down the answers. Stake (1995) mean that it is not the exact words of the respondents that are important but rather what they mean. As a support during the interviews we used a discussion form (see appendix 6 and 1) when gathering information. In this case study we used the interview material as a guide through the whole organisation. When in the second round of interviews the more in-depth ques-tions were asked in order to find out about details (see appendix 7 and 2).
These details are crucial in the determination of where the different aspects of costs are. The data collection were also consisting of gathering material such as numbers, figures and calculations done in the company complemented with more interviews in more specific ar-eas. Cost calculations of products are the main contribution to the study together with the models of how to divide the different overhead costs. This data was evaluated in order to see if there were differences in the calculations of production costs in Sweden compared to China.
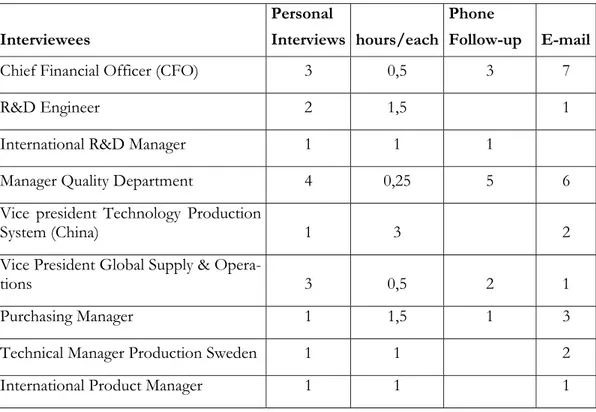
In table 2-1 below it is shown how many personal interviews that were conducted and also the time of each. Further the amount of phone calls is shown and also e-mails that was sent to the different respondents.
Interviewees
Personal
Interviews hours/each
Phone
Follow-up E-mail
Chief Financial Officer (CFO) 3 0,5 3 7
R&D Engineer 2 1,5 1
International R&D Manager 1 1 1
Manager Quality Department 4 0,25 5 6
Vice president Technology Production
System (China) 1 3 2
Vice President Global Supply &
Opera-tions 3 0,5 2 1
Purchasing Manager 1 1,5 1 3
Technical Manager Production Sweden 1 1 2
International Product Manager 1 1 1
Method
2.5 Analysis
of
data
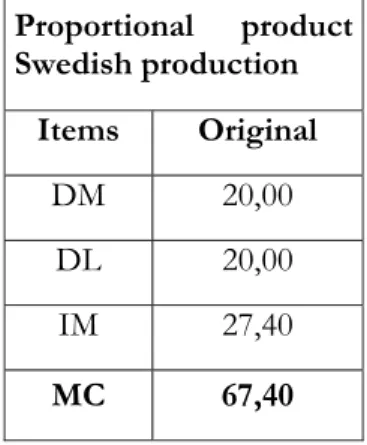
The material gathered was analysed and compared in terms of differences between Sweden and China. The different parts that we have researched are discussed and different view points are described. In order to as Jacobsen (2002, p 230.) says get an overview over col-lected data we wanted to see the effects of the different ways to allocate the overhead costs. According to this we have developed three scenarios in which we are highlighting aspects from different viewpoints. In every scenario there is an analysis with a base model that we developed. This base model refers to the information from interviews and product calcula-tions that we received, and it shows the proporcalcula-tions in the differences between the two countries manufacturing costs. The proportional model looks like:
• Direct material has the same cost in Sweden and China, 20 SEK (including indirect material).
• Direct salaries have the difference 20:1, 20 SEK for Sweden and 1 SEK for China. • The indirect manufacturing costs are 137% for the Swedish production and 765%
for the Chinese production. The big difference in per cent is depending on the fact that it is calculated on direct salary which is very low in China (see appendix 3 and 4).
In the first scenario we compare the manufacturing cost in the two countries. Besides the proportional product calculations we also show two other product calculations. These two products was first produced in Sweden and then moved to the Chinese subsidiary.
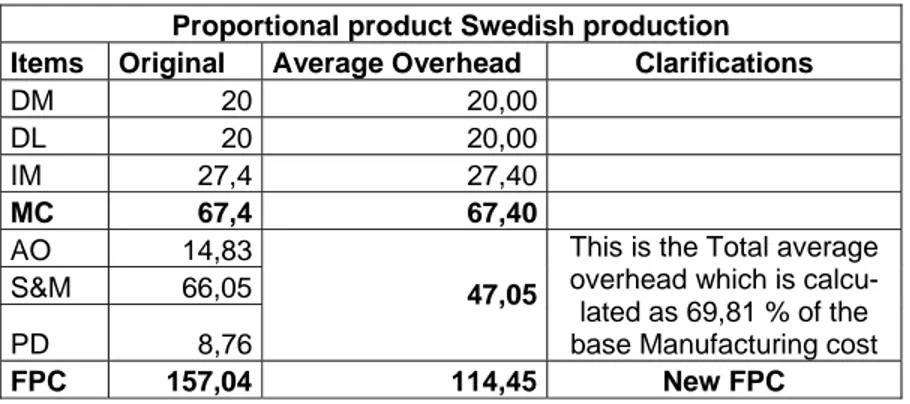
In the second scenario we calculated an average overhead percentage and allocated it on all types of products that the company put on the market. This scenario contains the two proportional product calculations and also one trading product. They are shown with the present allocation and the average in order to be able to compare differences.
The third scenario consists of a more advanced allocation of the overhead costs. Here we are able to take the differences in need of supporting activities into account as well as addi-tional costs that the Chinese activities have. The assumption in this scenario is that the costs should be allocated on products that are causing the cost. This allocation is based on managers’ information that we have received during our interviews. Here the two propor-tional product calculations and the trading product are shown. They are shown with the present, average and the estimated allocation in order to be able to compare differences. In parallel we use the theoretical framework to analyse the findings that are placed outside the product calculation. These findings are to be seen as very important influencers when it comes to the supporting activities and other additional costs concerning the Chinese opera-tions at Manufacturer AB.
2.6 Trustworthiness
of the research
Because of the fact that the Chinese subsidiary is a part of Manufacturer AB Group and has the same responsible CFO, we assume that there are no differences in the trustworthi-ness of the economical information that we have received. In order to secure the in-depth information for the research we conducted a qualitative case study. There has been some
Method
criticism against the qualitative method through the years and especially from researchers that are used to do quantitative studies (Holme & Solvang, 1997). It depends on the aim and time limit of the research if the critique is justified when choosing method.
2.6.1 Validity
According to Holme and Solvang (1997) there are several aspects to take into account in order to get high quality data in terms of usefulness and validity. According to Saunders, Lewis and Thornhill (2000) validity is about whether the research findings really are what they appear to be about. First, the researchers can have problem in experience the situation in a right way (Holme & Solvang, 1997). This is something that the reader has to decide when reading through the thesis. Second there are some risks in that the researchers not completely understand the motives and intended meanings from the object. Third the closeness between the researchers and the object can create some problems in terms of es-timated expectations of the research as such (Holme & Solvang, 1997). To secure that we experienced the situations in a right way we made follow up interviews, both personal and by phone. Further, we believe that the research work have been independent and not con-trolled by the company.
As mentioned in 2.2, choice of company, the company was interested in investigate the present allocation of their overhead costs. In order to in a right way allocate the overhead costs we have to assume that we have received the true figures. Otherwise the company will miss an opportunity to get an illumination of the actual situation and receive new in-formation. If the figures are not true, the incorrectness will strike back on them and they will not get the truth about their allocations.
2.6.2 Reliability
The research process can affect the natural behaviour of the object for the study (Holme & Solvang, 1997). As the core of the thesis is concentrated on the actual costs of production and already finished calculations it is somehow not any room for meanings and intentions. We believe that the research would attain the same result if it were conducted again accord-ing to Saunders et al. (2000) at another occasion. If the research will be conducted with the same interviewees and the same questions the outcome would be the same. This is if they not have been affected of the result of this research.
Theoretical framework of cost management
3 Theoretical
framework
of cost management
The company’s costs arise simultaneously as recourses are consumed in the operations. It is not until the companies use a specific recourse that a cost occurs (Olsson, 2005). Cost in-formation can have several purposes but the main purpose is that the company needs to know the total costs to be able to calculate the right result. When deciding which products to manufacture and sell, the company need to know if the products are profitable or not. If several products are profitable and the capacity is limited, the company has to select the most profitable product mix. The total costs have to be allocated into specific products to determine the most profitable. This is in order to have sources to improve the decision making of the ultimate product mix (Hansson & Nilsson, 1994).
3.1 Strategic
Cost Management
In the Strategic Cost Management area there are several techniques and methods to use in order to control and manage costs. This means different cost analysis methods from a stra-tegic perspective (Lockamy, 2003). The methods are taking different aspects into account from many directions in order to decrease costs. Some of the methods are focusing on the external environment and the fact that it is influencing the companies own cost levels. An-other aspect is that relations and connections between suppliers can be developed in order to generate cost advantages (Lockamy, 2003). Third, comparison between the companies own cost level and competitors’ in order to gather incitement to put effort in developing production processes etc. Fourth, can be that the company should be focusing on costs that are related to activities that have the potential to create competitive advantage, in order to lower them (Ask & Ax, 1995).
When it comes to companies future costs it can be good to plan them in advance instead of trying to attack them when they appears in real time in the actual products. This is impor-tant particular in the product development process. It is in this process, the future costs of the product are set in terms of working methods and raw material. When the product life cycle time is decreasing on products, the work with product development is done more frequently and therefore it absorbs more money in terms of development costs. These are the reasons and motivation for focus on this area (Ask & Ax, 1995).
The production view is significant for the school of Strategic Cost Management rather than the account view in the older schools (Lockamy, 2003). It is highlighted that the most costly details about the production processes are examined and this is the main aspect to focus on in order to cut costs. The literature about product calculations and management are best seen from a production perspective (Ask & Ax, 1995).
3.1.1 Total Production Costs
There are many different ways to calculate the total production cost in companies. It is de-sirable that the calculation models are as right as possible concerning the reality. The term total production cost consists of all costs in the company often allocated upon the products (Ohlsson, 2001). This means the production costs with the overhead costs added. The overhead costs in turn consist of all the different costs associated with the management and accounting divisions (Drury, 2004).
Theoretical framework of cost management
3.1.2 Product Development
In general, the product development projects are company specific and consist of people from different departments in the company. These projects do not create any direct income for the company but rather distributes costs to the future products that are intended to be the outcome of the project. In order to run a specific project the benefit must be larger than the sacrifices in terms of costs for the project. Sometimes it can be hard to estimate the benefits or consequences in the future in monetary terms and then it can be justified to make decisions on an intuitive ground (Olsson, 2005). The most preferable situation from a costing perspective is though when it is possible to make calculations such as increased fu-ture income or decreased fufu-ture costs.
Before the product development process starts it is suitable to research what the customer needs are, and this is often done with some market analysis. One market analysis model that is frequent used is the Gap Analysis. In this analysis it is possible to discover if there are gaps in the market that new products would fulfil. This combined with a product port-folio analysis will determine if the company really has the required products or have to de-velop new ones. The price level for the new product is determined in a price skimming mode where companies try to sense the markets potential as well as the technological com-plexity of the product, and also some effort is put in the design work (Drury, 2004). If the company sees opportunities for a new product or products in the market, the devel-opment goes on. The process can be turned into a budget project with a target which is the selling price. The selling price is then divided and split up into profit, overhead-, labour-, and product cost. In order to enhance the process and the efficiency of the development of the product the product lifecycle time is considered and also the value chain. These are more explained in coming sections.
3.1.3 Gap – and Product Portfolio Analysis
A gap in the market can be that a group is not seen as potential customers or the fact that the market changes over time and a gap occur. In the same way the company looks at the market and tries to find gaps to cover with its products it should also look at it self. This is in order to have a product mix that covers all the desirable segments in the market. At this point the analysis is called a Product Portfolio Analysis. This analysis focuses on the own company products. It is therefore important to monitor the market and the competitors’ movements regarding new products and innovations. It also considers the performance and strengths of each segment and also attractiveness of the segment in order to determine how much effort to put into it.
One of the objectives for doing this analysis is to generate a product mix with an appropri-ate balance between new and mature products (Aaker, 1998). Further it is important to have a product mix that consists of both products that are generating money and not only those that are using cash and this is an important factor to consider in the analysis. The ca-pability to create a good flow of new products prevents the company from stagnation and can enhance growth.
3.1.4 Target Costing
In target costing, main focus is at the competitors’ price level on products (Ask & Ax, 1995). In a sense this way of working is a kind of opposite of the traditional product cost-ing where you start with at look at the material cost and further add the work cost and the
Theoretical framework of cost management
overhead costs and finally summarise all costs into a Product Cost. In the Target Costing model you start with the final price and develop the product to hopefully less cost than the price. The Target Costing model is preferable to use in product development processes be-cause it is good to have control over the price of the final product in an early stage. The price target is concerning all activities that the product development process will include. This will be from the product idea to the stage when the final product has arrived at the customer (Drury, 2004). There are a number of aspects to consider in the product devel-opment process such as calculated sale volume and different construction solutions. The product life time and the estimated customer demand are other factors that have impact on how to develop the product and this also affect the price.
3.1.5 Product Lifecycle Management
In the product lifecycle management process the whole lifecycle time is considered. This means the period of time from initial expenses on research and development to the time that the support to the customers is withdrawn (Drury, 2004). This contains the introduc-tory, growth, maturity and decline. The resources in terms of material are examined in or-der to have the most economical solution. Estimations are made regarding the total sale volume over time. This is in order to make the right calculations and to get the right prices on the products. If a company has an overview over the costs that the products cause dur-ing their life time, it will contribute to create competitive advantage for the company.
3.1.6 Identification of Costs
Since it often is the buyers market, the company’s customers must be in focus. The value chain model by Porter (1985) has been developed to identify and improve customer value. In the value chain model the company is perceived as consisting of a series of processes. These processes contain activities which intend to create customer value or satisfy cus-tomer needs. One important objective of the value chain model is to focus on the activities that contribute to the customer value and minimize the activities that not contribute to cus-tomer value (Ax, Johansson & Kullvén, 2001). By highlighting the activities that contribute to customer value, the costs for them are revealed and identified.
The value chain is divided into primary and supporting activities. The primary activities are: Inbound and outbound logistics, production, marketing & sales and training & service. The supporting activities are; procurement, technology & development, human resource man-agement and firm infrastructure (Aaker, 1998).
The value chain model can be used to improve customer satisfaction, in the meaning of cost efficiency, quality and delivery. This is done by coordinating the individual parts of the value chain together. By identifying the dependence/interdependence between the individ-ual primary parts of the value chain and control that each part is designed to meet the cus-tomer need, cuscus-tomer satisfaction will follow (Drury, 2004).
In order to be successful in doing the value chain analysis Shank and Govindarajan (1992) suggests that a company should compare its value chain with the most common value chain in the industry. By first identifying the industry-specific value chain the company’s in-ternal value chain can be identified. Further the cost drivers that regulate each value activity should be diagnosed. This can lead to in the end that the company can reach sustainable cost advantage by controlling indirect costs better than their competitors. This is obtained by reconfiguring the value chain. Through on-going analysis of the costs, revenues and the
Theoretical framework of cost management
assets in each activity, the company can reach low costs. This is accomplished by compar-ing the company’s value chain with a few major competitors and findcompar-ing the necessary ac-tions to manage the company’s value chain better than competitors (Shank & Govindara-jan, 1992).
3.2
Categories of Manufacturing Costs
Costs referring to cost objects can be separated into two categories. These two categories are direct costs and indirect costs. Direct costs are the costs that can be distinctively and completely identified through a particular cost object. While indirect cannot be distinctively and completely identified by a given cost object. Direct costs can be precisely traced since they are able to be physically identified by a particular object. An approximation must be done of resources consumed by cost objects for indirect costs. Hence, the more direct costs that are able to be traced to a cost object, the more correct the cost allocation is (Drury, 2004).
Direct Material (DM) consists of the material that can be identified in a product (Drury, 2004).
Indirect Material (IMA) material logistics and costs for repairing machines and fixtures which are used for producing many different products are classified as indirect material, since they cannot be connected to a particular product (Drury, 2004).
Direct Labour (DL) consists of the labour cost that can be specifically traced to or identi-fied with a particular product. The wages of operative personnel who put together parts into the completed products or machine staff engaged in the production process are direct labour costs (Drury, 2004).
Indirect Manufacturing (IM) cost contains all manufacturing costs except for direct bour, direct materials and direct expenses. Hence it includes all indirect manufacturing la-bour and material cost, plus indirect manufacturing expenses. Indirect manufacturing costs in a multi-product company add in rent and depreciation of factory and machinery. Manu-facturing overheads cannot be directly traced to products. Instead they are assigned to products by cost allocations. A cost allocation is the practice of estimating the cost of re-sources consumed by a particular product.
This process deals with assigning indirect costs to cost objects. A cost object is any activity for which a separate measurement of costs is preferred. Examples of cost objects are the cost of a specific product, the cost of a particular operating division or something else for which one needs to determine the cost of resources required (Drury, 2004).
3.3
Allocation criteria for costs
There are mainly three criteria for allocation of expenses when calculating product costs. The first criterion is supporting capacity. This is when many expenses have such a charac-ter that it is not possible to say that the calculation object is causing the costs in definite proportions. Examples of these expenses are administration, sales and management. The expenses are allocated with consideration to which supporting capacity the calculation ob-jects have. Examples of supporting capacity are the calculation object’s sales and total pro-duction costs (Ax et al., 2001).
Theoretical framework of cost management
The second criterion is that expenses also can be allocated with the basis of usefulness. This is usefulness that is applied on fixed costs like the internal services of the computer department. In this case it is not possible to discuss in terms of how the calculation objects causes the costs. Instead the calculation object benefits from the internal service. To allo-cate expenses in a short term with only utility as base causes costs in a long term (Ax et al., 2001).
The third and most dominating criterion is allocation by cause/effect. This is done on the basis of how the calculation objects causes costs. From a practical point of view the com-panies often estimate the cost to which extent the calculation object’s causes a certain cost. The variable costs which are sensitive for changes in the production volume are often logi-cally connected to the calculation object. This is called the principle of proportionality (Ax et al., 2001).
In companies that produce and offer many products and services there are several func-tions and departments. For all these funcfunc-tions it is required many kinds of resources which leads to many different costs. Some of these costs have clear connections to the calculation object. Other cost connections to a calculation object is weak or non-existent. In order to keep the cost level at a minimum, companies have to apply a mode of simplicity when they assign different expenses to calculation objects (Ax et al., 2001).
Products with a high profit margin have high supporting capacity in a sense that they can carry higher amount of overhead costs. Products produced in China are seen as low price products and therefore it is in many cases not possible to have high profit margins on these products.
3.4
Costing Models
Traditional costing models such as absorption costing and variable costing are often criti-cised because of the fact that they do not take all aspects into account or are unfair. While in countries like Japan are considered to be fulfilling that objective quite well. Companies are very much aware of the fact that the costs of products are distorted when only volume related allocation keys are used in the calculations (Ask & Ax, 1995). Demand for simplicity is called for in the calculation processes for different purposes. One of them can be in which way the decision processes is worked through. The direction by decision is in the western countries one of the dominating steering tools for managers. Whereas the product calculation information is used in Japan in order to influence and motivate people to reach strategic goals.
The frequent used allocation key direct salary or cost of labour is motivated by the fact that it gets the responsible people to focus on increasing the companies’ staff efficiency. It also makes it easer to visualise the differences between, and substitute the manual working force with automatic machines. Another reason for using the direct salary as an allocation key is that it will be visible and obvious that it is quite a large part in some product calculations. The responsible people strive to make it as small as possible in order to also reduce the amount of expenses added to the product. In this sense, the direct salary is used as an allo-cation key in order to decrease costs and not as in the western countries use it in order to catch a causal connection between products and costs (Ask & Ax, 1995).
Theoretical framework of cost management
3.4.1 Product Costing
Product costing is defined as a compilation of revenues and/or costs for a certain object in a particular calculation situation. For that reason the unique situation will decide the struc-ture of product costing. The costing object may be a product, a project, a market or a cus-tomer. The product costing situation could be constantly returning or temporary and have strategic, tactical and operational character.
The economic effects that will occur in different product costing situations are separated from each other (Ax et al., 2001). The task of the product costing according to Frenckner and Samuelsson (1984) is to be the base for decisions the company will take about pricing, planning and follow up.
3.4.2 Variable Costing
In variable costing the companies do not need to do cost allocations for overhead costs. The variable costing does not show all costs (Hansson & Nilsson, 1994; Drury, 2004). Variable costing is built upon the concepts; specific revenues, specific costs and overheads. Specific costs and specific revenues can be identified with a particular product. The differ-ence between specific revenues and specific costs is defined as contribution. The sum of all the product contributions is called total contribution (Ohlsson, 2001; Drury, 2004).
In a short term the company can accept a product if it gives a positive contribution but in the long run the product mix must be adjusted to give most possible total contribution. (Hansson & Nilsson, 1994). The total contribution must cover the company’s total over-heads which can not directly be identified to the individual products. It must also secure the companies future profitability by obtaining sufficient return on the products (Ohlsson, 2001).
The specific cost for the product is such costs that would not exist if the products were not manufactured and included in the companies product mix. Examples of specific costs are direct material, direct labour, rents of department locals and depreciation of machinery. The overhead costs consist of administration, sales & marketing and product development (Andersson et al., 2004, Drury, 2004).
3.4.3 Absorption Costing
In Sweden the traditional absorption costing is the base for the economic planning and management in most companies (Adolphson, 1995). When it comes to absorption costing it is intended that the company’s all costs should be included in the calculation. The ab-sorption costing is usually defined in Sweden as the sum of all costs for a particular product or other performance connected to it, until it is delivered and paid for. This includes guar-antee costs. It is observed that companies in practice not include all costs in the calcula-tions (Frenckner & Samuelsson, 1984).
It can turn out to be complicated to investigate the cost structure since companies use dif-ferent absorption costing models in difdif-ferent calculation situations. In a given costing situa-tion the models have different appearance in terms of indirect and direct costs, depending on the objects for which costs are calculated (Ask & Ax, 1997). An absorption costing model for a product which is labour intensive and manufactured by the company differs in terms of direct and indirect costs from a product model there the product is outsourced to a supplier.
Theoretical framework of cost management
In the absorption costing model all the costs arising in the company are allocated on the products. Within absorption costing it is meant that every product should cover its part of the costs it is causing (Ljung, 1993). The calculation objects’ variable- and allocated over-head costs are the fundaments of the absorption costing. The allocation of the overover-head cost is done standardized some simplifications are made. Often the calculation is connected to the accountancy. In the absorption costing it is often discussed in terms of direct and indirect costs. The method for the calculation is shown in figure 3-1 below.
Direct material Direct labour Indirect material
Indirect manufacturing costs
Manufacturing Costs (MC, sum of above) Administration overhead costs
Full cost (sum from MC and down) Profit margin
Figure 3-1. Absorption costing method (Nilsson, 2003).
There are two basic methods for absorption costing. These are process costing and job costing. Period costing is used when a company only provides one product or service and is therefore often used at mass production. Order costing is suitable when the calculation objects differ in terms of resources used. When the company is about to consider which of the two calculation methods to use, the decision is based on either the number of prod-ucts/services or the grade of similarities or the differences between them (Ax et al., 2001). At order calculation the absorption costing consists of the calculation object’s direct costs plus allocated expenses that are connected to a specific customer order which are calcu-lated in two steps. First the direct costs for the calculation object are calcucalcu-lated and later the overhead are allocated with additional charge. The distinction between direct- and overhead costs is done in the way these items are registered in the bookkeeping. Costs should as far as it is defendable be regarded as direct costs (Ax et al. 2001).
3.5 Overhead
Costs
Ligon (2006) argues that 90 % of the companies do not know the exact size of their over-head costs. He also claims that the right selling price can not be correctly calculated when the companies do not know the total overhead costs. What companies often do know quite well are the direct labour, direct material and the equipment for individual jobs and how much return they would like to have on the job. The aspect missing at this point is the overhead percentage. Companies in the situation of not knowing this percentage are just guessing when they try to calculate a reasonable price on the job. In all the jobs the
compa-Theoretical framework of cost management
nies charge, the gross margin percentage is required to be bigger than the overhead per-centage.
In the situations that the gross margin percentage is bigger than the overhead percentage the companies will show a return on their products. Logically under the condition that the gross margin percentage is smaller than the overhead percentage the companies will show losses. It is of great importance to divide the businesses into departments. The reason for this is that each department has a different and individual overhead. To obtain the right selling price the companies must find each individual department overhead cost. This is needed to be done so that the companies can calculate the appropriate overhead percent-age that further on will be allocated to the individual jobs (Ligon, 2006).
Armistead, Bowman and Newton (1995) argues that companies competing in a price sensi-tive segment have more focus on operating, overhead and supply costs than companies competing in a less price sensitive segment. The authors also state that the awareness of the need of the control of overhead costs in manufacturing industries may depend more on the capability of precision of accounting systems to determine cost of unit production than of the character of the manufacturing production. Nevertheless the two are related to some degree.
In manufacturing companies the accounting systems generally are constructed to suit calcu-lations concerning cost of unit production as well as overhead allocation. However, there is a discussion with reference to the appropriateness of the established book-keeping practice to generate correct overhead allocation. These cost allocations is the core of the economic production control systems in manufacturing companies.
Armistead et al. (1995) claims that there exist common perceptions for managers within the same industry sector how to make the overhead allocation. By challenging the industry sec-tor recipe or “rules of the game” concerning allocation of overhead costs, managers in each separate company can develop a more correct allocation model. This allocation model can be adjusted to the specific manufacturing conditions the managers’ deals with (Armistead et al. 1995).
3.6 Research
Model
This is our Research Model which we use as a tool in order to describe and analyse the em-pirical material in the thesis.
Strategic Cost Management – Take control over and manage costs. ¾ Product Development – Customer demand in design and functionality. ¾ Gap – and Product Portfolio Analysis – Determine gaps in the market and
impove the product mix.
¾ Target Costing – Managing and secures the cost on a right level with the price as a starting point.
¾ Product Lifecycle Management – Overview over the costs that the products cause during their lifetime.
¾ Identification of Costs – With a value chain perspective identify the actual costs. ¾ Total Production Costs – Consists of production- and overhead costs.
Categories of Manufacturing Costs – Direct Material (DM), Direct Labour (DL) and Indirect Manufacturing (IM). IM consists of the costs that not can be traced directly to specific products.
Theoretical framework of cost management
Allocation criteria for costs – Mainly three, which are: Supporting capacity, bases of usefulness and cause/effect.
Costing Models
¾ Product Costing – A base for pricing, planning and follow up.
¾ Variable Costing – Specific revenues minus specific costs and overheads. ¾ Absorption Costing – All costs should be included in this calculation. Overhead Costs – Reasons for allocation. Company specific allocation.
Empirical findings
4 Empirical
findings
4.1 Aggregated
costs
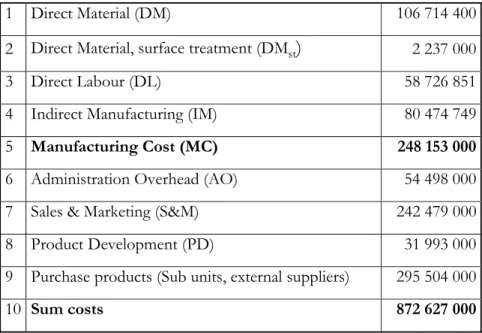
In table 4-1 the costs of the whole Company Group of Manufacturer AB in SEK (2005) are presented, divided to some extent into the different categories that are used in their Ab-sorption Cost Model.
1 Direct Material (DM) 106 714 400
2 Direct Material, surface treatment (DMst
)
2 237 0003 Direct Labour (DL) 58 726 851
4 Indirect Manufacturing (IM) 80 474 749
5 Manufacturing Cost (MC) 248 153 000
6 Administration Overhead (AO) 54 498 000
7 Sales & Marketing (S&M) 242 479 000
8 Product Development (PD) 31 993 000
9 Purchase products (Sub units, external suppliers) 295 504 000
10 Sum costs 872 627 000
Table 4-1. Aggregated costs 2005, Company Group.
4.2 Product
Development Process Plan
The Product Development Process starts with the departments marketing and sales analys-ing the current market. They are usanalys-ing some analysis models such as Gap Analysis which determines gaps in the market as well as in the own product spectra. This product spec-trum is further examined through a Product Portfolio Analysis. This is in order to see if the gaps could be covered with either new products or modifications of old ones. This is there-fore also an examination of potential market opportunities in the market. In this way they found out that there were some market opportunities in the very cheap segment. They were not able to produce these products in Sweden because of the high cost level. There-fore they started to manufacture in China which made it possible for them to have cheap production in China.
We have been introduced to some examples of products that were based on a Gap Analy-sis. These products are within the high volume and low price segment. The development was done in China and the production is also taken place there. It is however not possible to be competitive in every segment. The company concentrates its efforts on the most suit-able opportunities.
In countries like China the traditional trade is more common and in the western countries the modern trade is more established. Traditional trade is when the sales people sits and
Empirical findings
wait for the customer to phone the company and place an order. Modern trade is when the sales people are seeking up the customer and looks after his/her needs and supports the customer in many ways.
The company uses some external support functions in their market research processes both in Sweden and China. The cost of a support function in China is 150 SEK per hour whereas in Sweden it costs 800 SEK per hour.
Manufacturer AB uses a standardised model for the decision processes called activity man-ual. Comprehensive decisions concerning development projects are taken by the product council. The council takes the decisions from a base consisting of document developed in previous research. Additionally they take decisions about pre-study, launch, further devel-opment and resources for different projects. A product develdevel-opment project goes through four formal decision stages:
Decision 500 is an economical and technological pre-study. It includes market research analysis and meetings concerning the design and the construction of the product. The re-sult works as a base for decision of the survival of the concept to the next level.
Decision 1000 means project start. The decision is taken on manager level which even de-cides upon a follow-up plan. The project group is formed and different tasks are allocated to specific group members. Scanning and measuring of the product is done in order to cre-ate drawings and computer files. From here it is common to do loops up to marketing and sales department regarding design changes for more suitable solutions for manufacturing. Decision 2000 is an approval of manufacturing. This decision is taken on the same level as previous decision. The decision on where to produce the actual product is taken in terms of Sweden or China. It also includes the tools that are necessary to be able to produce the product in an efficient way.
Decision 3000 is a formal approval of free sale of the finished product. It can take some time to reach this stage because of the complexity and the low amount of sold products. The different decision alternatives; 1000-, 2000-, and 3000- level are to be seen as approval to the next level. They are also to be seen as request about further research in an earlier stage or to finalise a project. There is some room for flexibility between the stages in order to not slow down a project only for the reason waiting on a formal decision. These infor-mal decisions should be taken between the CEO, division manager and responsible project leader.
The administration of product development process is done in Sweden. In the product council the decision are taken about were to produce the new products in terms of Sweden or China. In this council there are people from different functions present in order to have as much aspects as possible taken into account. If the new product type is high-tech, capital intensive and the volume is high, then Sweden is suitable for the production of the prod-uct. China is chosen as production place when the product types are labour intensive and has lower need for capital in the products. Regarding the volume aspect it is profitable to produce both large and smaller volumes in China whereas in Sweden it is only profitable to produce the larger. This is due to the differences in cost levels, where Sweden has the high-est level.
Empirical findings
4.3
Some aspects of performed Product Development
The Chinese product development people are competent and flexible. They are careful and accurate when designing and constructing the tools and products in the development proc-esses. They are working rapidly and always have time for new projects. When they know what to do they perform very well.
“It feels like they always have spare time when it comes to taking in new projects and you do not have to wait as much as in Sweden for them to get things done”- R&D Engineer, (2006-10-05).
The average cost and time for making tools is about 4 Millions SEK and 16 weeks in Swe-den whereas in China the same tool is about 1,5 Millions SEK and takes 6 weeks to de-velop.
If it is necessary to do loops in the product development process it is not so expensive in China compared to Sweden.
The most costly part of a new product is the platform development. The platform is the base from which new product versions is developed. The costs of this are in all cases taken in Sweden. After this stage the development is divided into China and Sweden and new versions are developed in each country. The control and the management of the two de-velopment units are made from Sweden. There are only a few persons working in the Chi-nese factory that are developing the new versions in China. As a follower to this, almost all cost for the product development processes are taken in Sweden. Sometimes when errors or a delay in the product development process occurs, a part of prototypes has to be flown between China and Sweden.
One part of the costs of product development department is related to the collaboration with external suppliers. Here the company is designing and developing new products to-gether with their suppliers. This is very risky because the suppliers also will sell the prod-ucts to competitors and in this way damage the uniqueness of the company’s prodprod-ucts de-sign etc.
“It is a disaster, strategically, to give away full access to the documentation concerning design and product development to external suppliers because we can not control what they do with it” – Purchasing Manager, (2006-10-05).
A natural inertia is inherent to the system which has to do with the historical background of the dictatorship in China. This inertia is not measured in terms of time and money the company just deals with the problems as they occur.
Due to the less capital need to introduce a new product line in China the risk is less. But the fact that the investment is in China and far away it can be hard to control. In Sweden the production is very capital intensive and it takes product series of high volumes to fi-nance the product line.
“We took over a factory unit from the red China, which had its red governmental management” – Purchasing Manager, (2006-10-05).
According to the respondents there is a very high risk for being copied in China because of the not so sufficient copyright brand laws. The Chinese government has some problems in controlling the copyright laws. It is most suitable to produce the low price products with low development costs in China. Therefore the company is not producing the most