Visual appeal versus usability
A quantitative analysis of the importance of visual appeal and
usability in e-commerce
MAIN FIELD: Informatics
AUTHOR: Gustav Haglund & Clara Mood Román SUPERVISOR: Ida Serneberg
This final thesis has been carried out at the School of Engineering at Jönköping University within informatics. The authors are responsible for the presented opinions, conclusions and results.
Examiner: He Tan
Supervisor: Ida Serneberg Scope: 15 hp
Date: 2020-03-29
Postal address Visiting address Phone
Box 1026
551 11 Jönköping Gjuterigatan 5 036-10 10 00
Abstract
Unappealing websites are rejected quickly upon visiting them, while visitors spend more time on visually appealing websites before judging its reliability; but to what extent can visual appeal alone carry the success of a website, and is it so powerful that good usability can be sacrificed? This paper studies the respective importance of visual appeal and usability in e-commerce as factors, in order to determine which factor plays the bigger role in generating trust and credibility for an
e-commerce site, as credibility perception is highly correlated with its visual complexity. The relation between these two factors and the likelihood to make a purchase is also discussed. Two prototypes for a fictional consumer electronics e-commerce website were created: one with good design and flawed usability, and another with flawed design and good usability. These prototypes were shown to students aged 20-25 and asked which one they found more trustworthy and which they would rather make a purchase from. With the correlation between trust and purchase intention being apparent, the design of an e-commerce website for consumer electronics should focus mainly on the visual appeal. Usability seems to have some value, however it does not seem to be of the same importance as the visual appeal of the site in regards to generating trust, and
consequently customers. The prototypes were constructed in Adobe XD, demonstrated with video recordings, and sent out in a survey to 70 students.
Keywords
User experience, UX design, e-commerce, visual appeal, usability, trustworthiness
Acknowledgements
We would like to extend our thanks to our supervisor Ida Serneberg for her invaluable help during the work process of this thesis, sociology professor Carina Mood for her input on our quantitative research design, programme manager Sonny Johansson at Jönköping School of Engineering for sharing our survey with his students, head of statistics Jan Johansson for providing data useful to our scope and sample definition, and to everyone who participated in the survey.
Table of contents
1. Introduction 7
1.1 Background 7
1.2 Problem statement 7
1.3 Purpose and research questions 8
1.4 Scope and delimitations 8
1.5 Related work 8
1.6 Research gap 9
2. Method and implementation 10
2.1 Approach 10 2.2 Research design 10 2.3 Work process 11 2.4 Data collection 12 2.5 Data analysis 12 2.5.1 Cross tabulation 12 2.5.2 Arithmetic Mean 12 2.6 Reliability 13 2.7 Internal validity 13 2.8 External validity 13 3. Theoretical framework 14
3.1 Link between research questions and theory 14
3.2 Visual appeal 14
3.2.1 Minimum design, simplicity, and 80/20 14
3.2.2 Consistency 15 3.2.3 Feedback 15 3.2.4 Forgiveness 15 3.3 Usability 15 3.3.1 Effectiveness 15 3.3.2 Efficiency 16 3.3.3 Learnability 16 3.3.4 Errors 16 3.3.5 Memorability 16
3.4 Source Credibility theory 16
4. Empirical data 16
5. Analysis 17
5.1 Comparing the prototypes 17
5.2 RQ1: Does high visual appeal generate a stronger sense of trust than high usability when
5.3 RQ2: Does high trust for a company affect purchase intention? 20
6. Discussion and conclusions 21
6.1 Findings 21
6.2 Method 21
6.3 Implications 22
6.4 Future improvements 22
6.5 Conclusions and recommendations 23
6.5.1 Further research 23
References 24
Appendices 26
1. Introduction
1.1 Background
Unappealing websites are rejected quickly upon visiting them, while visitors spend more time on visually appealing websites before judging its reliability (Lindgaard et al. 2011); but to what extent can visual appeal alone carry the success of a website, and is it so powerful that good usability can be sacrificed? This paper studies the respective importance of visual appeal and usability in e-commerce as factors, in order to determine which factor plays the bigger role in generating trust and credibility for an e-commerce site, as credibility perception is highly correlated with its visual complexity (Tseng et al. 2014). The relation between these two factors and the likelihood to make a purchase is also discussed.
According to a forecast by Statista, the e-commerce market is steadily increasing in popularity and will continue to do so in the near future (Statista 2019). With this increasing importance of e-commerce, websites and other digital channels have become a vital tool for communicating with and recruiting new customers in a business. As more businesses move towards digitalization to provide their services, the look and usability of these channels need to be developed to match the needs and wants of the audience.
Specifically, this paper investigates how visual design and usability affect the user experience, when each factor respectively is prominent in an e-commerce design. The focus is on how users react to websites with identical information architecture that have deliberately been designed with one of these two factors in mind. The identical information architecture eliminates potential unwanted factors that could affect the participant’s assessment. Participants of this study were exposed to recorded demonstrations that feature online shops for consumer electronics, a significant purchase category for the study’s target demographic (PostNord 2019). The motivation behind this study is to build upon the notion that visual design is important in a user interface, and to further explore
how important it is in comparison to the usability of an interface.
1.2 Problem statement
E-commerce websites with poor visual design suffer from users having less trust in them, in comparison to those with a higher quality design. On the other hand, there is an issue for websites with long or complicated check-out processes or otherwise poor usability that users give up on before completing their orders (Wong et al. 2014).
The consumer electronics market is the focus for this study, investigating how the look and usability of consumer electronic online shops is evaluated by the user. Statistics show that
consumer electronics is one of the top three categories of buying online (Statista 2018) and most of these products are considered to be high-involvement purchases. These kinds of products tend to be related with high costs, complex decisions and extensive gathering of information prior to purchase.
1.3 Purpose and research questions
It has been proven that visual appeal has high importance for the user of a system or product, as stated in Lindgaard et al. 2011 (p. 1): “Even when the task does not require us explicitly to assess visual appeal, it appears to affect other kinds of judgments [...]”. At the same time, the system has to be usable in order for people to commit to a purchase (Wong et al. 2014). Thus, the purpose of this study is: to investigate how important visual appeal is compared to usability in an e-commerce environment and how they are connected to purchase intention.
The first research question will seek to answer questions about the respective importance of visual appeal and usability: RQ1) Does high visual appeal generate a stronger sense of trust than high usability when shopping online for consumer electronics?
The second research question will focus on the purchase intention connected to the judgement investigated in the first research question: RQ2) Does high trust for a company affect purchase intention?
1.4 Scope and delimitations
This study’s primary target group are University students in ages of 20-25. Discussion and
conclusions made based on test results are limited to students within this age group. People in the ages of 20-25 years old, including students, are becoming increasingly dependent on having functioning electronic devices to connect and interact with their school and studies. For this reason, the chosen group potentially serves as an indicator of a bigger trend.
1.5 Related work
On the subject of visual appeal and its relation to the emotion of the user, several studies and articles determine that visual appeal is the factor that affects users the most when judging
e-commerce stores. Two publications were found to have a similar layout of their study as the one of this paper.
Similarly to this study, the researchers in “Economic and subjective measures of the perceived value of aesthetics and usability” (by Tamar Ben-Bassat, Joachim Meyer, and Noam Tractinsky)
manipulated two factors (aesthetics and usability) in the system that was being evaluated.
However, in their study, the researchers focused on investigating how much the two factors affect the judgement of each other when one is manipulated. For example, to what degree will the judgement of a system’s usability be affected by manipulations of its aesthetic?
Another similar study is “An Exploration of Relations Between Visual Appeal, Trustworthiness and Perceived Usability of Homepages” by Lindgaard et al. (2011). A significant part of the research conducted in the study identified specific visual attributes that appear to contribute to different judgments, and the extent to which judgments differing in cognitive demands (these being aesthetics, usability, and trustworthiness) may be driven by the visual characteristics of a web
page. They measured these factors for a variety of websites, analysing their importance and how much interaction that is required to make a sound judgement on a site.
In Robins et al. (2008), they investigate how different levels of visual appeal affect the perceived credibility of a website. They hypothesize that websites with high visual appeal (in their words, high aesthetic treatment) will be perceived as more credible by the visitors. Also, they measure the time it takes for users of a website to make credibility judgements. To uncover whether websites with high aesthetic treatment (HAT) generate higher credibility than websites with low aesthetic treatment (LAT), Robins et al. conducted an experiment where 20 participants made evaluations of an informative website on the topic of web accessibility.
1.6 Research gap
It has been proven that the looks of a website does influence the user’s impression of it, and consequently whether or not they want to commit to a purchase on the site (Wong et al. 2014). However, there is still research to be made on the individual impact of visual appeal and usability on the user’s overall judgement.
Previous studies made on the subject of comparing visual design and usability have focused on the effect these two factors have on each other. One such study is “Is beautiful really usable?” by Tuch et al. (2012), where they measured the correlation between the two factors when one was
manipulated. The focus in this study, however, is not on the correlation between perceived visual appeal and usability, but instead which one is more important and influential on the user’s overall judgement and purchase intention. Tuch et al. had more focus on the effects usability can have in other factors of a website, and concluded that poor usability can affect the perceived level of visual appeal.
In “An exploration of relations between visual appeal, trustworthiness and perceived usability of homepages” by Lindgaard et al. (2011) they come to the conclusion that all judgements they measured are highly affected by the visual appeal. The same outcome is present in this study but here, this outcome is produced by exposing users to a demonstration of a website instead of an actual website. Additionally, this study compares the users’ judgements to their purchase intention on an online shop. Also, in this study, the participants’ perceived visual appeal did not define which website was more visually appealing; instead, established definitions and theories in graphic design served as a foundation for producing a more accurate representation of a “good design”.
In Robins et al. (2008), the 20 participants made 840 credibility judgements in total. The number of judgements is high, but the judgements come from a relatively small group of people. The participants were instructed to judge the websites quickly, possibly to capture the first impression of the websites. They conclude that a website with high aesthetic treatment does in fact generate a higher sense of credibility. Robins et al. include the time aspect of making judgements, and while capturing the first impression may be informative, this thesis wishes to reflect a real life situation, in
which the visitor of a website is not limited by time. Also, Robins et al. base their experiments on an informative website, while this thesis focuses on e-commerce websites.
Both the study by Lindgaard et al. (2011) and Robins et al. (2008) are examples of cases where a relatively small sample size was used. However, these two studies are examples of research that has used a sample size of approximately 20 participants to produce results and draw conclusions. In order to produce a result that allows for general claims, which is the ambition of this study, 70 participants were involved in the research for this paper.
On the topic of trust and credibility, and the connection to perceived visual appeal, the study “Aesthetics and credibility in web site design” by Robins et al. (2007) measured how fast users make judgements of a website in general, and how visual appeal can affect this judgement. Robins et al. have a strong focus on the instinctive response to different stimuli and how fast this
instinctive response is produced. In contrast, the answers collected from the participants for this study are not necessarily instinctive ones. It seems to be commonly known that the judgement occurs quickly upon visiting a website and this paper does not seek to validate that aspect, but instead focus on the individual importance of visual appeal and usability.
2. Method and implementation
2.1 Approach
The study adopted a quantitative methodology, to be able to present readers with unambiguous numeric results that are easy to interpret and take into consideration when deciding what to focus on during the design process of an online shop. While qualitative methods aim to understand underlying reasons of a problem by letting individuals reflect on them, quantitative methods are more focused on comparing relationships between variables by producing numerical data (Creswell 2013). Since this study seeks to uncover relationships between visual appeal, usability, trust and purchase intention, the quantitative approach was a natural choice. Also, a quantitative approach was expected to more easily recruit a bigger sample size since it is less demanding; it does not require the participants to provide their reflections and reasonings in a lengthy statement. The wish to recruit a relatively big sample size is to enable generalizations to be made from the results produced, with generalization being a common motivator for choosing quantitative methods.
2.2 Research design
The starting point was to create two hi-fidelity prototypes from scratch: one with focus on good visual design but flawed usability (Prototype X), and another one with good usability but flawed visual design (Prototype Y).
The description of what good usability is in ISO 9241-11:1998 (and the revised version of this documentation) was used when defining its opposite (flawed usability). In the ISO-description of usability, the concepts of effectiveness, efficiency and satisfaction are mentioned as indicators of
good usability. The conclusion was that the following factors should be implemented as signs of flawed usability in Prototype X:
1. More possible routes to reach the end goal than necessary. 2. Failure to present the user with important information.
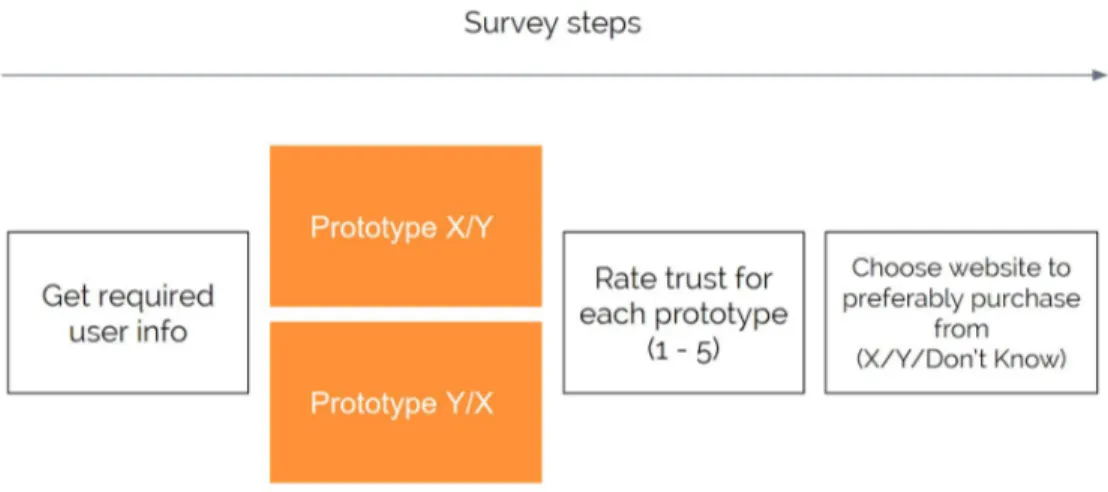
The survey had five sections; an introductory section, a section containing the demo of Prototype X and its associated questions, a second section containing the demo of Prototype Y and its associated questions, a section evaluating purchase intention and a final section that allowed the participant to leave a general comment. In the second and third section, participants were
presented with recorded demonstrations of the two different versions, showing the most effective user journey for each version. The order of which the demos were presented was randomized to counterbalance potential order effect.
Figure 1. Visualization of survey continuum
2.3 Work process
The work was initiated by designing and sending out the survey to participants with demographics that match the one defined in the scope. The order in which participants viewed the prototypes were randomized, resulting in some people seeing and evaluating Prototype X first, while some saw and evaluated Prototype Y first. The decision of randomizing the order of the sections was made to counter a potential order-effect on the evaluation of the prototypes.
The survey was sent out to the people of suitable demographics by contacting them personally, and with help from teachers that distributed the survey to their students and classes. Upon receiving the survey, the participants were introduced to the experiment with brief information about the purpose of the study they participated in. They were asked to provide an email, which was used as their entry to a raffle for a gift card at Filmstaden. Two participants were announced as winners
after the final deadline for taking the survey. The movie ticket was sent via email to the winners, while all other participants were informed that the winners had been contacted.
2.4 Data collection
Data was collected from 70 survey participants. The questions asked associated with each demo regarded the participants’ trust for the company, based on their impression of it. The questions were answered on a five-point scale to rate different aspects of the demo. On the scale, rating one is the lowest and rating five is the highest. For example, the question regarding trust towards
Prototype X looks like this:
How would you rate your level of trust in website X?
Answer on a 5-point scale where: 1 = very low trust, 2 = low trust, 3 = neutral, 4 = high trust and 5 = very high trust.
● 1 ● 2 ● 3 ● 4 ● 5
After evaluating the two prototypes separately, the participants were asked to choose which prototype they would rather purchase a product from. Lastly, they were given the chance to leave a general comment at the very end of the survey. The survey was carried out through Google Forms, allowing the data to easily be exported into a spreadsheet.
2.5 Data analysis
The methods chosen for the data analysis fill the primary purpose of detecting positive relationships between the measured variables. This process has primarily adopted different
approaches of bivariate analysis, in order to present possible correlations between independent and dependent variables.
2.5.1 Cross tabulation
In a cross tabulation, the amount of responses for different variables are compared. It allows the researcher to detect any big differences in frequency for some answers. In the case of this study, the independent variables are put in columns, and the dependent variables are put in rows. Their values intersect, and show the number of scores for different combinations of the variables. The point of using cross tabulations in our case is to uncover any relations between variables, for example visual appeal and trust.
2.5.2 Arithmetic Mean
By calculating the mean value of trust for different prototypes, comparisons can be made between level of trust, high usability and high visual appeal. The mean level of trust will be calculated for both prototypes overall, as well as for trust ratings within the different purchase choice groups.
There will be three groups: one for each of the different choices for the final purchase intention (Prototype X, Prototype Y and I don’t know). This will also allow for an analysis of the potential correlation between purchase intention (the purchase choice) and the level of trust (the level of trust for a prototype within each purchase choice group).
2.6 Reliability
Some of the students in the target group might be studying or have studied one or more topics that are evaluated in the survey: some programs include courses related to website design, particularly front-end design which will be a primary focus in this study. If a large number of students with experience in this area are participants of the study, there is a risk of misrepresentation as they might view things from a certain point of view or focus on details that might have otherwise been overlooked in the design. Therefore it has, in the participant recruitment process, been important to try and reach a wide variety of students from different programs to get the best possible
representation in the collected data.
The crafting of the website prototypes for the research study were created with Adobe XD, using the knowledge and theories of interaction design as a guide for the design. If a new prototype were created by others from scratch, it would be a certainly different design every time, as designs might take inspirations from other existing e-commerce sites. Due to this endless possibility of designs, it is impossible to get the same exact results twice (even if asking the same participants) if the
prototypes are designed by others. However, this inescapable factor is the reality for this study as well as any real life website. To minimize the effect of this subjective factor, the researcher should take into consideration what the scope of the study will be, who the target audience is and what the study wants to test, and from there design the prototype in accordion to theory.
2.7 Internal validity
As testing was conducted through an online survey instead of in a controlled environment, it was difficult to ensure and measure the dedication of the participants and the depth of their
observations when viewing the prototype demo. It might cause an imbalance in judgements, as some might have viewed it multiple times and others just once. It’s possible that participants that looked at the prototypes several times had stronger judgement than those who did it once or twice, that they reflected in greater detail to what was shown and noticed some key differences that made the prototypes more or less trustworthy to them. This in turn could lead to some scores being better representation than others, as someone watching the demos briefly might score the prototypes more neutrally. An experiment executed in a controlled environment could provide information regarding how long each participant interacted with the prototypes, possibly providing additional information regarding individual scorings.
2.8 External validity
The scope of this study limits the research to be conducted with students in the age group of 20-25, a population that is a significant target group for online consumption of consumer electronics in
Sweden (Statista 2018). While students of this study might look on the presented prototype demos with a more critical view based on individual knowledge and taste, it’s uncertain to what extent (if any) this would affect the end results and if it would be representative of students outside of this age group or in other countries than Sweden. Again, it’s crucial to reach students with dividing experiences and education to acquire the most generalized results for representation.
3. Theoretical framework
3.1 Link between research questions and theory
To accurately answer the research questions, it was important to consider and apply established definitions and international standards when designing the prototypes. While some aspects of design and usability are subjective or sometimes difficult to generalize, several objective quality standards were crucial to the designs, both for the individual designs and as overall standards.
The research questions for this paper are focusing on subjective opinions; they ask about a user’s trust towards a website. To not steer too far from the scope of the study, the framework focused on these standards and definitions to portray websites that were believable enough to be existing products rather than trying to define what and how user trust is defined in relation to the study.
3.2 Visual appeal
The term “visual appeal” inherits a subjective meaning, and is decided by the person expressing their judgement. To counter this subjectivity, generally accepted definitions of the subjective terms must be used in the study. This study regards “good design” as the established principles and standards of graphic design (GD) defined by GD professionals and researchers.
In “Digital Design Essentials: 100 ways to design better desktop, web, and mobile interfaces” by Rajesh Lal (2013, p. 10), the best practices for a human-computer interface are defined as: minimum design, simplicity, accessibility, consistency, feedback, forgiveness and user driven. These concepts was the baseline for “good design” for the study, and served as the starting point for the design of the prototypes used in the demos. From there, features that distinguish good design or usability were manipulated by subtracting either “good design”-features or “good usability”-features to achieve an interface that fulfils the purpose of each prototype.
3.2.1 Minimum design, simplicity, and 80/20
The design should have a low signal-to-noise ratio to deliver the message being sent to the user as clearly as possible and without distractions from surrounding elements and focus on the main task. Aesthetic color- and layout choices should be considered (Lal, 2013). An overabundance of
needless information and surrounding elements that might obscure the important details of a product page might become irritating if users can not find what they are looking for or finish their purchase. Another aspect to consider is the 80/20 rule, which asserts that 80 percent of effects generated by a large system are caused by 20 percent of the system’s variables. (Lindwell et al,
2010). It is commonly applied in graphical user interfaces to conceal functions or links in menus to reduce complexity and make it easier for users to navigate, for instance, popular or desired
categories and subcategories without having to look or go through everything else.
3.2.2 Consistency
The design should use similar layouts and terminology within an application, employ familiar interaction and navigation, and keep a consistent user interface (Lal, 2013). The layout of different category pages should be consistent to let users understand that they are on a similar level (looking at its information architecture) and differentiate from the homepage and product pages, but always let users know how to navigate the site by keeping global navigations intact.
3.2.3 Feedback
The design should provide immediate feedback to an action, and updates users with current status for background actions (Lal, 2013). A typical example of this could be animations or messages that displays that you have successfully added an item to your shopping cart.
3.2.4 Forgiveness
The design should allow for error prevention, allow users to undo an action, and limit user error by enabling required commands (Lal, 2013). Check-out processes are an example of where errors should not be allowed to occur, and that no order should be completed with faulty information. If an error does occur anywhere on the site, it should not have any serious consequences and be easily reversible.
3.3 Usability
Usability has been defined in different ways, and this study focused on the aspects of these definitions that are most relevant to the purpose. To clearly define and measure usability in this case, this study follows the instructions provided in the ISO 9241-11:1998 documentation. In it, usability is defined as “the extent to which a product can be used by specified users to achieve specified goals with effectiveness, efficiency and satisfaction in a specified context of use” (ISO 9241-11, 1998), with a revised version being published by Nigel Bevan et al. in 2018. This documentation specifies ways to define and measure usability depending on the goals, components, context, and other aspects of the situation that is being evaluated. “Usability Engineering” by Jakob Nielsen has been referenced in some previously mentioned papers, and he provides his own definition and key aspects on the topic (some merging with those of ISO 9241-11:1998).
3.3.1 Effectiveness
The system should provide appropriate information in order to complete a desired task, display it in a way that avoids errors and minimizes the risk of any unacceptable consequences that could arise from lack of accuracy and completeness (Bevan et al., 2018). When reviewing a product for purchase, any information or data relevant to the product (“Does this computer meet my
demands?”) or purchase (“Do they have it in stock?”) should be available to the user for them to quickly determine if they want and/or can get the product they are looking at.
3.3.2 Efficiency
The system should be efficient to use, so that once users have learned it, a high level of productivity is possible (Nielsen, 1993). Efficiency itself is defined as what resources (time, human effort, costs and material resources) that are expended when achieving a specific goal (the time to complete a specific task)(Bevan et al., 2018). With continuous interactions and purchases made from an e-commerce site, users should be able to complete purchases, check order status, or other tasks without spending more time than necessary on the site.
3.3.3 Learnability
The system should be easy to learn so that users can quickly and effectively achieve their goals. The first experience most people have with a website is that of learning to use it (Nielsen, 1993). Many e-commerce sites follow a very similar base structure, so when visiting a site for the first time you should have no problem in learning how to search for products, sign up, or just browse categories.
3.3.4 Errors
The system should have a low error rate, so that users make few errors during the use of it, and so that users can recover from them. Catastrophic errors must not occur (Nielsen, 1993). Similar to the points made in chapter 3.2.4 regarding forgiveness.
3.3.5 Memorability
The system should be easy to remember, so that casual users are able to return after some period of not using it, without having to learn everything all over again (Nielsen, 1993). When visiting an e-commerce site less frequently, users should still know where to go when looking for certain products or information that they have looked up previously.
3.4 Source Credibility theory
The theory of source credibility implies that the receiver of a message or information are more likely to regard this information as credible if the sender (source) of the information is credible itself. In “Source credibility: A Philosophical Analysis” (2012) by Bonachristus Umeogu, credibility is “all about the tendency to believe or trust someone with little or no doubt of being deceived or manipulated”. In “Social Influence, Sociology of” (2015) by Robert H Gass, the concept of source credibility is further described by deconstructing it into three primary dimensions: competence, trustworthiness and goodwill. The absence or presence of these three dimensions will affect the perceived credibility of a source.
4. Empirical data
To start, the data from the 70 survey participants were put together in a spreadsheet. From there, pieces of data were extracted to construct more detailed tables about specific parts of the research.
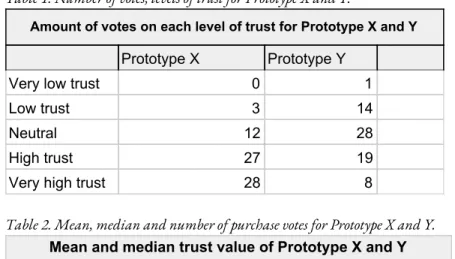
In our data, Prototype X represents high visual appeal but flawed usability, while Prototype Y represents high usability but flawed visual appeal. Table 1 shows the number of votes for each rating of trust regarding Prototype X and Y; these levels are the choices the participants had to choose between when rating their trust on a five-point scale. In Table 2, the mean and median trust score for each prototype is shown. Additionally, it shows how many people chose each prototype in their final purchase decision. In total, 63 out of 70 people chose one of the prototypes in this final decision, while the remaining three people chose neither.
Table 1. Number of votes, levels of trust for Prototype X and Y.
Amount of votes on each level of trust for Prototype X and Y
Prototype X Prototype Y
Very low trust 0 1
Low trust 3 14
Neutral 12 28
High trust 27 19
Very high trust 28 8
Table 2. Mean, median and number of purchase votes for Prototype X and Y.
Mean and median trust value of Prototype X and Y
Prototype X Prototype Y Mean/average 4,142857143 3,271428571 Median 4 3 Purchase votes 47 20
5. Analysis
5.1 Comparing the prototypes
When compiling the data for Prototype X, it was found that the top two ratings, high trust and
very high trust received the most amount of votes; 28 votes for very high trust and 27 votes for high trust. As visualised in Table 1, 12 people voted neutral, three people felt low trust, and none of the
participants felt very low trust for Prototype X. For Prototype Y, the neutral rating accumulated the most votes (28 votes), followed by high trust as the second most popular rating with 19 votes. The third most popular rating was low trust, receiving 14 votes. The very high trust rating landed on the second last place with eight votes, making very low trust the least popular rating with 1 vote.
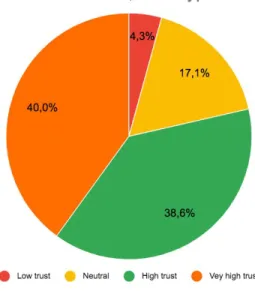
To further grasp the pattern in the data, it was visualized through a pie chart (figure 2). This figure provides an overview of the percentage of participants that voted for each rating. As seen in figure 2, very high trust received 40% of the votes, and high trust received 38.6% of the votes. The two highest ratings combined make up for 78.6% of the total, while the two lowest votes (with the lowest rating receiving no votes) and the neutral vote combined only made up for 21.4% of the total.
Figure 2. Percentage of votes, levels of trust for Prototype X.
A pie chart was made for Prototype Y as well, showing the percentage of people who voted for each rating (Figure 3). Here, the most popular rating, neutral, makes up for 40% of the total votes, and the second most popular rating, high trust, makes up for 27.1% of the votes. Combined, they represent 67.1% of the total votes. Very low trust, low trust, and very high trust are the three least popular ratings, receiving 20%, 11.4% and 1.4% of the votes respectively.
Figure 3. Percentage of votes, levels of trust for Prototype Y.
5.2 RQ1: Does high visual appeal generate a stronger sense of trust than high usability when shopping online for consumer electronics?
The first research question seeks to find a potential relationship between either high visual appeal and trust or high usability and trust. To answer this question, the average level of trust for each prototype was calculated and compared in Table 2. This table shows the mean value of trust for Prototype X and Y, where 1 is very low trust, 2 is low trust, 3 is neutral, 4 is high trust and 5 is very
high trust. In Table 2, the mean, median and purchase votes all have a higher value for Prototype X
than Prototype Y. This hints about a correlation between high visual appeal and level of trust, since Prototype X is the prototype with more focus on visual appeal.
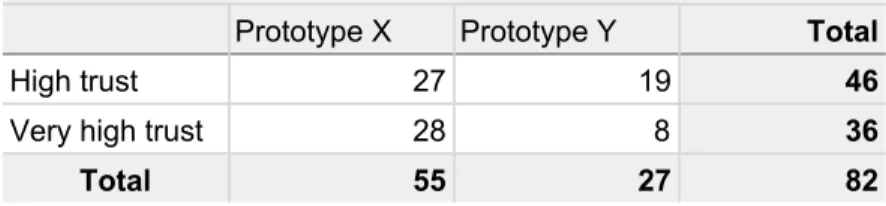
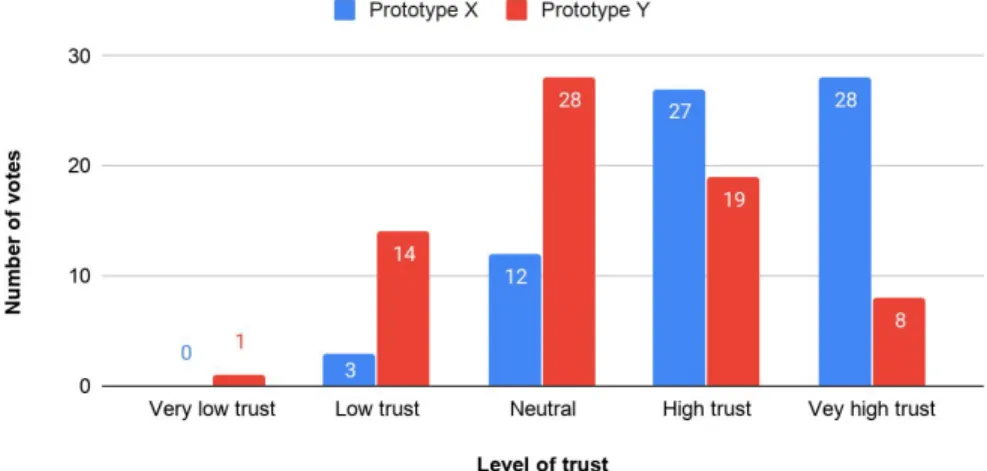
Additionally, since high visual appeal and usability were compared to the trust, the number of votes on the two highest ratings high trust and very high trust were compared between the prototypes by placing these votes in a cross tabulation (Table 3). From the cross tabulation, it is made clear that Prototype X gained more trust from the participants than Prototype Y. With 55 against 27 votes, Prototype X is rated as the most trustable with a difference of 28 votes.
Table 3. Number of votes on “high trust” or “very high trust” for Prototype X and Y.
Amount of votes on high or very high trust for Prototype X and Y
Prototype X Prototype Y Total
High trust 27 19 46
Very high trust 28 8 36
Total 55 27 82
The total amount of votes for the two highest ratings in both prototypes were 82 votes, with 36 of these votes being on very high trust. Out of the 36 votes on very high trust, 28 of them were for Prototype X while only eight of them were for Prototype Y. Out of 46 total votes for high trust in both prototypes, 27 of them were for Prototype X and 19 of them were for Prototype Y. Again, Prototype X receives the biggest part of the votes.
To visualize this comparison, the data was placed in a bar chart. As seen in Figure 4, the blue bars, representing Prototype X, is substantially taller for the two highest ratings of trust than other ratings.
5.3 RQ2: Does high trust for a company affect purchase intention?
The second research question seeks to uncover any relation between trust felt towards a website and the purchase intention. In Figure 5, a comparison of between the different purchase choice groups are made. A purchase choice group (PCG) is a group of participants who chose the same prototype for their final purchase decision. In this figure, the numbers on the y-axis correspond to the five different ratings of trust. Making the ratings numerical enables the possibility of calculating a mean value for levels of trust, which consequently makes it possible to compare the average trust for the prototypes.
Figure 5. Mean level of trust for Prototype X and Y, between different purchase choice groups. On the y-axis, 1 is “very low trust”, 2 is “low trust”, 3 is “neutral”, 4 is “high trust” and 5 is “very high trust”.
For each group, the mean trust rating for both prototypes is represented by two adjacent bars. The first PCG (PCG-1) in the figure represents all participants who were uncertain about where to commit to a purchase, thus choosing the “I don’t know option”. This group had an average trust rating of 4 for Prototype X, and 3.67 for Prototype Y. The second group (PCG-2) represents all participants who chose Prototype X for their final purchase
commitment. They had an average trust rating of 4.51 for Prototype X and 2.91 for Prototype Y. The third group (PCG-3), who chose Prototype Y as their final purchase commitment, has an average trust rating of 3.3 for Prototype X and 4.05 for Prototype Y.
For PCG-2 and PCG-3, the mean level of trust was higher for their respective native
prototypes . However, the native prototype for PCG-2 received a higher average trust rating 1
than the native prototype for PCG-3 with 4.51 against 4.05. Also, PCG-1 rated their trust higher for Prototype X, even though this prototype was not their final purchase decision.
6. Discussion and conclusions
6.1 Findings
To answer the first research question: the results from this study imply that high visual appeal does in fact generate a stronger sense of trust than high usability when shopping online for consumer electronics. Prototype X, with high visual appeal, scored substantially higher when its trust was assessed. Also, regardless of which prototype the participant chose to buy from, the trust was higher for the prototype they did choose, which further confirms this correlation. To answer the second research question: it seems that trust does in fact affect the purchase intention, since the native prototype scored highest in trust in all PCG:s.
Some comments from the last part of the survey expressed the reflections which lead up to their final decision. Multiple people mentioned that they found Prototype X better looking, and some of these implied that the quality of the visual appeal made them feel more secure in choosing that Prototype for their purchase decision. Also, one person commented that Prototype X “definitely felt more serious” because it, in comparison to Prototype Y, had a more “polished look”. Thus, it seems that the applied graphic design theory was successful in producing a prototype that is perceived as good looking.
In the early stages of compiling the data, it was found that people less frequently voted for the “very high trust”-rating compared to the more neutral rating “high trust” in the case of both prototypes. This pattern can potentially be a result of low source credibility, since the prototypes do not represent an established company. Therefore, it is hard to assign any credibility
characteristics to the source which could lead to a more neutral assessment of it. One could speculate that if the study had featured two manipulated versions of an existing company’s website, that is established in the consumer electronics market, the votes for the “very high
trust”-rating might have been more popular. However, this pattern could also be a result of the participants acting with caution, since a more “extreme” rating is a bigger overtaking than a more neutral and “safe” choice.
The results of Lindgaard et al. (2011), which proves that visual appeal affects the general
perception of a website’s quality, are reflected in this study as well. Our data suggests that the visual appeal (even when lacking usability) of a site does dictate the overall judgement of it, and does so substantially more than usability (when lacking visual appeal). Thus, the power visual appeal has over the success of a website might be stronger than previously anticipated.
6.2 Method
The study consisted of a survey shared among students on social media platforms and through email, including recordings of prototypes that users had no control over rather than fully
functional prototypes that would allow for in-dept user interactions. From the start, this was the intended idea, but due to time constraints and limited resources it would not be possible to get the amount of data required for a representative quantitative study. Creating prototypes from scratch ensured that there were two objects for the test participants to observe that were similar enough to be compared without bias to already existing sites. It was also easier to ensure certain aspects (similar information architecture, colour schemes, logotypes, etc.) and level of quality across both prototypes, meaning an overall control of contents.
The survey didn’t include any required questions for participants to go into greater details about their perceptions of the prototypes or e-commerce sites in general, something that was not considered necessary in finding answers to the research questions or to the nature of the quantitative study. On that matter, a mixed methods approach to the study could have been considered for gaining additional data and opinions to improve on the initial results: to help understanding why some people rated one prototype higher than the other and to see how certain aspects affected their ratings. This might have been difficult to properly execute on the same amount of participants in the given and to then process all of those answers, but definitely worth considering should another similar study be conducted. It would, again, be relevant to ask how many participants would be necessary to get representative data.
The prototypes were created in Adobe XD, a user experience design tool, that allowed for time-saving creations. This method was chosen instead of coding or programming test websites, which would take considerably more time and beta-testing of the prototypes to ensure that no errors would break the fabricated reality of the test. Given more time and potential assistance in programming a functioning website, this could have increased the way the prototypes were perceived and allowed for direct user interactions and exploration of the websites. This could also be a useful way to implement more apparent flaws in usability or design that might have an impact on trustworthiness, that participants will not detect from watching the demos.
6.3 Implications
With the correlation between trust and purchase intention being apparent, the design of an e-commerce website for consumer electronics should focus mainly on the visual appeal. The usability seems to have some value, since Prototype Y still received some votes for the higher trust ratings. However, it does not seem to be of the same importance as the visual appeal of the site in regards to generating trust, and consequently customers.
6.4 Future improvements
In the final section of the survey the participant was allowed to enter a comment about the survey overall. There, some people discussed their reasons for their purchase decision. Some of these comments expressed the importance of visual design, as expected, while some were driven by other factors in their decision. One person made their final purchase decision based on the payment options in the checkout, which is a factor that was not planned to affect the purchase decision. Another person stated that they usually made their decision on whether to trust a site or not based on its apparent security such as seeing that a site uses the ‘https’ prefix, something that was not visible (or included) in the prototype demonstrations.
Unforeseen factors like these, that affect the participant’s judgement and choice for purchase but that were not planned, could have been countered by setting up the user testing in a controlled environment.
6.5 Conclusions and recommendations
When forming trust for an e-commerce website, the visual appeal of it will be of most importance to the users. Out of the 70 participants in this study, a clear majority of them felt higher trust for the prototype with more focus on its visual appeal. Also, this prototype received the most votes as the website participants would rather purchase something from. The usability should not be neglected, but can be seen as secondary in comparison to the look of the site.
6.5.1 Further research
This study has the potential to be done physically, with participants using the prototypes
themselves instead of watching a recording of it being used. To allow participants to interact freely, towards a given goal, could potentially make it easier for them to distinguish their feelings and opinions towards the hypothetical website. Also, user tests like this can be monitored by the researchers to note observed behaviours, how long a task takes to complete, the number of clicks to reach the end of the user journey, etc. Additionally, placing participants in a physical environment makes it possible to control factors that, if not controlled, could affect the assessment of the user.
A similar study could be conducted with participants with other demographic characteristics, and for other shopping categories. It would be interesting to see if the results from this study can be found within other categories and with different people.
References
Ben-Bassat, T., Meyer, J. and Tractinsky, N. (2006). Economic and subjective measures of the perceived value of aesthetics and usability. ACM Transactions on Computer-Human Interaction, Vol. 13.
Bevan N., Carter J., Harker S. (2015) ISO 9241-11 Revised: What Have We Learnt About
Usability Since 1998?. In: Kurosu M. (eds) Human-Computer Interaction: Design and Evaluation.
HCI 2015. Lecture Notes in Computer Science, vol 9169. Springer, Cham
Creswell, J. (2013). Research design: qualitative, quantitative, and mixed methods approaches.
SAGE publications. 4th ed.
eMarketer. (June 27, 2019). Retail e-commerce sales worldwide from 2014 to 2023 (in billion U.S. dollars). Statista. Retrieved January 22, 2020, from
https://www.statista.com/statistics/379046/worldwide-retail-e-commerce-sales/
Gass, R.H. (2015). Social Influence, Sociology Of. International Encyclopedia of the Social &
Behavioral Sciences, Vol.22.
Lal, R. (2013). Digital Design Essentials: 100 ways to design better desktop, web, and mobile interfaces. Rockport Publishers.
Lidwell, W., Holden, K., & Butler, J. (2010). Universal principles of design : 125 ways to enhance usability, influence perception, increase appeal, make better design decisions, and teach through design (Rev. and updated ed.). Gloucester, Mass: Rockport, pp.14-15.
Lindgaard, G., Dudek, C., Sen, D., Sumegi, L., and Noonan, P. (2011). An exploration of relations between visual appeal, trustworthiness and perceived usability of homepages. ACM Transactions
on Computer-Human Interactions, Vol. 18, pp.1-30.
PostNord. (February 18, 2019). Share of online shoppers who purchased products at least once a month in Sweden in 2018, by age. Statista. Retrieved February 05, 2020, from
https://www.statista.com/statistics/999135/online-shoppers-who-purchased-products-at-least-on
ce-a-month-in-sweden-2018-by-age/
Robins, D. and Holmes, J. (2008). Aesthetics and credibility in web site design. Information
Processing & Management, Vol. 44, pp.386-399.
Statista. (April 3, 2018). Which of these items have you bought online in the past 12 months? [Graph]. Statista. Retrieved January 27, 2020, from
https://www.statista.com/forecasts/826596/online-purchase-by-category-in-sweden
Tseng, K. and Tseng, Y. (2014). The Correlation between Visual Complexity and User Trust in On-line Shopping: Implications for Design. Human-Computer Interaction. Applications and
Services, Vol. 8512, pp.90-99.
Tuch, A., Roth, S., Hornbæk, K., Opwis, K. and Bargas-Avila, J. (2012). Is beautiful really usable? Toward understanding the relation between usability, aesthetics, and affect in HCI. Computers in
Human Behavior, Vol. 28, pp.1596-1607.
Umeogu, B. (2012). Source Credibility: A Philosophical Analysis. Open Journal of Philosophy, Vol.2, No.2, pp.112-115.
Wong, W., Bartels, M. and Chrobot, N. (2014). E-commerce Websites. Eye Tracking in User Experience Design, pp.187-216.
Appendices
Appendix 1. Survey page 1. Appendix 2. Survey page 2.
Appendix 3. Survey page 3. Appendix 4. Survey page 4.
Appendix 6. Prototype X, home page. Appendix 7. Prototype X, Category page.
Appendix 8. Prototype X, sub-category page.
Appendix 9. Prototype X, product page.
Appendix 10. Prototype X, shipping page. Appendix 11. Prototype X, payment page.
Appendix 12. Prototype X, Confirmation page.
Appendix 15. Prototype Y, checkout page Appendix 16. Prototype Y, homepage