http://www.diva-portal.org
Postprint
This is the accepted version of a paper presented at 17th EBES Conference - Venice.
Citation for the original published paper:
Le Duc, M. (2014)
Implementation of Geographic Information and Geographic Information Systems in municipal Emergency Management – an Innovation adoption perspective.
In: Proceedings of the 17th EBES Conference - Venice Istanbul
N.B. When citing this work, cite the original published paper.
Permanent link to this version:
Implementation of Geographic Information and Geographic Information Systems in municipal Emergency Management – an Innovation adoption perspective Michaël Le Duc, School of Business, Society and Technology, Mälardalen University, Box 883, 721 23 Västerås, Sweden, tel/cell +46 21 10 14 02, michael.le.duc@mdh.se
Abstract
The project reported concerns Emergency Management (EM) for local
government especially support from Geographic Information (GI) and Geographic Information Systems (GIS). The questions investigated were: How can
municipalities implement the use of Geographic Information and Geographic Information Systems for Emergency Management effectively? How can risk analysis be implemented with a special focus on support from GI and GIS? The purpose of the project was to, based on prior knowledge, develop and, to some extent, validate in a scientific study principles for implementing GI and GIS for EM in municipalities. The theoretical framework used is mainly based on the concepts of adoption of innovations. Innovation adoption is seen as a process composed of several phases. In addition, potential adopters use a set of criteria to evaluate an innovation. Regarding software and information systems, different professionals in a municipality can adopt different modules. The author performed interviews in 2007, as part of a case study over a longer period of time, with two groups of respondents, namely municipal GIS Coordinators and Emergency Preparedness Officers. Some professionals responded by e-mail. Approximately twenty-five respondents from seventeen municipalities participated. Fourteen respondents were Emergency Preparedness Officers. Two metropolitan local governments, nine large cities and other municipalities all across Sweden contributed with information.
The author asked Emergency Preparedness Officers to rate their municipality’s GIS maturity, which was perceived as decent. On the other hand, GIS is in limited use for risk and vulnerability analysis in many of the studied local governments. It was interesting to note that no respondent answered that GIS was not compatible with risk and vulnerability analysis but several were uncertain. Seven
professionals consider GI and GIS compatible with risk and vulnerability analysis, thus indicating that with time GIS adoption has the potential to increase for risk and vulnerability analysis. Five respondents do not know how compatible GI and GIS are with risk and vulnerability analysis. The persons in this group have rated GIS use for risk and vulnerability analysis as low, which is consistent with prior research.
The interviews have been complemented with other material, notably the IT infrastructure (web based software) has improved greatly, Excel is used by many security officers. Also the EU and Sweden provide data at low cost for
municipalities on a subscription basis.
Keywords: Implementation, innovation adoption, municipalities, emergency
Introduction
Emergency Management (EM) for local government could benefit from support of Geographic Information (GI) and Geographic Information Systems (GIS; Goodchild, 2006; Manfre et al. 2012).
The main research questions are, from an innovation adoption perspective: (1) How can the use of GI and GIS for EM be adopted for municipalities? (2) How can GI and GIS be used in risk analysis ?
An earlier version of this paper was published in 2007 (Zeug and Pesaresi, 2007). Åke Sivertun participated to some extent in the collection of information by e-mail.
Theoretical framework
Emergency Management in local and regional government is a complex
phenomenon if you consider the EM cycle (preparedness, response, recovery, and mitigation). Stallings (2002) denotes the aforementioned phases of the EM cycle as “activity clusters” or “patterns of behavior”, which is fruitful to portray their complex nature. The combination of GI, GIS and EM could thus be even more challenging,
A suitable theoretical framework is the diffusion and adoption of innovations tradition (Yun et al. 2011).
Adoption of innovations
According to Rogers (1995, p. 11) “an innovation is an idea, practice, or object that is perceived as new by an individual or other unit of adoption”. Rogers (1995, p. 10-11) defines innovation diffusion as a process among the members of a social system where innovation is communicated through channels over time. The diffusion process over time for a successful innovation typically forms an S-shaped curve (Foster, 1986). When an innovation is no longer useful it is usually replaced by a better alternative, however not always in a complete manner. Adoption is a key concept in the innovation literature. Rogers (1995) also terms it the innovation-decision process. Rogers (1995) conceptualizes five steps in the adoption process: (1) knowledge, (2) persuasion, (3) decision, (4) implementation, and (5) confirmation.
Rogers (1995) has identified five pivotal characteristics that determine the
adoption of an innovation. (1) relative advantage (2) compatibility (3) complexity (4) trialability and (5) observability.
In the area of software and information systems, innovation adoption processes have been analyzed extensively, e.g., Cooper and Zmud (1990), Wildemuth (1992), Lai and Mahapatra (1997), Chengalur-Smith and Duchessi (1999), Jasperson (2005) as well as Barnett and Siegel (1988).
An interesting aspect of software is that different modules in the same package can be used to various extents by separate groups in the social system. That differentiates software from physical products like cars or a washing machines. Every car driver needs a petrol tank. Every word processor user does not use the software to check synonyms. Jurison (1993) writes about an empirical research project on office information systems. Software adoption fluctuates over time. There are also variations depending on the type of profession involved (project engineers, managers, professionals and secretaries). E-mail was revealed to be highly adopted over time (3 years), in the whole population. In contrast, project management software had a low and decreasing average adoption level. Adoption of project management software was restricted to project engineers. Project engineers have challenging tasks to perform that are supported by advanced software. Complex software is thus compatible with that component of the social system.
Research that employs an innovation perspective in GI and GIS implementation includes Budic and Godshalk (1994), Chan and Williamson (1999a), Nedovic-Budic (1997), Nedovic-Nedovic-Budic (1998), Cavric et al. (2004), Nedovic-Nedovic-Budic and Godschalk (1996), and Chan and Williamson (1999b).
Methodology
The case study method is employed, with a time perspective as well as using multiple sources of evidence. The case study approach is relevant to create new knowledge.
Included in the case study are qualitative interviews, the main part in this article, that is related to other material, notably from meetings.
Semi-structured telephone interviews were performed in 2007 with government officials in municipalities combined with answers received by e-mail. The aim with a qualitative method such as semi-structured telephone interviews is to generate rich information. The process can influence theoretical framework used.
Sampling of respondents, questionnaire and presentation of results
A qualitative sampling strategy was used. Different principles were combined, including to sample by size of town, variation (risks for flooding, heavy sea traffic with oil tankers, proximity to nuclear plant, etc.) and opportunity, e.g., some potential respondents were difficult to reach. The author performed interviews or obtained information by e-mail with two groups of respondents (1) Municipal GIS coordinators, or professionals with the equivalent function (questionnaire with 27 questions) and (2) Emergency Preparedness Officers, or professionals with the equivalent function (questionnaire with 19 questions). Mostly data from group
(2) are reported and analyzed in this paper.
The author chooses to present the results without the names of the municipalities and individuals so people could speak openly as well as for security reasons. The following tables comprises information about the respondents.
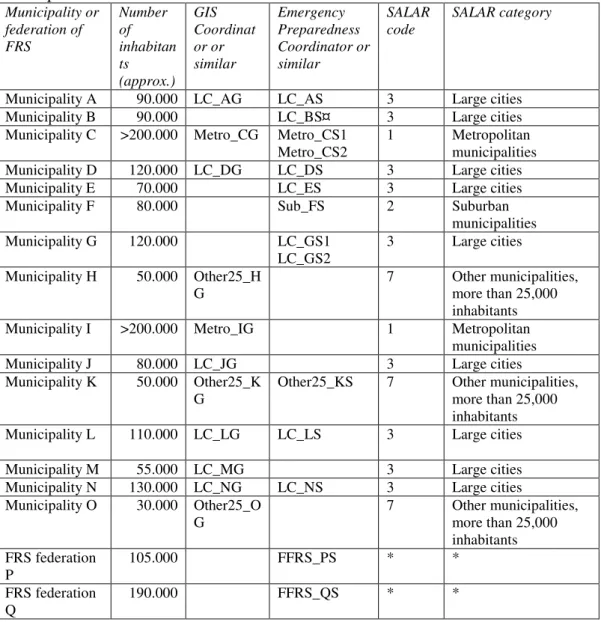
Table 1. Municipalities, Federations of Fire and Rescue Services (*) and respondent codes. ¤: two persons answered.
Municipality or federation of FRS Number of inhabitan ts (approx.) GIS Coordinat or or similar Emergency Preparedness Coordinator or similar SALAR code SALAR category
Municipality A 90.000 LC_AG LC_AS 3 Large cities Municipality B 90.000 LC_BS¤ 3 Large cities Municipality C >200.000 Metro_CG Metro_CS1
Metro_CS2 1 Metropolitan municipalities Municipality D 120.000 LC_DG LC_DS 3 Large cities Municipality E 70.000 LC_ES 3 Large cities Municipality F 80.000 Sub_FS 2 Suburban
municipalities Municipality G 120.000 LC_GS1
LC_GS2
3 Large cities Municipality H 50.000 Other25_H
G 7 Other municipalities, more than 25,000 inhabitants
Municipality I >200.000 Metro_IG 1 Metropolitan municipalities Municipality J 80.000 LC_JG 3 Large cities Municipality K 50.000 Other25_K
G
Other25_KS 7 Other municipalities, more than 25,000 inhabitants Municipality L 110.000 LC_LG LC_LS 3 Large cities Municipality M 55.000 LC_MG 3 Large cities Municipality N 130.000 LC_NG LC_NS 3 Large cities Municipality O 30.000 Other25_O
G 7 Other municipalities, more than 25,000 inhabitants FRS federation P 105.000 FFRS_PS * * FRS federation Q 190.000 FFRS_QS * *
In the final column, the code for municipality type is noted according to the classification of The Swedish Association of Local Authorities and Regions (SALAR). The SALAR classification of municipalities, as of January 1, 2005, (Bengtsson, 2004) divides the municipalities into nine categories on the basis of structural parameters such as population, commuting patterns and economic structure. The author presents only the used classes’ definitions.
The categories of municipalities are: (1) Metropolitan municipalities (3
municipalities), i.e., municipalities with a population of over 200,000 inhabitants; (2) Suburban municipalities (38 municipalities), i.e., municipalities where more than 50 per cent of the nocturnal population commute to work in another area. The commonest commuting destination is one of the metropolitan municipalities; (3) Large cities (27 municipalities), i.e., municipalities with 50,000-200,000 inhabitants and more than 70 per cent of urban area; (4) Commuter municipalities (41 municipalities); (5) Sparsely populated municipalities (39 municipalities); (6) Manufacturing municipalities (40 municipalities); (7) Other municipalities, more than 25,000 inhabitants (34 municipalities), i.e., municipalities that do not belong to any of the previous categories and have a population of more than 25,000; (8)
Other municipalities, 12,500-25,000 inhabitants (37 municipalities); (9) Other municipalities, less than 12,500 inhabitants (31 municipalities).
The respondent code is constructed as follows. The first part of the code indicates the type of municipality (LC = Large city; Metro = Metropolitan municipality, etc.). The last letter is used to indicate if the person is working with EM (S) or GIS (G). In the middle is the town code from A to Q in alphabetical order. FFRS represents Federation of Fire and Rescue Services.
Critique of method
One weakness in the data collection procedure is that the author could not obtain information from both GIS coordinators and Emergency Preparedness
Coordinators in some municipalities. In addition, some professionals responded by e-mail. Furthermore, a larger sample would have yielded higher validity. The author also limited the number of questions in the questionnaires to avoid putting too high demands on the respondents. A mail survey using appropriate statistical sampling would have yielded more statistically precise and valid data.
Results with updates for 2015
The bulk of the article’s data builds on telephone interviews. Some respondents work in a fire and rescue services federation, thus representing several
municipalities. In addition, some questions were not answered or asked.
To keep track of the specific statements and items the table in the method chapter is used to link the data the author uses internally. Furthermore, these codes will enable the reader to see patterns more clearly in the presentation.
Interviews with municipal Emergency Preparedness Officers and similar occupations
Approx. 14 government administrators in EM were interviewed or responded through e-mail (six). Most had worked many years in the area (more than 10 years). In two municipalities, two persons responded.
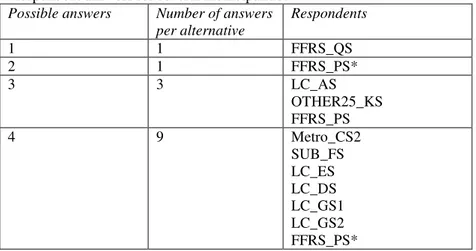
The author asked to what extent GIS is used in the municipality. See table 2 for answers and comments below the table.
Table 2. Stated extent of GIS use in general. 1= small extent, 5 = large extent *: respondent answers for several municipalities
Possible answers Number of answers per alternative Respondents 1 1 FFRS_QS 2 1 FFRS_PS* 3 3 LC_AS OTHER25_KS FFRS_PS 4 9 Metro_CS2 SUB_FS LC_ES LC_DS LC_GS1 LC_GS2 FFRS_PS*
FFRS_PS* LC_NS 5 3 LC_BS LC_LS Metro_CS1
Comments included that the extent of GIS use varies between different municipal departments (LC_ES). In addition, GIS is implemented in many other applications (SUB_FS). The technical departments use GIS extensively, while the “soft” departments lag behind said a person who also has worked as a GIS coordinator for three years (OTHER25_KS).
The author also asked to what extent GIS is used for risk and vulnerability analysis. See table 3 for answers and comments below the table.
Table 3. Stated extent of GIS use for risk and vulnerability analysis. 1= small extent, 5 = large extent
*: respondent answers for several municipalities
Possible answers Number of answers per alternative Answers 1 5 OTHER25_KS LC_DS LC_GS1 FFRS_QS SUB_FS 2 5 LC_BS Metro_CS2 FFRS_PS* FFRS_PS* FFRS_PS* 3 4 LC_ES LC_LS LC_GS2 Metro_CS1 4 - 5 1 FFRS_PS* Don’t know 1 LC_NS
Thus adoption in this area is low.
One noteworthy respondent answered that “We do not use GIS at all. The system Geosecma is not suitable for those purposes… GIS is like a heavy truck without wheels” (OTHER25_KS).
Regarding which geographic information is used in risk and vulnerability analysis the author obtained diverse answers. On a general level, base maps, risks,
transportation, Fire and Rescue Services, hydrology, and population were
mentioned. One municipality is more advanced (Metro_CS2) using a 3D primary map with pipes and wires, property information, etc.
One reason that GI is abandoned is if the information is not updated (LC_BS). The lack of money and resources are obstacles (FFRS_PS).
Usability problems were mentioned, including that if you seldom use the system that can create problems (LC_ES); technical skills are required to find information (LC_AS); the personnel want help continuously by GIS expertise (FFRS_PS); it is
difficult to assess the quality of the information. “With GIS you can get anything” (LC_LS). In one case, the system was difficult to use so the project was cancelled (LC_ES).
The author asked to what extent geographic information and GIS are compatible with how the municipalities work with risk and vulnerability analysis. Indicators are presented in table 4 below.
Table 4. Extent of compatibility between GI and GIS and risk and vulnerability analysis. 1= small extent, 5 = large extent
Possible answers Number of answers per alternative Respondents 1 - - 2 - - 3 1 LC_LS 4 5 LC_DS LC_GS2 Metro_CS2 LC_ES Metro_CS1 5 1 FFRS_QS
Don’t know 5 SUB_FS
OTHER25_KS LC_NS LC_GS1 LC_BS
The author also asked if the respondents have experienced problems with the complexity of geographic information and GIS in relation to the users. Five respondents answered “yes” (LC_AS, Metro_CS2, OTHER25_KS, LC_GS2, LC_ES), six responded “no” (LC_NS, LC_LS, LC_DS, SUB_FS, FFRS_QS, Metro_CS1) while a few did not know (LC_GS1, LC_BS). Furthermore, “as I have said earlier, if you don’t use GIS so often, you can experience the problems mentioned” (LC_ES).
One very clear pattern is that the professionals considered vendors to have a very limited influence on their decisions.
The author further asked through which information channels the professionals learn of other people’s experience concerning risk and vulnerability analysis, geographic information and GIS. To reduce space requirements for this paper the author skips the specific respondent information. Newspapers (2), professional press (7), magazines for members (-), company information (2), associations (3), fairs (4), seminars (7), informal contacts (9), education and training (4), internal information (1) and other channels (-) were selected.
2015 updates
Updates that are recent include the following. Still in 2015 several systems used in Sweden for risk and vulnerability analysis lack the details of a GIS. They are strategic tools. IBERO builds on Excel1. There is a new national system for
1
collecting data that does not include complex parts like GIS2. In the operational
part of Emergency management, GI and GIS are heavily used3.
Government agencies at national and international levels have developed infrastructures for disaster management, where municipalities in isolation have not sufficient resources and legal power. In Sweden there is the INSPIRE
directive implemented, stemming from the EU. Municipalities pay data providers a low annual fee to obtain access to large amounts of data. In 2011 121 out of 290 municipalities participated, when the author went to a seminar. In 2015 over 200 municipalities participate4.
Analysis
Rich and complex information was obtained on the great variety of experiences and situations in the investigated municipalities and Federations of Fire and Rescue Services.
The aim of a qualitative method is to enable research to blend the unique and the general in the research area and generate new insights.
The innovation adoption perspective
GIS use varies in the different municipalities. However, the situation is decent (Table 2). On the other hand, GIS is used to a lesser extent for risk and
vulnerability analysis, with ten answers below 3 (Table 3).
Education, training and exercises in the investigated area were mentioned many times as needed. These support innovation adoption. In that context, incremental innovation might be the path to choose, e.g., to demonstrate simple tools and examples with GIS support.
A key dimension that can hinder adoption is if an innovation is not compatible with the potential adopters according to Rogers (1995). Table 4 contains two main groups. Seven professionals consider GI and GIS compatible with risk and
vulnerability analysis, thus indicating that with time GIS adoption has the potential to increase for risk and vulnerability analysis. Five respondents do not know how compatible GI and GIS are with risk and vulnerability analysis
(SUB_FS, OTHER25_KS, LC_NS, LC_GS1, LC_BS). The persons in this group have rated GIS use for risk and vulnerability analysis as low (LC_NS did not know), which is consistent with prior research. These professionals are probably early in what Rogers (2005) calls the knowledge phase of the adoption process without knowing if GIS is compatible with risk and vulnerability analysis. One interesting extreme in table 4 is the respondent from the Federation of Fire and Rescue Services Q rating compatibility of GI and GIS regarding risk analysis as 2 https://www.msb.se/sv/Utbildning--ovning/Konferenser-- seminarier/Konferensdokumentation/Arrangemang-2015/Dokumentation-fran-Konferens-om-risk--och-sarbarhetsanalyser-/ 3 https://www.msb.se/sv/Insats--beredskap/Ledning--samverkan/Teknik-som-stodjer-ledning-och-samverkan/ 4
https://www.geodata.se/sv/service/Nyhetsarkiv/2015/over-200-kommuner-ar-med-i-high as 5. In table 3, the respondent FFRS_QS states that GIS use for risk and vulnerability analysis is very low (1). The FFRS Q is eager to get started as soon as possible. However, “the municipalities stop that initiative”.
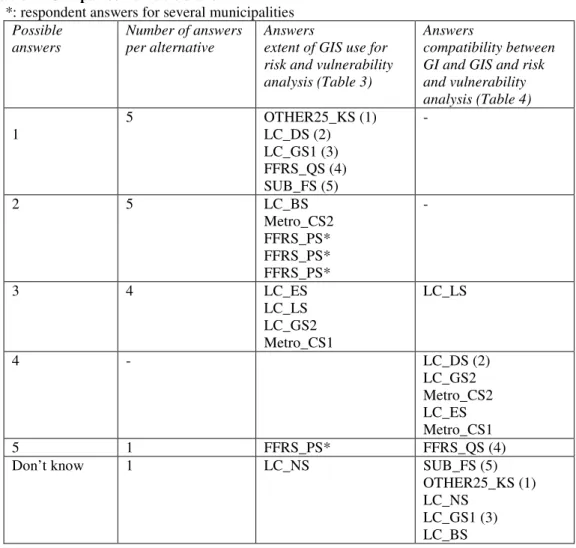
Table 5 highlight these patterns. Table 5. Comparison of table 3 and 4.
*: respondent answers for several municipalities
Possible answers
Number of answers per alternative
Answers
extent of GIS use for risk and vulnerability analysis (Table 3)
Answers
compatibility between GI and GIS and risk and vulnerability analysis (Table 4) 1 5 OTHER25_KS (1) LC_DS (2) LC_GS1 (3) FFRS_QS (4) SUB_FS (5) - 2 5 LC_BS Metro_CS2 FFRS_PS* FFRS_PS* FFRS_PS* - 3 4 LC_ES LC_LS LC_GS2 Metro_CS1 LC_LS 4 - LC_DS (2) LC_GS2 Metro_CS2 LC_ES Metro_CS1 5 1 FFRS_PS* FFRS_QS (4)
Don’t know 1 LC_NS SUB_FS (5)
OTHER25_KS (1) LC_NS
LC_GS1 (3) LC_BS
As noted by Jurison (1993) software adoption varies between users in the same organization. Different modules of a GIS can have different user groups. Tools based on Microsoft Excel and similar tools such as IBERO are used for risk and vulnerability analysis in the investigated municipalities. Simple innovations are more rapidly adopted than complex ones according to Rogers (1995). Incremental innovations are easier to adopt than radical innovations.
This analysis illustrates that a process perspective is relevant which includes a time dimension on the complex process of innovation adoption, including GI and GIS for risk and vulnerability analysis as well as other areas of emergency management.
Regarding more material related to the five pivotal characteristics that determine the adoption of an innovation by an individual or other decision-making unit, advantages and disadvantages with digital GI for risk and vulnerability analysis (relative advantage) are noted, with a slight dominance for negative statements.
The problems include different coordinate systems used in the same organization, and quite a number of usability problems. The statements of municipality K’s Emergency Preparedness Coordinator (Other25_KS) are extremely negative. They indicate clearly that there are problems of seeing the use for GI and GIS for risk and vulnerability analysis in some municipalities. Compatibility problems are noted. Complexity problems are also noted. “There is a lot to do in this area, to make systems user friendly, you have to improve that a lot” (LC_AS).
Trialability does not seem to be significant with some exceptions like LC_ES and Metro_CS1. Observability is also of limited relevance, although four respondents thought that other municipalities’ experience influenced their decision-making. Vendors had no influence whatsoever according to the respondents.
2015 updates
The updates from 2015 show that several systems for risk and vulnerability analysis in Sweden do not use sophisticated GIS technology. The tools are strategic. The users are managers not needing to learn complex tools like GIS. There are experts who work with complex systems.
The EU and Sweden have decided that government needs to provide data to municipalities and other agents easily and at low cost for Emergency
Management. The municipalities themselves cannot afford to buy all the needed data. Therefore, innovation adoption sometimes requires fundamental shifts decided by government.
Conclusions
Risk and vulnerability analysis supported by GI and GIS in the studied
municipalities is an area where innovation adoption seems to be much slower than general use of GIS and GIS in municipalities. One explanation could be that risk and vulnerability analysis is a strategic task, where you do not directly use too much detailed information. The detailed information is good to have access too if needed. GI and GIS and used to prepare information for risk and vulnerability analysis and also in operational parts of Emergency Management.
In 2007 one idea discussed extensively among the respondents and also in the project was that GI and GIS should diffuse in concert with other applications of GI and GIS in emergency management. Especially, that is the case with web services. In 2015 substantial progress has been accomplished by the EU Inspire directive and access to data from web portals. Also, Google maps and other map services are generally accessible with ever more sophistication and detail. Navigation systems are also available at low cost for car drivers, pedestrians and many more.
Project organization and acknowledgements
The project was funded by the Swedish Emergency Management Agency with management from the KRIS-GIS project at the Swedish Land Survey.
Reference list
Barnett, G.A., and Siegel, G. "The Diffusion of Computer-Assisted Legal Research Systems,"
Journal of the American Society for Information Science (39:4) 1988, pp 224-234.
Beath, C.M. "Supporting the information technology champion," MIS Quarterly (15:3) 1991, pp 355-372.
Bengtsson, H. "Classification of municipalities, January 1 2005," Svenska kommunförbundet, Stockholm, 2004.
Budic, Z.D., and Godshalk, D.R. "Implementation and Management Effectiveness in Adoption of GIS Technology in Local Governments," Comput., Environ. and Urban Systems (18:5) 1994, pp 285-304.
Campbell, H. "The Impact of Geographic Information Systems on British Local Government,"
Computers, Env. and Urban Systems (16) 1992, pp 531-541.
Cavric, B.I., Nedovic-Budic, Z., and Ikgopoleng, H.G. "Diffusion of GIS Technology in
Botswana: Process and Determinants," International Development Planning Review (25:2) 2003, pp 195-219.
Chan, T.O., and Williamson, I.P. "A Model of the Decision Process for GIS Adoption and Diffusion in a Government Environment," Journal of the Urban and Regional Information
Systems Association (11:2) 1999a, pp 7-16.
Chan, T.O., and Williamson, I.P. "The different identities of GIS and GIS diffusion," International
Journal of Geographical Information Science (13:267-281) 1999b.
Chengalur-Smith, I., and Duchessi, P. "The initiation and adoption of client-server technology in organizations," Information & Management (35) 1999, pp 77-88.
Cooper, R.B., and Zmud, R.W. "Information technology implementation research: A technological diffusion approach," Management Science (36:2) 1990, pp 123-139.
Foster, R.N. Innovation: The Attacker’s Advantage, Summit Books, New York 1986. Goodchild, M. F. "GIS and disasters: Planning for catastrophe." Computers Environment and
Urban Systems (30:3) 2006, pp 227-229.
Gummesson, E. Qualitative Methods in Management Research. Revised edition. Newbury Park: Sage Publications, 1991.
Jasperson, J. S., et al. "A comprehensive conceptualization of post-adoptive behaviors associated with information technology enabled work systems." Mis Quarterly (29:3) 2005, pp 525-557. Jurison, J. "Adoption of OIS by four groups of office workers: An analysis from the perspective of innovation diffusion theory," SIGCPR '93. Proceedings of the 1993 conference on Computer personnel research, 1993, pp. 178-187.
Lai, V.S., and Mahapatra, R.K. "Exploring the research in information technology implementation," Information & Management (32) 1997, pp 187-201.
Le Duc, M. "Elements of Innovation Management in Computer Software and Services," Ninth International Conference on Management of Technology (IAMOT 2000), Miami, Florida, USA, 2000.
Manfre, L. A., et al. "An Analysis of Geospatial Technologies for Risk and Natural Disaster Management." Isprs International Journal of Geo-Information (1:2) 2012, pp 166-185. Nedovic-Budic, Z. "The Likelihood of Becoming a GIS User," Journal of Urban and Regional
Information Systems Association (10:2) 1998.
Nedovic-Budic, Z. "GIS Technology and Organizational Context: Interaction and Adaptation," in:
Geographic Information Research: Bridging the Atlantic, M. Craglia and H. Couclelis (eds.),
Taylor & Francis, London, 1997, pp. 165-184.
Nedovic-Budic, Z., and Godschalk, D.R. "Human Factor in Adoption of Geographic Information Systems (GIS): A Local Government Case Study," Public Administration Review (56:6) 1996, pp 554-567.
Obermeyr, N.J. "Bureaucratic Factors in the Adoption of GIS by Public Organizations:
Preliminary Evidence from Public Administrators and Planners," Comput., Environ. and Urban
Systems (14) 1990, pp 261-271.
Patton, M.Q. Qualitative Evaluation and Research Methods. Second edition. Newbury Park: SAGE, 1990.
Ramamurthy, K., and Premkumar, G. "Determinants and Outcomes of Electronic Data Interchange Diffusion " IEEE Transactions on Engineering Management (42:4) 1995, pp 332-351.
Rogers, E.M. Diffusion of Innovations, (4 ed.) The Free Press, New York, 1995.
Shapiro, C., and Varian, H. Information Rules – A Strategic Guide to the Network Economy Harvard Business School Press, Boston, 1998.
Shapiro, C., and Varian, H.R. "The Art of Standards Wars," California Management Review (41:2) 1999, pp 8-32.
Stallings, R.A. "Threats to Cities: Large-Scale Disasters and September 11, 2001", Background
paper for Institute for Civic Enterprise Seminar, 4 September 2002, School of Policy, Planning,
and Development, University of Southern California, 2002.
StrateGIS-projektet "12 frågor och svar om GIS. Ett läsmaterial för chefer och beslutsfattare," 2003. http://www2.lst.se/strategis/kursmaterial/index.htm (Access May 24, 2007)
Söderman, T. "En kartläggning av hur långt kommunerna i Västmanlands län har kommit gällande införandet av GIS – identifiering av framgångsfaktorer och hinder " Institutionen för ekonomi och
informatik, Mälardalens högskola, Eskilstuna, 2000.
Wildemuth, B.M. "An Empirically Grounded Model of the Adoption of Intellectual
Technologies," Journal of the American Society for Information Science (43:3) 1992, pp 210-224. Zeug, G. and M. Pesaresi “Global monitoring for security and stability (GMOSS). Integrated scientific and technological research supporting security aspects of the European Union.” Ispra
(VA), Italy, European Commission – Joint Research Centre, 2007, URL:
http://publications.jrc.ec.europa.eu/repository/bitstream/JRC41424/eur%2023033%20en.pdf Yun, J. H. J., et al. "Development and Social Diffusion of Technological Innovation: Cases Based on Mobile Telecommunications in National Emergency Management." Science Technology and