http://www.diva-portal.org
Postprint
This is the accepted version of a paper presented at 2017 IEEE International Conference on
Industrial Technology, ICIT 2017, 23 March 2017 through 25 March 2017.
Citation for the original published paper:
Lisova, E., Uhlemann, E., Åkerberg, J., Mats, B. (2017)
Delay attack versus clock synchronization - A time chase
In: Proceedings of the IEEE International Conference on Industrial Technology (pp.
1136-1141).
https://doi.org/10.1109/ICIT.2017.7915522
N.B. When citing this work, cite the original published paper.
Permanent link to this version:
Delay Attack versus Clock Synchronization –
A Time Chase
Elena Lisova, Elisabeth Uhlemann, Johan Åkerberg, Mats Björkman
Mälardalen University, Västerås, Sweden
{elena.lisova, elisabeth.uhlemann, johan.akerberg, mats.bjorkman}@mdh.se
Abstract— Clock synchronization is one of the most essential
assets for distributed real-time systems, as sensing, control and actuation require synchronized communication to meet real-time deadlines. We propose a distributed monitoring method to detect if an adversary is interfering with the clock synchronization pro-tocol. The monitor uses certain network indicators and a set of rules to decide about switching between Normal, Quarantine or Attack Detected states. Further, we propose a way to define thresholds for decision-making based on theoretical analysis of the indicator values influenced by an attack. In addition, we for-mulate the problem of adversary influence detection in the net-work as a detection theory problem and use it to derive an addi-tional indicator for the network monitor. Finally, we analyze the time chase between the monitor and an adversary to investigate which factors influence the final outcome.
I. INTRODUCTION
The dependability of distributed control applications with real-time requirements is strongly tied to precise and correct clocks [1]. Therefore, robust clock-synchronization for safety-critical application with real-time requirements is a paramount need to address [2]. There are several widely used standards for clock synchronization in industrial networks. Here, we consid-er IEEE 1588 [3], as it is common in distributed real-time sys-tems [1]. The protocol has a master-slave approach, i.e., the master has an excellent clock and the other nodes adjust their clocks to this. Robust clock synchronization should consider both security threats and operational faults, i.e., if clock syn-chronization can be broken as a result of a security breach or if it is not safe enough. A possible way to break clock synchroni-zation with IEEE 1588, is by an asynchronous delay attack [4]. The prerequisite of such an attack is prior network penetration by an adversary. One of the ways to penetrate the network is by using weaknesses of the Address Resolution Protocol (ARP), i.e., by conducting an ARP poisoning attack [5]. Annex K of the 1588 standard has some security guidelines, e.g., targeting message integrity and group authentication. However, its eval-uation has shown that the security service needs improvement [6], as it cannot cope with some types of attacks [7].
The effect of delay attacks on clock synchronization can be mitigated by using a multipath strategy [8]. However, this solu-tion requires changes to the standards. We have proposed to use distributed monitoring as a tool to detect that the network is under attack, and to prevent propagation of adversary influence by deploying relevant mitigation techniques [9]. This paper is a continuation of our work [9], where a game theory framework
was proposed to investigate the interaction between a monitor and an adversary. The main focus of this paper is the delicate balance between the time needed for a monitor to detect an attack and the time needed for an adversary to reach its target; to keep the network unsynchronized sufficiently long to dam-age the application. Furthermore, we formulate the attack dis-closure procedure detection as a detection theory problem. This allows us to introduce an additional indicator that can be used by the monitor to confirm if an adversary is present in the net-work. We investigate how a monitor can set thresholds for making a decision about suspicion of adversary presence in the network by continuous monitoring of indicators, i.e., character-istics revealing a new trend in the calculated clock offsets. Based on the ways those thresholds are set, the time chase be-tween an adversary and the monitor can be evaluated. Alt-hough we consider clock synchronization being affected by a security breach, the approach is based on run-time monitoring of calculated offset and, therefore, can also be used to detect existence of potential safety problems in the network, e.g., mal-functioning of time-stamping in a switch. It allows the use of monitoring as a part in a safety case of networks following any kind of schedule [10]. A safety case is a collection of argu-ments demonstrating that the required level of safety is achieved and it should also cover security-related aspects [11].
The reminder of the paper is organized as follows. Section II introduces the necessary background whereas Section III presents an analysis of the considered indicators. The addition-al indicator derived by applying detection theory and its anaddition-aly- analy-sis is also presented. Section IV presents a discussion about the time chase between an adversary and the monitor. Finally, Sec-tion VI concludes the paper.
II. BACKGROUND
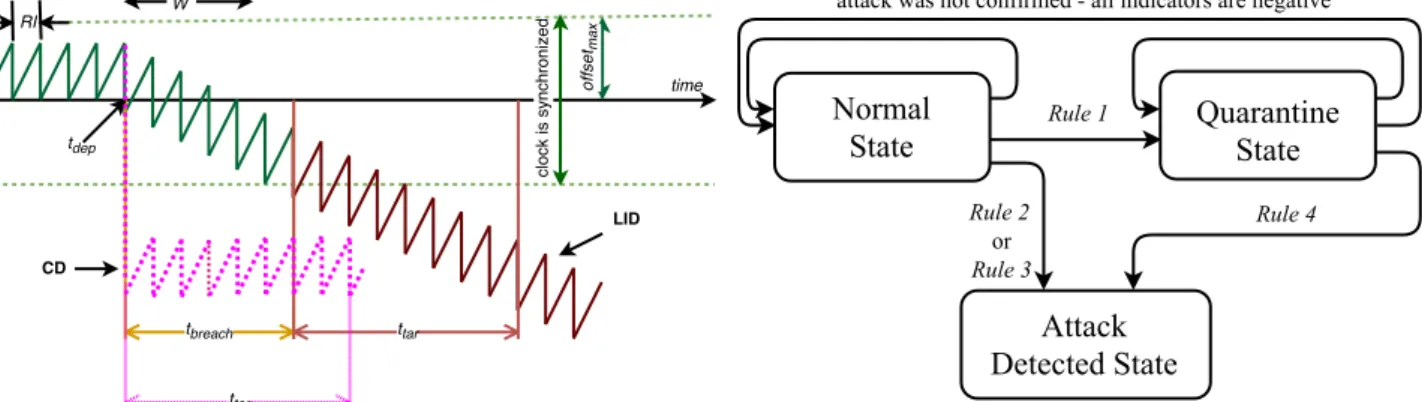
To be able to coordinate schedules, the nodes need to share the same notion of time. Therefore, their clocks should be peri-odically corrected by a clock synchronization algorithm as it is presented in Fig. 1, where the solid green teeth represents the time difference between a node’s clock and its grand master (GM) clock. The difference between GM time and the local node time at the end of each resynchronization interval (RI) is called offset. If the clock stays within the allowed boundaries marked as dashed green lines in Fig. 1, the offset is less than
offsetmax and the node is in a synchronized state, otherwise it is in an unsynchronized state. The offset is typically calculated via the exchange of time-stamped synchronization messages.
In IEEE 1588, a slave and a GM are exchanging synchroni-zation messages as follows. First, the GM sends out a time stamped sync message. When the slave receives the message,
The research leading to these results has received funding from the People Programme (Marie Curie Actions) of the European Union's Seventh Framework Programme FP7/2007-2013/ under REA grant agreement n°607727 and the SafeCOP project receiv-ing fundreceiv-ing from ECSEL Joint Undertakreceiv-ing under grant agreement n°692529.
Figure 1 Clock synchronization under a delay attack
it also timestamps it to access the arrival time and sends out a delay_req message containing the two previous time-stamps plus a new one to indicate the transmission time. Final-ly, when the GM receives that message, it timestamps it to de-termine its arrival and sends out a delay_resp message. At the end of such an exchange, both the GM and the slave have time stamps of the sync and delay_req messages at the moments of transmitting and receiving. Knowing these four values and assuming the absence of asymmetrical delay, the offset between the two clocks can be calculated.
If an adversary can selectively delay a message in one di-rection, e.g., the sync message, the locally calculated offset will have an error that equals half of the imposed delay [12]. This kind of attack is powerful, as it does not require changing the message or producing a new one. In Fig. 1, a delay attack is initiated at tdep, where two types of delays are presented: the solid teeth indicates a linearly increasing delay (LID), whereas the dotted teeth a constant delay (CD) [9]. In each RI there is an uncompensated error in the calculated offset that eventually brings the node into unsynchronized state. With a LID, it takes
tbreach to gradually increase the imposed delay enough to breach clock synchronization. The adversary target is to keep the node
unsynchronized for at least ttar, as the number of erroneous
messages then becomes sufficient to make the application fail. Distributed network monitoring is used to detect adversary presence in the network and to detect if a node is un-synchronized. A monitor is located in each node and it collects statistic about offset measured according to e.g., IEEE 1588. As shown in Fig. 2, there are three possible states for the net-work, namely, normal (NS), quarantine (QS) and attack detect-ed state (ADS) [9]. In NS, the monitor believes that there is no active adversary in the network and clock synchronization has not been broken. In ADS, the monitor is assured that there is an adversary in the network affecting clock synchronization. Fi-nally, in QS there are indicators of anomaly activity in the net-work, but the monitor is not assured and needs additional ar-guments in favor of an attack being performed. There are rules for switching between the described states. These are based on evaluation of relevant indicators, i.e., characteristics calculated by the monitor based on observed samples of calculated offset values. There are two types of indicators: one group we call main indicators, which are monitored constantly; and a se-cond group termed additional indicators used only in QS.
Figure 2 Networks states and rules of switching between them
III. TIME ANALYSIS OF INDICATORS
The mean and standard deviation of the calculated offset are likely useful indicators. Offsets of N consequent RIs are used: σ = 1 N i=1offseti N
∑
, (1) σ = (offseti−σ)2 i=1 N∑
N−1 . (2)Although these two indicators are not independent characteris-tics of the offset distribution, they are natural initial choice in attempting to detect a new trend in the distribution, as they can be calculated easily and reflex the main changes.
As attack discovery is connected to the monitor checking the indicators values, we need to analyze how fast these are changing with response to the delay attack. To analyze how the indicators behave with time during the attack, we divide the measured offset, offset, into two components: one caused by natural factors (e.g., natural clock drift and channel delay
caused by, e.g., environmental conditions), offsetreal, and one
caused by the attack, offsetattack. The offset measured in a node
at the i-th RI is presented as a sum:
offseti= offsetreal,i+ offsetattack,i. (3)
In the similar manner we split the indicators. Let j be a RI when the attack was deployed, i.e., offset values calculated starting from the j+1 RI and further have an error caused by the adversary. The mean then can be presented as:
σk= 1 k i=1offsetreal,i k
∑
+1 ki= j+1offsetattack,i k∑
, (4)where the first term represents the indicator value caused by nature and the second one by the attack. In other words:
σreal, k= 1 k i=1offsetreal, k k
∑
, (5) σattack, k= 1 ki= j+1offsetattack,i k∑
. (6)Having equation (4), we can plot the dependency of the indica-tor value for the considered types of delay attack. To do this a statistic window, W, should be set, i.e., the amount of samples or offsets that are used for the calculations. With each RI the window moves by one element and allows partly discarding the previous history of the indicator, which can be useful, e.g.,
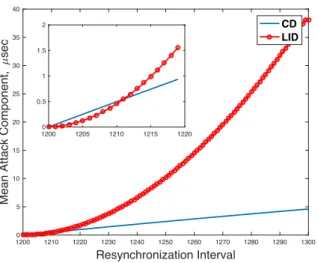
Figure 3 Mean values under different types of the delay attack
for industrial sensor networks with limited resources. The re-sults presented in Fig. 3 are obtained for the following values:
j= 1200 offsetmax= 40µs
W = 100 dCD= 2offsetmax⋅ 150%
1 λ =80 µs dID = 2offsetmax⋅ 25%
meanreal= 80µs dmax= 2offsetmax⋅ 300%
(7)
where λ is the parameter of the exponential distribution for
natural delay. Note that the offset is multiplied by two in the calculations, as the offset imposed by the adversary is a half of the imposed delay. Fig. 3 shows that the mean is affected by adversary influence, but, the values increase only slowly, i.e., it takes several RIs before the attack is visible. In bigger perspec-tive, the influence of the adversary is clearly visible, but it can be challenging to detect adversary presence before clock syn-chronization is broken for a sufficiently many RIs.
The second indicator can be analyzed in the similar man-ner. By using equations (3-6) we have:
(k−1)⋅σk2= (σ
real,i− offsetreal, i)
2
i=1 k
∑
+σattack, i− offsetattack, i
(
)
2+ 2σreal,ioffsetreal, i⋅
⋅ σattack, i offsetreal, i− offsetattack, i offsetreal, i − σattack, i σreal,i +offsetattack, i σreal,i ⎛ ⎝⎜ ⎞ ⎠⎟ ⎡ ⎣ ⎢ ⎢ ⎢ ⎢ ⎤ ⎦ ⎥ ⎥ ⎥ ⎥ i= j+1 k
∑
, (8)Let us introduce the following notation for the component of standard deviation caused by the nature:
σreal, k
2 = 1
k−1
(
σreal,i− offsetreal,i)
2
i=1
k
∑
. (9)Then (8) can be presented as:
. (10)
Figure 4 Standard deviation values under different types of the delay attack
In (10) the second component caused by the attack, therefore the following notation can be introduced:
σattack, k
2 = 1
k−1
(
σattack, i− offsetattack, i)
2 + 2σreal,i ⎡ ⎣⎢ ⋅ i= j+1 k
∑
⋅offsetreal, i σattack, i offsetreal, i −offsetattack, i offsetreal, i −σattack, i σreal,i +offsetattack, i σreal,i ⎛ ⎝⎜ ⎞ ⎠⎟ ⎤ ⎦ ⎥ ⎥ . (11)By calculating σattack for different types of delays, the indicator
value can be compared. The results are presented in Fig. 4. We can see that compared to the attack component of the mean, the attack component of the standard deviation is more recognizable from the very beginning of the attack. This demonstrates that standard deviation can have a lower thresh-old set for making the decision of being under attack.
A relevant parameter that characterizes only the monitor, not the adversary, is the window size, W. It is a sliding win-dow, i.e., each RI the window is moved by one position. The choice of having a sliding window was based on the possibility of restricted recourses for the node. It is interesting to see how the standard deviation depends on the size of the window. Note that this is not the case for the mean, as its attack component does not depend on the real components of the offset. Fig. 5 shows the dependency of the attack part of the standard devia-tion from a window size for a fixed number of RIs and differ-ent types of attack. We can see that after some time the value does not change much, however there are rapid changes in the beginning. This “shaking” is more visible when the amount of samples without and with attack component are close to each other. This suggests that checking values of the standard devia-tion using different window sizes and comparing them can be used as an additional indicator. Further, we can conclude that it makes sense to start checking it only after we have a suspicion that something is wrong, i.e., in QS.
Next, we investigate how detection theory and more pre-cisely the Neyman-Pearson approach can be used as an indica-tor. Detection theory allows making an optimal choice in the sense of minimizing the probability of error of Type II (i.e., false negative probability), by selecting one out of two possible hypotheses based on test samples with fixed probability of
1200 1210 1220 1230 1240 1250 1260 1270 1280 1290 1300 Resynchronization Interval 0 5 10 15 20 25 30 35 40
Mean Attack Component,
7 sec CD LID 12000 1205 1210 1215 1220 0.5 1 1.5 2 (k−1)⋅σk2= (k −1)σ real, k 2 +
σattack, i− offsetattack, i
(
)
2+ 2σreal,ioffsetreal, i⋅
⋅ σattack, i offsetreal, i −offsetattack, i offsetreal, i −σattack, i σreal,i +offsetattack, i σreal,i ⎛ ⎝⎜ ⎞ ⎠⎟ ⎡ ⎣ ⎢ ⎢ ⎢ ⎢ ⎤ ⎦ ⎥ ⎥ ⎥ ⎥ i= j+1 k
∑
1200 1210 1220 1230 1240 1250 1260 1270 1280 1290 1300 Resynchronization Interval 0 100 200 300 400 500 600 700 800 900 1000Standard Deviation Attack Component
2, 7 sec 2 CD LID 1200 1205 1210 1215 1220 0 20 40 60 80 100
Figure 5 Attack component of standard deviation for different window size calculated at 10th RI
wrongly rejected main hypothesis, i.e., Type I error (i.e., false positive probability) [13]. To test the hypotheses, the Neyman-Pearson detection lemma can be used [14], defining a threshold for making a decision about which hypothesis is correct based on a set of collected samples:
Λ(offset) = L(offset H0)
L(offset H1) ≤threshold , (12)
where H0 is the main hypothesis, and H1 is an alternative
hy-pothesis, L is a likelihood function. Hypothesis H0 claims that
there is no malicious delay caused by the adversary and
hy-pothesis H1 claims that there is a malicious delay:
H0: offsetattack = 0 (13)
H1: offsetattack ≠ 0
In this case as it was demonstrated in (12), we can calculate the threshold for decision making as a ratio of the corresponding likelihood functions.
The overall conclusion from the conducted analysis is that once the attack is deployed the statistical characteristics of the measured offset change. It means that the considered indicators can be used for making a decision and switching states of the network. Standard deviation is more sensitive to the attack al-ready from the beginning and therefore, it can be used as a main indicator. Mean in its turn requires some RIs to clearly indicate the attack, and thus it can be used as an additional in-dicator in QS along with a check based on window size and Neyman-Pearson detection.
IV. THRESHOLDING INDICATORS
For each main indicator we set two thresholds: low and high. We call an indicator positive, when its value is bigger than the corresponding lower threshold, otherwise negative. The rules and their correlation to switching between states, as demonstrated in the Fig. 1, are the following:
Rule 1. If KQS of the main indicators are above the correspond-ing low threshold, the system is switched into the QS.
Rule 2. If more than KQS of the indicators are above the low thresholds, the system is switched into the ADS.
Rule 3. If KADS of the indicators is above the corresponding high threshold, the system is switched into the ADS.
Rule 4. If any of the cases described below is true, the system
is switched from QS mode to ADS:
Figure 6 Thresholds allocation and switching before network states
1. If there are positive indicators of network anomaly according to the additional indicators deployed in QS; 2. If Rule 2 or Rule 3 can be applied.
Having the results from Section III we can evaluate how the indicators react for the considered types of attacks. A threshold example based on standard deviation and LID is presented in Fig. 6. The other types of delays can be considered in a similar manner. In the case of LID attack, the chosen thresholds allow switching into QS after 7 RIs from the moment of an attack being deployed and into ADS after 16 RIs.
A threshold can be derived for the LID attack by consider-ing the Neyman-Pearson lemma under the assumption that two
scenarios are possible, namely: H1 – there is LID attack or H0 –
there is no attack, NA. Previously, we showed how the PDF of
the offset measured in a node can be calculated for the consid-ered types of delay attacks [9]. The detection coefficient was introduced to indicate the difference visible in the PDF when the network is under the attack and to show the level of adver-sary exposure. For the LID the detection coefficient can be calculated as: kLID= (e λ⋅i⋅dLID , m⋅ m=1 NLID
∑
pLID, m), (14)where i is a number of RIs; pCD/LID, m is the probability of the
adversary choosing dCD/LID, m for the respective sets of delay values for these attacks. The PDF of the asynchronous delay during the attack is an exponential distribution scaled with the detection coefficient value, i.e.:
foffset(offset)= kLIDλe−λ⋅offset. (15) The likelihood function for an exponential distribution can be presented as a multiplication of the related PDF for each
sam-ple from the window 1. Therefore based on (14) we can derive
the following likelihood for the described hypothesis:
L(H1, LID)= kLIDW λWe−λ⋅ offsetm=1 m
W
∑
. (16)
For the hypothesis H0, the likelihood function is the same as for different variants of hypothesis H1, but without the detec-tion coefficient. Now, we can calculate the thresholds accord-ing to (1) for the considered scenarios:
1 https://www.statlect.com/fundamentals-of-statistics/exponential-distribution-maximum-likelihood (26.11.2016) 0 10 20 30 40 50 60 70 80 90 100 Window Size 22 24 26 28 30 32 34
Standard Deviation Attack Component
2, 7 sec 2 CD LID 1200 1202 1204 1206 1208 1210 1212 1214 1216 1218 1220 Resynchronization Interval 0 10 20 30 40 50 60 70 80 90 100
Standard Deviation Attack Component
2, 7 sec 2 CD LID high threshold low threshold QS ADS NS
CD / LID / RD : ΛCD/LID/RD(offset)= kCD/LID/RD W
. (17)
To calculate values of the detection coefficient for different types of attacks, we need to define a set of possible steps for LID. Instead of using absolute values, we express the delays for different types of attacks through the variable x, which ex-act value can be chosen depending on the application. This way the results are comparable and more independent of the actual
values of the delays. For example, if offsetmax = 50µsec and an
adversary wants to break clock synchronization after maximum 10 RIs from the point in time when the attack was first
de-ployed, x equals 10µs. The delay set should be complimented
with a corresponding set of probabilities of occurrence, which we assigned randomly in Tab. 1.
Tab. 1 Delays sets and their probabilities LID dLID, µs pLID 0.1x 0.05 0.5x 0.30 1x 0.50 3x 0.15
Then, for the window size W the following values of detection coefficient for different strategies can be calculated:
kLID, i1/W = 5X, 65X, 1 227X, 24 443X, 490 430X, …; The values are calculated for different numbers of RIs.
The results above show that the considered attacks can be detected using the Neyman-Pearson approach. However, the conclusion is only valid for the values considered. A sensitivity analysis of the threshold and its parameters should be conduct-ed to generalize the outcome. This is one a direction for future work. The results were obtained for the window size 10, i.e., under the assumption that ten observed samples are satisfying
hypothesis H1. However, this is not the case when the attack
was just deployed. Therefore, the likelihood-ratio test can be used as an indicator for switching between QS and ADS, i.e. as an additional indicator. In this way, at the moment when the additional indicator is used the attack is already ongoing during some RIs and the technique can thus be used more efficiently.
The conducted analysis allows to set thresholds depending on application requirements, i.e., how many RIs a node can be in unsynchronized state. This number depends on how active the considered node is. For example, if it sends out status data once per 20 RIs, it can tolerate (i.e., does not propagate the adversary influence further itself) being in unsynchronized state for up 10 intervals on average. Setting these thresholds is a tradeoff between estimation of possible harm from the node being in unsynchronized state and cost of bringing the network into a safe state (as a result of switching into ADS) in case of a false alarm.
V. TIME CHASE
In this section we consider the interaction between an ad-versary and the monitor from a time chase point of view, i.e., what happens first: the monitor detects the adversary influence on clock synchronization or the adversary accomplishes its target of putting a node into unsynchronized state for at least a specified amount of RIs? We assume that the adversary goal is
breaking clock synchronization and keep it so for at least ttar.
The relation between the speed of a delay attack and the speed of an attack discovery influence the attack propagation in
the network and thus defines the attack efficiency. The attack influence on the network depends on how the error propagates through the topology and the particular use case. In this analy-sis we consider the time the adversary needs to put the node into unsynchronized mode and leave the further propagation of its influence outside of the scope.
Each RI, the clock is corrected according to a calculated offset, so that the clock time stays within the allowed
bounda-ries. The monitor needs tNS->QS after the attack was deployed to
switch the network into QS and tQS->ADS after it was switched to
QS to switch the network into ADS. The alternative scenario is when the monitor switches the network from NS directly into
ADS, tNS->ADS. The question is who is faster – adversary
achiev-ing its goal or monitor switchachiev-ing into ADS: Adversary wins!
min{tNS→ADS, tNS→QS+tQS→ADS} ≷ (tbreach+ttar). (18) Monitor wins
Even though the precise formulation of the problem can vary for different types of delay attack, the main question is the same, whether the adversary can succeed or the monitor can prevent it. In the LID case, the adversary needs some RIs to bring the clock into unsynchronized state. However, the LID mode may be appealing for an adversary as it implies that a trend in the indicators behavior appears before clock synchro-nization is actually broken and, therefore it can be challenging to detect. However, for the considered example, we can see that this type of the attack does not bring benefits from an indi-cators behavior point of view. For CD mode, the synchroniza-tion is broken from the moment the attack is deployed, i.e.,
tbreach = 0. This is an advantage for adversary, as the monitor needs to react faster compare to the case when the attack re-quires a preparation phase.
One way to cope with a delay attack is to introduce Re-laxed Mode [12], i.e., a mode when the clock is temporary al-lowed to exceed the boundaries. Such a mode brings degraded quality of synchronization, however it gives an advantage in
the time chase when tbreach ≠ 0. It can also be beneficial even if
tbreach = 0, in case the adversary does not have knowledge about the boundaries in the Relaxed Mode. There are different pro-posals for IEEE 1588 extensions [15]. However, as considered way to break synchronization is based on introducing selected asymmetrical delay, many proposed fault-tolerance techniques, such as on-the-fly time-stamping or grouping masters to a mas-ter group to detect a failure of one of them, cannot cope with this type of attack. The attack is challenging to counter react, as it does not require message modification. One of the feasible ways to detect such an attack can be a multipath strategy, how-ever in such case an adversary just needs to take over show-everal communication channels instead of one to succeed.
The more critical the application is the more desirable it is
to make tQS smaller (besides the overall goal to decrease
tQS+tADS) as the cost of a false positive can be tolerated. The earlier the network is switched into QS, the earlier additional monitoring techniques can be deployed, and the earlier we can start to decrease the level of trust for the current GM. However, it also implies bigger false positive probability. To find the balance risk assessment should be conducted to evaluate possi-ble harm and cost of preventing techniques [16].
One more factor to consider when shaping the monitor strategy comes from risk assessment. In the security area risk assessment can be built upon Attack Three Analysis (ATA), a
technique that helps to identify ways of an adversary to achieve its target and calculate the probability along with the cost of an attack [17]. We can characterize the monitor strategy by con-sidering the risks that exist in the system. Risks imposed by a decision can be calculated as a multiplication of severity of consequences, i.e., potential loss, with a likelihood of event occurrence:
risk = severity of consequences × probability. (19) For example, let us consider switching modes NS → QS from the monitor perspective. There is a risk to make a switch when there is no actual attack. The consequences are cost of taking additional precautions, e.g., checking additional indicators, tolerating reduced quality of clock synchronization introduced by the Relaxed Mode, and cost of eventual switching of the system into ADS. The related probability is called false posi-tive probability. There is also a risk to fail to detect a trend in the offset values. The consequences are the cost of the adver-sary achieving its target, i.e., disrupting the network, and the probability is termed false negative. The combination of these factors shapes the strategy of the monitor, i.e., how reactive it should be.
To reason about acceptable risks, the As Low As Reasona-ble PracticaReasona-ble (ALARP) principle can be used [18]. The ap-proach defines different risk zones that are connected to the probability of occurrence of related hazardous events. One such zone is an ALARP zone, in which the risk should be re-duces to as low as “reasonable practicable”. The challenge is to define this level for a concrete system. The basis of such rea-soning is a particular application, i.e., a use case. If it is a safe-ty-critical system, it is much more reasonable to invest more in its protection to reduce possible risks.
The time chase between an adversary and the monitor is de-fined by the adversary strategy to achieve its target and by the monitor strategy to counter-react. The only factor we can influ-ence directly is the monitor strategy, and we can only reason and make assumptions about the adversary strategy based on possible gains and cost investments. Here (18-19) serves as useful grounds for deciding how proactive monitor should be.
VI. CONCLUSIONS AND FUTURE WORKS
In this paper, we proposed a distributed monitoring method to detect if an adversary is interfering with the clock synchro-nization protocol. The monitor uses certain indicators and a set of rules to decide about switching between normal, quarantine and attack detected states. We proposed a way to set thresholds for switching between these states based on application re-quirements and time analysis of indicator performance. We also formulated an attack exposure problem using detection theory and formulated an additional indicator that can be used in quarantine state. To analyze the results, we considered a time chase between an adversary and the monitor. The results show that the mean values of the offset, as an indicator, reflects the trend change only in the long run and, therefore, can be used for applications that can tolerate a broken synchronization for several resynchronization intervals. Standard deviation in turn, detects changes in the trend faster, i.e., in fewer
resyn-chronization intervals and, therefore, can be used as an indica-tor for more critical applications. For the considered system model, an additional indicator was proposed, derived from de-tection theory, which is able to identify the considered types of attacks. However, a more complex hypothesis, that combines different types of attacks and detects influence on the offset more generally, needs to be considered to be able to generalize the outcome.
Future work includes several directions, such as generaliza-tion of the game theoretical framework, so that it can be appli-cable to protect other system assets; as well as further devel-opment of main and additional indicators. We plan to model several use cases to see how using a monitor affects the net-work dependability. We are also looking into an analysis of the monitor overhead to identify the cost of its implementation.
REFERENCES
[1] H. Kopetz and W. Ochsenreiter, "Clock Synchronization in Distributed Real-Time Systems," IEEE Transactions on Computers, vol. C-36, no. 8, pp. 933-940, 1987.
[2] L. Gong, "A security risk of depending on synchronized clocks,"
Newsletter, ACM SIGOPS Operating Systems Review, vol. 26, no. 1, pp. 49-53,
1992.
[3] IEEE 1588, "Standard for a Precision Clock Synchronization Protocol for Networked Measurement and Control Systems". Available: http://www.nist.gov/el/isd/ieee/ieee1588.cfm
[4] E. Lisova, E. Uhlemann, W. Steiner, J. Åkerberg, and M. Björkman, "Risk Evaluation of an ARP Poisoning Attack on Clock Synchronization for Industrial Applications," in Proc. ICIT, Taipei, Taiwan, 14-17 Mar., 2016. [5] N. Tripthi and BM Mehtre, "Analysis of various ARP poisoning mitigation techniques: a comparison," in Proc. ICCICCT, Kanyakumari, India, Jul., 2014.
[6] C. Önal and H. Kirrmann, "Security improvements for IEEE 1588 Annex K: Implementation and comparison of authentication codes," in Proc.
ISPCS, San Francisco, CA, Sep., 2012.
[7] A. Treytl and B. Hirschler, "Security Flaws and Workarounds for IEEE 1588 (Transparent) Clocks," in Pros. ISPCS, Brescia, 2009.
[8] T. Mizrahi, "A game theoretic analysis of delay attacks against time synchronization protocols," in Proc. ISPCS, San-Francisco, CA, Sep., 2012. [9] E. Lisova, E. Uhlemann, W. Steiner, J. Åkerberg, and M. Bjrökman, "Game Theory Applied to Secure Clock Synchronization with IEEE 1588," in
Proc. ISPCS, Stockholm, Sweden, Sep., 2016.
[10] T. Kelly and R. Weaver, "The Goal Structuring Notation – A Safety Argument Notation," in Proc. Workshop on ADSN, 2004.
[11] S. Burton, J. Likkei, P. Vembar, and M. Wolf, "Automotive Functional Safety = Safety + Security," in Proc. SecurIT, Kollam, India, Aug., 2012. [12] E. Lisova, M. Gutierrez, W. Steiner, E. Uhlemann, J. Akerberg, R. Dobrin, and M. Bjorkman, "Protecting Clock Synchronization - Adversary Detection through Network Monitoring," JECE, vol. 2016, pp. 1-13, 2016. [13] J. Perezgonzalez, "Fisher, Neyman-Pearson or NHST? A Tutorial for Teaching Data Testing," Frontiers in Psychology, 2016.
[14] H.L. Van Trees, "Classical Detection and Estimation Theory," in
Detection, Estimation, and Modulation Theory, IDate, 2001, pp. 19-165.
[15] G. Gaderer, R. Holler, T. Sauter, and H. Muhr, "Extending IEEE 1588 to Fault Tolerant Clock Synchronization," in Proc. WFCS, 2004, pp. 353-357. [16] P. A. S. Ralston, J. H. Graham, and J. L. Hieb, "Cyber security risk assessment for SCADA and DCS networks," ISA Transactions, vol. 46, no. 4, pp. 583-594, 2007.
[17] A. P. Moore, R. J. Ellison, and R. C. Linger, "Attack Modeling for Information Security and Survivability," 2001.
[18] R. E. Melchers, "On the ALARP approach to risk management,"