“Service Quality of Thai Travel Agency,
Thailand Resor AB,
in Sweden”
Group Member 2279:
Miss Suppalak Suksom 730328
Miss Rotjarek Lumyong 820502
Supervisor:
Jean-Charles Languilaire
EFO
705
Master Thesis
MIMA-International Business and Engtrepernuership
School of Sustainable Development of Society and Technology
Mälardalen University
23th November 2009
Abstract
Title: Service quality of Thai travel agency, Thailand Resor AB, in Sweden
Program: International Business and Entrepreneurship
Authors: Miss Suppalak Suksom 730328 - T005
Miss Rotjarek Lumyong 820502 – T143
Supervisor: Jean-Charles Languilaire
Date: 23/11/2009
Problem Statement: How can Thailand Resor AB gain its service quality for its Swedish
Tourist?
Research Question: What do Swedish tourists perceive service quality offered by Thailand
Resor AB based on 5 dimensions of SERVQUAL model? And how does Thailand Resor AB manage customers‟ expectations ?
Purpose: To explore the service quality attributes that constitute 5 dimentions of
service quality of Thailand Resor AB, to find the relative importance attached by Swedish tourists to each of the perceived service quality dimensions served by Thailand Resor AB, and to explore the management of customers‟ expectations
Method: This study is mainly grounded on quantitative method using
questionnaire followed SERVQUAL instrument. The data collection was come from primary data (questionnaire and interview) and secondary data (books, journals, and internet website)
Conclusion: The customers perceived all 5 SERVQUAL dimensions; tangibles,
reliability, assurance, responstiveness, and empathy, pertaining service quality performance at low level when compared with their expectation. Thailand Resor AB should fulfill these 5 gaps and pay attention at assurance dimension concerning conveying trust and confidence because of the highest gap. The dimension of tangibles (equipment, physical facilities, etc.), empathy (ability to see through the customer‟s eyes), responstiveness (willingness to help and provide prompt service), and reliability (doing what company have promised) were adjusted consequencely. The respondents highlighted the following key quality factors of their expectations; be treated with respect, be listened to and be dedicated attention, more friendly staffs, get the accoracy information. Some respondent have fuzzy expectations that he company have to further discover the real expectations by providing gauidance to their staffs to encourage them to ask questions.
ACKNOWLEDGEMENTS
This thesis would not have been successful without the assistance, both directly and indirectly, of many persons. First of all, we would like to express my deeply grateful thank to my advisor, Jean-Charles Languilaire, for his valuable advice and encouragement during the course of this thesis. We would like to thank an owner, Miss Tanaporn Nelson, and all staffs of studied company, Thailand Resor AB, for their kind willing help giving any supported information as well as distributing questionnaires to correct all data. Special thanks also go to all group colleagues for giving good memory during study and giving their wise suggestions, valuable comments and recommendations during seminar classes of thesis progress (PM0, PM1, PM2, and PM3) until the final work is presented. Finally we are vary grateful thank to our beloved family for their love, every support and encouragement.
Group 2279 Miss Rotjarek Lumyong Miss Suppalak Suksom
Table of Content
Page
Chapter 1 Introduction 6
1.1 Background 6
1.1.1 Tourism Industry in Sweden 6
1.1.2 Service Quality 7 1.1.3 Company Profile 9 1.2 Problem Statement 11 1.3 Research Question 12 1.4 Purpose 12 1.5 Limitation 12
Chapter 2 Theorical Framework 13
2.1 Service Quality Concept 13
2.2 SERVQUAL 14
2.3 Management of Customer‟s Expectation 18
2.4 The Conceptual Framework Model 20
Chapter 3 Method 21
3.1 Research Methods 21
3.2 Data Collection 21
3.2.1 The Secondary Data 22
3.2.2 The Primary Data 22
3.2.2.1 Questionnaire 22
3.2.2.2 Interview 26
3.3 Analysing Data 27
3.3.1 Summarising Data 27
3.3.2 Analysing Data Based on SERVQUAL Method 27
Chapter 4 Finding and Analysis
294.1 General Information 29
4.1.1 Respondents Demographics 29 4.1.2 Respondents Background 31
4.2 Service Quality 32
4.2.1 Service Quality of Total Respondents 32 4.2.1.1 Overall SERVQUAL 33 4.2.1.2 Each SERVQUAL Dimension 35 4.2.2 Ranking of Expectation and Perception 38
4.3 Customers‟ Expectation 41
Chapter 5 Conclusion and Recommendation
435.1 Conclusion 43
5.2 Suggestions and Recommendations 44
References 45
Appendix
- Appendix A: Questionnaire 50
- Appendix B: Raw Data from Questionnaires 55
List of Figure
Figure 1 Number of Customer‟s of Thailand Resor AB during 2007 to 2009 10 Figure 2 A dynamic model of expectations 19 Figure 3 Theorical framework of this research 20 Figure 4 Data Analysis Process from Bond 28 Figure 5 Pie Chart represented age group of the total respondents 30 Figure 6 Scatter diagram represented the income per month (SEK) of respondents 30 Figure 7 Pie chart represented the frequency of respondences related to travelling with any travel agencies (Left) and with Thailand Resor AB (Right) 32 Figure 8 Result of Expectation and Perception of All Respondents 33 Figure 9 Each Dimension‟s Result of Expectation and Perception of All Respondents 35 Figure 10 Prioritizing of each feature of customers‟ expectation 39 Figure 11 Prioritizing of each feature of customers‟ perception 40
List of Table
Table 1 Number and Rate of Increasing (percentage) of Customer‟s of Thailand Resor AB
during 2007 to 2009 10
Table 2 Some researches of service quality within tourism sector regarding with
SERVQUAL 17
Table 3 Estimating margin of error on sample survey results at 95% level of uncertainty 23 Table 4 Statement pertaining to the dimension presented in the questionnaire 25 Table 5 An interpretation of Likert Scale 27 Table 6 Sex and Age of Respondents 29 Table 7 Amount and percentage of respondents who have ever traveled with travel agencies (Question No. 4: Have you ever travel with travel agencies? And How many time?) 31 Table 8 Amount and percentage of respondents who travel with travel agencies a year (Question No. 5: How often do you travel with travel agency a year?) 31 Table 9 Amount and percentage of respondence who have ever traveled with Thailand Resor AB (Question No. 6: How often have you travel with Thailand Resor AB?) 32 Table 10 Averaged Score of Expectation and Perception of All Respondents 33 Table 11 Result of prioritizing the feature pertaining customers‟ expectation and
perception 39
CHAPTER 1 INTRODUCTION
The introduction presents and overviews the focus of this research as well as why this research are investigated and studied in terms of service quality in tourism industry. This part is therefore separated into 5 sub-topics which represent the background of this research, problem statement, research question, purposes, and the limitations.
1.1 Background
1.1.1 Tourism Industry in Sweden
The tourism industry is one of a crucial part in service sectors which generated 30% of the world‟s exports of service and continuously expanded from 2006 until 2007 by 6% of international tourism arrivals (UNWTO 2008). Beside, the tourism industry, including of inbound and outbound tourism, is not only a major source of incomes for any countries but also help to support the growth of other related businesses including restaurants, hotels, transportation, entertainment, souvenirs, and shop selling local product. Many sectors are affected in some way by tourism. As in Sweden, it is shown that travel and tourism industry share for different lines of business, and in 2006 travel and tourism industry‟s share of added value mostly affected on travel agencies as 100% of the added value, while air travel, and hotels and restaurants are affected by 89% and 60% of added value respectively. The growth of such businesses resulted in the increasing of employment rates and inflows of foreign currencies. In the past decade, the tourism industry also contributed to the country evidenced in a positive its trade balance. (TAT 2006; Nutek 2008) This is also the case in Thailand (Osotho 48th Vol. 9, 2008).
Travel agencies (tour operators) operated in tourism industry are major actors of the tourism industry development. They do not only provide a link between customers and the final travel service providers in the tourism countries, but they are also active in marketing and promoting a country‟s tourism development (Chang 2008). Since tourism is essentially integrated with many sectors in the economy, an underpining of the tourism industry is today much more considered by both of government and travel agency itself. To promote enterprise and entrepreneurship within the travel and tourism industry, Nutek; the Swedish Agency for Economic and Regional Growth has taken responsibility to support travel agency in Sweden through boosting skills, improving quality and cooperation. (Nutek 2008) At the same time, the government of Thailand is carrying forword inbound tourism in Thailand by setting up the Tourism Authority of Thailand (TAT) in Sweden as well as propagandising the national tourism promotional program. In 2009 the travelling campains have been established around 13 campains for pursuading the Thai travelling and attracting foreign tourist to visit Thailand, e.g. Amazing Thailand: Friends Forever, Thailand Travel Mart and Visit Thailand Year, etc. (TAT, 2009)
An increasing in the needs of customers is one key drived the competition in the service sector. Focused on tourism in Sweden, much in evidences is shown as the positive result in the Swedish tourist intention to visit Thailand. For instance, a number of Swedish tourist in Thailand during 2005 to 2007 was founded that 222,287 persons, 307,284 persons, and 378,387 persons repectively (Osotho, 2008). At the same time the Swedish travel trade which is comprised of members of the publication‟s editorial team and four representatives from the Swedish travel and tourism industry, ranks Thailand at the first in “World‟s Best Tourist Country 2009”, making this the 8th
executive time of the annual Swedish Grand Travel Award (TAT , 2009). By attractive these customer outcomes mentioned above , travel agency need to understand the tourists' involvement and interaction which directly impact on the overall perception of their tourism experience. At the same time, the competition in the tourism industry will be driven by intense preoccupation with the quality of service to enhance the overall tourism experience and that is as well challenge for tourism businesses in the future. (Kandampully, 2000)
1.1.2 Service Quality
Service competition in service sector has seen to be a reality as customer expectations move continuously upward due to that only satisfied customers are likely to remain loyal in the long run buniness (Heskett, Sasser, Schlesinger, 1997). Improving services would be more focused rather than to compete only on price or offering similar products in competitive market (Grönroos, 2007). The service concept is then significantly rising as followed an economic development in both domestic markets and internationally (Atilgan, Akinci, & Aksoy, 2003)..
Service differs from goods in terms of how they are produced, consumed, and evaluated. In service marketing context, the delineation of services, which are widely accepted by many scholars and marketers (e.g. Zeithaml, 1981, 1985; Levitt, 1981, Zeithaml & Bitner, 1996), can be defined through four characteristic differences between services and goods, “IHIP”, i.e. intangibility, heterogeneity, inseparability, and perishability (Wolak, Kalafatis & Harris, 1998) Services are normally “intangible” since they are performances and experiences which infrequently control accurate manufacturing specifications concerning a uniform quality like any objects. These performances often change from producer to producer, customer to customer, and day today, “heterogeneouse”. Production and consumption of services cannot be separated, “inseparable”, compared with goods that are separated into small units/ departments. Because quality in services often occures during service delivery as well as in an interaction between customer and provider. Finally services are “perishable” which are time dependent and can not be stored. (Parasuraman et al., 1985, in Tatakasem & Lee, n.d.; Parasuraman et al., 1990) As the inherent differences between goods and services, they therefore make unique exist as well as management challenges for service business and for manufactures that provide services as a core offering (Zeithaml & Bitner, 1996).
Beside, Edvardsson (1996) claimed that in the eyes of the customer, the service is one associated with added value and quality and that quality will satisfies the needs and meets the
expectations of customers, employees and owners. On the other hand, quality of service is also being the main driving force of service providers to build the competitive challenges as well as position themselves in market and to remain the existing customers as well as to attract more new customers to company (Kandampully, 2000 in Kvist & Klefsjo, 2006, Lewis, 1993 in Yoon, T-H & Ekinci, 2003). The growing recognition of the importance of such quality in service industries has been driven by the realization that high service quality results in positive behavioral intentions as well as greater market share and profitability. It is also seen as a beneficial effect on the bottom line performance for any companies (Caruana & Malta, 2002) as well as the delivery of high-quality services to customers (Atilgan et al., 2003). Likewise the service profit chain (SPC), developed by Heskett, Sasser, Schlesinger (1997), shows the positive relationship in model, amoung internal service, customer satisfaction and together with the outcome of profit. The assumption of the model is that profitability draws from customer satisfaction and loyalty which in turn are drawn from a customer‟s sense of value received, and the capability, productivity, satisfaction and loyalty of employees. The customer‟s sense of value from this model can be measured from the perceived quality of results received and the perceived quality of how these have been delivered. (Walker et al., n.d.) Moreover good quality of service is shown a fruitfulness in case of not only leading to positive word-of-mouth recommendation and repeating customers, but also avoiding a lack of satisfaction that will lead to negative results, e.g. complaints which can be expensive, time-consuming, and injurious to a destination‟s reputation in the dealing with such complaints (Swarbrooke & Horner, 2001 in Kvist & Klefsjo, 2006).
Neverthless service quality is not easy to evaluate for customers which differ from goods quality. As the criteria customers use to evaluate such service quality may be more difficult for any marketers to understand. In the other hand, service quality is not only entirely evaluated by customers on the outcome of that service, but its process of delivery is also considered during customers‟ evaluating (Parasuraman et al., 1991). To help understand a unique nature of services and improve the quality of service, one well know instrument have been proposed, SERVQUAL. This instrument was introduced to measure and evaluate service quality more than a decade ago (Parasuraman et. al, 1988). The 22 statements pertaining to 5 keys dimensions of service quality evaluation; i.e. tangibles, reliability, assurance, responstiveness, and empathy, are proposed and specifically related to perception of service quality which offer a multinational scale for measuring service quality in every service provider. A detail of SERVQUAL is further discussed in this report, in the next section of Chapter 2; 2.2 SERVQUAL, . This instrument has therefore be the most popular research instrument in both academic and industry, as well as a great deal of research has been carried out in recent years in various service sectors (e.g. Llosa S., Chandon, J. L. and Orsingher, C., 1998; Atilgan, E., Akinci, S. & Aksoy, S., 2003; Sivabrovornvatana, N, Siengthai, S, Krairit, D, & Paul, H, 2005; Kvist & Klefsjo, 2006; Stromgren, O., 2007, etc.).
Refered to the previous studies of SERVQUAL, some have found empirical support for the five dimensions, but some question the five service dimensions. Yoon & Ekinci (2003) stated that the number of relevant service quality dimensions is dependent on the nature of the
services being evaluated. For instance, the study result of Carman (1990 in Yoon & Ekinci, 2003) was expressed that only reliability, responsiveness, and tagibles are strongly affected on 3 different retail outlets (a tire store, placement center, and dental clinic), and the study suggested that “the number and type of dimensions could be different according to the services being evaluate”. As same as the study of Babakus & Boller (1992 in Yoon & Ekinci, 2003), they argued that “the domain of service quality might be complex in some industries and very simple in others” which was dependent on the nature of the services being evaluated. It was found on the other hand in tourism context as a study of Chang (2008) who evaluated Taiwanese travellers‟ perceptions of service quality on the guided package tour by SERVQUAL. The result was shown that „tangibility‟ dimension does not show much sinificance of service quality than other dimensions. Likewise any models, SERVQUAL has their own limitations depended on the circumstances and the subjects to be investigated. However, Chang (2008, p. 168) stated that “SERVQUAL instrument can still be partially used in the travel and hospitality industry and received considerable recognition in servic marketing.”
1.1.3 Company Profile
Thailand Resor AB is a small travel agency in Sweden which is very much a small-business industry as same as other companies in tourist industry. It was established on 2007 by Miss Tanaporn Nelson, Director of Thailand Resor AB, and the head office is located in Hantverkargatan, Stockholm. The company had formery composed of two shareholders and now it has been managed by only one owner, Ms Nelson. Products or service offered to their customers in Sweden is mainly focused on tourism program in Thailand, such as information of traveling in Thailand and included of any tickets. The company was run by two employees at the first year and nowadays there have six employees. Even if the company has run its business for only 2 years, the owner has experienced in tourism business in Sweden for 4 years as well as an gradual growth of company by 25% customer has increased since 2008. Their customers are classified between existing former customers and new customers, with 30% and 70% respectively. Company‟s website (thailandresor.se), magazine (for an instance of Thailand Magasinet), and road show are the ways to get insight into their customers. Furthermore in order to offer superier services to their customers, the company has coordinated with many resorts and hotels in their travel destinations, especially in Thailand, for establishing several Thai travel programs and gaining in the travel information to the customers. The information of destinations, hotels (new hotel in Bangkok, the rank of the most booked hotel in Bangkok, and hotel under a control budget) as shown in their website, are provided to the customers.
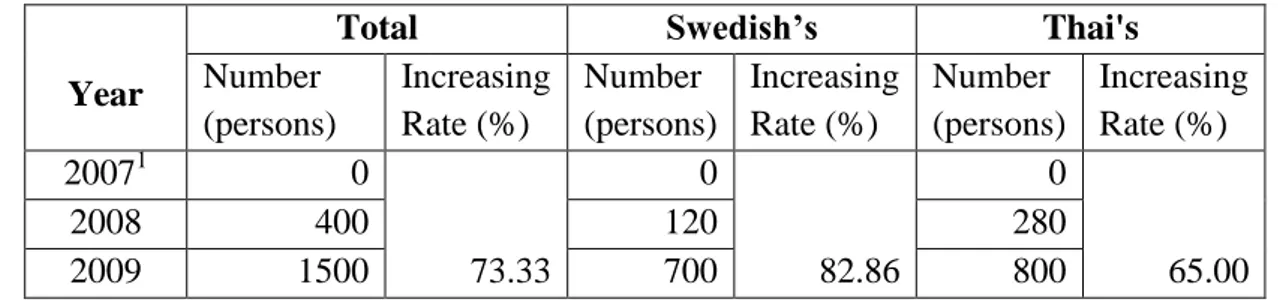
Underlying growth of number of customers, Thailand Resor AB‟s customers totally increase to 73.33% since 2007 (Table 1 and Fig. 1), which can be divided by customers‟ nationalities into 2 main groups; i.e. Swedish‟s and Thai‟s customers. It is found the positive trend of the number of both groups of Thailand Resor AB; 82.86% of Swedish‟s and 65% of Thai‟s. Ms Nelson views that the company can be flourished in the Swedish market as she said that she
would like to continually seek to enhance their customer loyalty as well as profitability. Therefore to understand the phenomena of their main target group of tourists in concern with expectation and perception of service quality is raised here in this research.
Table 1 Number and Rate of Increasing (percentage) of Customer‟s of Thailand Resor AB
during 2007 to 2009 (Nelson, T, May 15, 2009)
Year
Total Swedish’s Thai's
Number (persons) Increasing Rate (%) Number (persons) Increasing Rate (%) Number (persons) Increasing Rate (%) 20071 0 0 0 2008 400 120 280 2009 1500 73.33 700 82.86 800 65.00 1 Established year
Figure 1 Number of Customer‟s of Thailand Resor AB during 2007 to 2009 (Nelson, T, May
15, 2009)
Based on an operational management perspective, it is important that managers of tourism services understand the importance of tourists' involvement in the various activities (Kvist & Klefsjo, 2006). As well as Miss Nelson realize that this understanding will assist company to streamline their operations to enable them and to enhance the quality of the tourists' experience by incorporating the activities that they enjoy most.
0 200 400 600 800 1000 1200 1400 1600 2008 2009 Total Customers Swedish's Thai's
1.2 Problem Statement (re-write)
Quality is an issue of increasing significance in recent years (Erstad, 2001 in Stromgren, 2007). However services are complexity and normally differs from goods in terms of how they are produced, consumed, and evaluated as previously mentioned by its characteristics. Hence it is not easy for service providers to explain what and for customer to asses what. Moreover service quality is also different in many aspects from one person to another regardless of their expectations and perception. Service quality therefore would be measured to better capture the quality characteristics of individual industries under examination, likewise in travel agency. In order to success and prolong company‟s business, entrepreneur has to make sure it is providing the goods and services that customer wants as it gets its quality right and that it delivers on time. Similarily, Hoffman & Bateson also supported that high-quality services enhance customer satisfaction, increase market share, and enhance profitability of service organizations (1997, in Ekinci, 2002) as describe in service profit chain. Erstad (2001 in Stromgren, O., 2007) also addressed the service quality is a key success factor which can bring significant strategic advantages.
As mentioned by Kvist, A. K. J. & Klefsjo, B. (2006), “the citizens of many countries, such as those in eastern Europe, now find it much easier to travel abroad”. To go further and based on the fact that Swedish tourists value Thailand as a resort for holiday but only on an importance of travel agency in the satisfaction process. Furthermore due to Thai Travel‟s background, much evidences founded in tours of Swedish expecially to go to Thailand is grounded on high customer need; i.e. increasing in a number of Swedish tourist in Thailand during 2005 to 2007 (by 222,287 persons in 2005, 307,284 persons in 2006 and 378,387 persons in 2007) (Osotho 48th Vol. 9, 2008) Therefore much travel agencies in Sweden have focused on Thailand and greater level of competition in this service sectors has established.
Finally from above reasons, to understand service quality issues as well as understand customer perspective has intensified as a key success factor for improving service quality. Understanding exactly what customers expect and what customers perceived are the most crucial step in defining and delivering high-quality service (Parasuraman et. al, 1990). Thailand Resor AB is one of travel agency in Sweden which recognizes the quality as the business objective. The overall aim of this thesis is thus to focus on quality in a service company as a case of travel agency in Sweden, Thailand Resor AB. The problem statement is established in this research in terms of “How can Thailand Resor AB gain its service quality for its Swedish Tourist?” from understanding of Swedish customers‟ perspective. The better understanding of these phenomenon in tourism service‟s encounter as well as company itseft are particulary important and will permit the industry to better perform in high competitive market.
1.3 Research Question
For answering the above problem statement, the research studies the service quality in terms of what Swedish tourists perceive services from company: a case of Thai travel agency in Sweden “Thailand Resor AB” to better understand and insight into knowing its customers. The research questions of this study are therefore as following;
- “What do Swedish tourists perceive service quality offered by Thailand Resor AB based on 5 dimensions of SERVQUAL model?”
- “How does Thailand Resor AB manage customers‟ expectations?”
The questions are based on our framwork that will be explained in Chapter 2.
1.4 Objective
This research explores;
- The service quality attributes that constitute 5 dimentions of service quality in evaluating Thailand Resor AB‟s organization
- The relative importance attached by Swedish tourists to each of the perceived service quality dimensions served by Thailand Resor AB
- The management of customers‟ expectations within Thailand Resor AB
The purpose of this research would be moreover helping company define the areas of weakness in its service process and then it is useful for organizing and adjusting services to meet customer‟s need.
1.5
Limitation
According to the purpose of this research, some limitations have to be specifed for the further use of both practitioners and academias. Firstly this research is grounded on the service quality provided by travel agency, Thailand Resor AB. Therefore the results of this research might not be used to generalize in the different service areas because of the different in its characteristics and the quality attributes of each service industry. Secondly the research is only focused in Swedish tourists who have ever experienced with the services of Thailand Resor AB, especially in Thailand travelling programes, because Swede is the main target customers of this studied company, Thailand Resor AB. Therefore the other groups of tourists are excluded in this research. Finally since expectations of customers can evolve and change over time as a dynamic process, hence the term of service quality of any businesses and circumstances should be developed over time as well.
CHAPTER 2 The Theorical Framework
In this section, the basic concepts of factors and the theorical framework model are defined. First of all the terms and concepts of factors related to this research questions are clarified including of service quality concept, SERVQUAL, and management of expectations. Finally theses terms and concepts are connected and expressed by theorical framework.
2.1 Service Quality Concept
According to Parasuraman et al. (1991), companies can gain their competitive advantage by using of the technology for the purpose of enhancing the service quality by gathering information on marked demand. The conceptual models of service quality are the solution for supporting the management of each company to identify quality problems and therefore .
For decades, many researchers have developed a service perspective (Zeithaml, 2009, Ramsaran-Fowdar, 2006). The concept of service should be generally approached from the customer‟s point of view which may have different values, different grounds for assessment, and different circumstances (Chang, 2008). Therefore customers do not perceive quality at one dimentional concept and there also have perceptions of multiple factors when quality is assessed (Zeithaml & Bitner, 2000 in Atilgan et al., 2003). Parasuraman, Zeithaml and Berry mentioned that service quality is an extrinsically perceived attribution based on the customer‟s experience in what services customer perceieved through the service encounter (1985 and 1988 in Walker, Johnson, and Leonard, 2006). According to the work of Kumra (2008), service quality is not only involved final products and services, but also involved production and delivery process of services, thus employee involvement in process redesign and commitment is important to produce those final tourism products or services come into picture.
Another researcher studied on service quality is presented by Grönroos (2007) who focuses on a model that is a comparison between the consumer expectations of the service with their experience of the service they has received before. This model is named “total perceived service quality”. As he emphasizes on what customer is really looking for and what they evaluate, the service quality thus comprises of two dimensions. The first dimension is the technical quality. This dimension refers to the outcome or what is delivered or what the customer gets from the service. The next dimension is the functional quality which refers to the manner in which the service is delivered or how it is delivered. Both dimensions affected the corporate image and the perception of quality in various ways. According to total perceived service quality model, perceived quality of a service is not only affected by the experiences of the quality dimensions that the consumer went through for evaluating whether quality is perceived as good, neutral, or bad. Therefore, but also the perceived quality of a given service is as the outcome of an evaluation process. (Grönroos, 2007)
During the same eara and following Grönroos‟ line of thinking, Parasuraman, Zeithaml, and Berry developed the gap analysis model, which has a well-known model of service quality (1994 in Chang, 2008). This model shows an integrated view of the consumer-company relationship. The main idea of model is focused on the premise that service quality is dependent on the size and direction of 5 gaps in the service delivery process (see Fig. C1 in Apendix C);
Gap 1: the gap between consumer‟s expectation and those perceived by management to be the customer‟s expectations
Gap 2: the gap between management‟s perceptions of consumer expectations and the firm‟s service quality specifications
Gap 3: the gap between service quality specifications and service delivery
Gap 4: the service delivery, external communication gap
Gap 5: the perceived service quality gap, the difference between expected and perceived service (Parasuraman et al., 1990)
The first four gaps (GAP1, GAP2, GAP3, GAP4) are identified as functions of the way in which service is delivered from service proviser to customer, while GAP5 pertains to the customer and as such is considered to be the true measure of service quality. The later, GAP5 is the GAP that SERVQUAL instrument influence. From this gaps, Parasuraman et al. developed instrument used to define a perceived service quality of customers through criteris pertaining to service quality. This instrument is further discussed in the next topic.
Finally as mentioned by Edvardsson (1996), it is one key important for a service organization to define the level of quality at which to operate; he agued that it is more relevant to speak of the “right quality” than of merely high quality. Since service quality is now a considerable part of business as its subjective judged by customers (Edvardsson, 1996). Defining service quality and providing techniques for its measurement become a particularly complex issue in a high contact service industry such as tourism (Kvist & Klefsjo, 2006). It makes this issue important for service providers and researchers to properly and correctly measure and research its effectiveness as well as the need to measure of service quality for individual and different circumstances should be emphasized.
2.2 SERVQUAL
Because of the significant effect of service quality on an organization‟s success, a customer-oriented model, SERVQUAL, was introduced to assess service quality more than a decade ago (Parasuraman, Zeithaml,&Berry, 1988). The aim of this model is to help managers diagnose and improve the quality of services under their control. According to SERVQUAL, quality is the gap between customer expectations and perception of performance. The model offers a multidimensional scale that aims to measure service quality in any (and every) service organization. This proposition has made SERVQUAL the most popular research instrument in both academia and industry, and a great deal of research has been carried out in recent years using this model in various service organizations, including hotels. Those of 5
dimensions are classified into 2 mains considering which part of the service they are more involved in process or outcome. Reliability dimension represents the service outcome, which can be judged after the service was delivered to customers. The other dimensions of service are more related with the service process or it can be judged when the service was being delivery. (Parasuraman et al., 1991)
In service-quality concept, service quality can be measured by using the SERVQUAL instrument, an attribute-based evaluation, defined by Parasuraman, Zeithaml and Berry on 1985 (Parasuraman et al., 1991). SERVQUAL is a general instrument which is a concise scale which can use as a basic skeleton of its expectations and perceptions for any kind of service business (Parasuraman et al., 1990). Then it is now replicated in many different service categories by other service researchers (Llosa et al., 1998). This model is used to measure a service quality based on the difference between consumers‟ expectations and experiences of service. The initial 10 categories of the model are reliability; responsiveness; competence; access; courtesy; communication; credibility; security; understanding/ knowing; and tangibles. Then it was refined on 1988 into 5 dimensions because of the overlap across the 10 criteria. These attributes are focused on the notion of perceived quality, and would represent how customers organize information about service quality they get in their minds and judge through the level of service quality as well as overall (Parasuraman et al., 1991). The 5 dimensions are composed of tangibles, reliability, assurance, responsiveness, and empathy.
Tangibles: is attribute in which it is used to define appearance of physical facilities, equipment, personnel, and communication material, etc. Tangibles are more important in high contact services, for example conditions of the building.
Reliability: is ability to perform the promised service dependably and accurately.
Responsiveness: is use to define willingness to help customers and provide prompt service with customer requirements and complaints.
Assurance: covers knowledge and courtesy of employees and their ability to inspire trust and confidence.
1) Competence: staff should possess the necessary skill, knowledge and information to perform the service effectively.
2) Courtesy: the politeness, repect, consideration and friendliness shown to the customer by the contact personnel.
3) Credibility: the extent to which the service is believed and trusted. It involves the service provider‟s name and reputation and personal traits of front line staff.
4) Security: the freedom from danger, risk and doubt. It involves physical safety, financial security and confidentiality.
Empathy: is defined as caring, individualized attention the firm provides its customers.
1) Access: the ease of approachability and contact; this includes convenient opening hours, location and getting through on the telephone.
2) Communication: clear and regular communication with clients to keep them informed about the service, e.g. give detailed and accurate information whenever a delay in service occures.
3) Understanding/ knowing the customer: involves understanding the customer‟s needs and requirements. It emphasizes close client focus and customization.
(Jannadi & Al-Saggaf, 2000) This approach is argued by Kettinger and Lee (1997 in Atilgan et al., 2003) that it was a remarkable diagnostic tool for the assessment of service quality in the information service. The SERVQUAL is significantly well-built relationship between value and customer services in the tourism industry, which was the highest importance for determining the real meaning of customer satisfaction (Augustyn & Ho, 1998 in Atilgan et al., 2003). The service quality in the tourism industry therefore receives growing consideration as well (Hudson et al., 2004 in Chang, 2008). In the same manner Ryan (1999 in Atilgan et al., 2003) claimed that the SERVQUAL was a simple tool for tourism managers to use in tackling the areas of weakness in their service delivery. SERVQUAL can serve as an effective diagnostic tool to guide management in its service quality improvement efforts by focusing attention in the areas that are most needful (Kvist & Klefsjo, 2006).
Since the five dimensions mentioned above were generally written for any service sectors in any circumstances (Parasuraman et al., 1991), it needs to be adjusted specifically for each service provider likewise in the tourism sector. However it was found that there have been few empirical studies as shown in Table 2 that have used the SERVQUAL approach (Kvist & Klefsjo, 2006).
Table 2 Some researches of service quality within tourism sector regarding with SERVQUAL
Researchers Research Focus Finding
Hudson, S., Hudson, P. & Miller (2004)
The Measurement of Service Quality in the Tour Operating Sector: A Methodological Comparison (Importance-Performance Analysis (IPA), SERVQUAL, SERVQUAL-importance, SERVPERF)
The results indicate how each service quality dimension ranks for the holiday dimensions according to the 4 models. SERVPERF produces very different rankings to the IPA for dimensions (“company magazine” is ranked highest using IPA but lowest using SERVPERF). Similarly, SERVPERF produces different rankings for dimensions to SERVQUAL. Finally, factoring in importance makes little difference to SERVQUAL rankings (the ranking of only 4 dimensions change from 13 dimensions). Yet espite the many differences in rankings, the dimension skiing/ snowboarding is ranked in the top two by all tests, while the journey is ranked in the bottom three by all tests.
Kvist, A. K. J. & Klefsjo, B. (2006)
Which service quality dimensions are important in inbound tourism?: A case study in a peripheral location
“Reliability” was the most commonly mentioned dimension by Italian and British tourists to Sweden, which is supported the previous study of Zeithalm, et al. (1990). In the other hand, “responsiveness” do not accord with those of previous study, it was to be only the fourth most important dimension in the first phase (before the experience); moreover, the present study found that “responsiveness” diminished further in importance in the third phase (after the experience). “Tangibles” was counted as the least important mong five dimensions of service quality according to Zeithaml et al. (1990), but was ranked as third most important by the respondents in the present study, both before and after the experience.
Table 2 Some researches of service quality within tourism sector regarding with SERVQUAL (continued)
Researchers Research Focus Finding
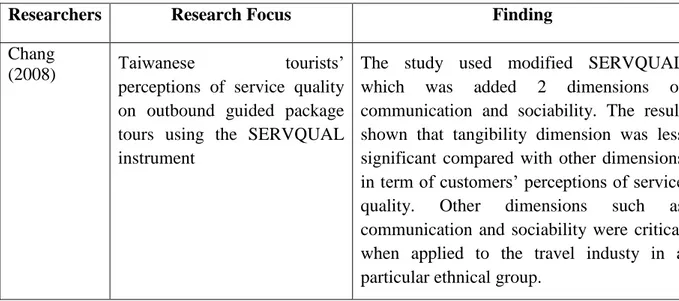
Chang
(2008) Taiwanese tourists‟ perceptions of service quality on outbound guided package tours using the SERVQUAL instrument
The study used modified SERVQUAL which was added 2 dimensions of communication and sociability. The result shown that tangibility dimension was less significant compared with other dimensions in term of customers‟ perceptions of service quality. Other dimensions such as communication and sociability were critical when applied to the travel industy in a particular ethnical group.
2.3 Management of Customers’ Expectations
The term expectations in service quality literature has a different meaning for different authors (Ekinci, 2002). However even if that term of expectation is vague and makes difficult surveys for interpretation (Bellini, 2002), understanding how customer expectations also have to develop and update for a part of success in influencing customer satisfaction (Tam, 2005). Likewise in the tourism industry, the competitiveness of the tourism companies will essentially ground on a fully professional approach to effect a tourism experience that exceeds tourists' expectations. Therefore the management of these customers‟ expectations is also an imperative concept in tourism companies for further products and services designing to match and exceed those expectations. (Kandampully, 2000)
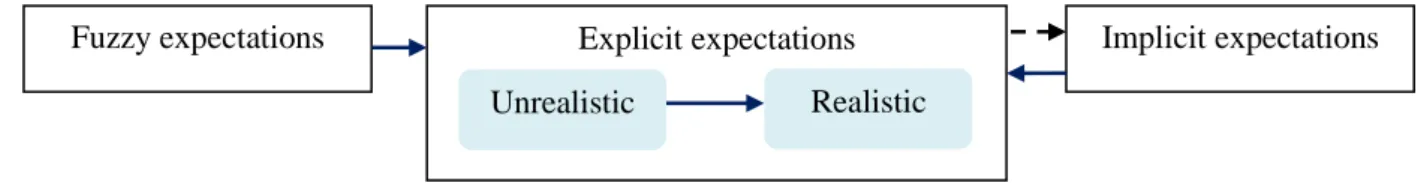
In order to increase long term quality, Ojasalo suggested that the customers‟ expectations should be focused, revealed, and calibrated. Ojasalo (1999 in Grönroos, 2007) developed the dynamics model of expectation for the way that the quality of professional services develops in a customer relationship over time. This model is illustrated in Fig. 2 which is classified the expectations into three distinguishable types and can be characterized in the following;
- “fuzzy expectations exist when customers expect a service provider to solve a problem but do not have a clear understanding of what should be done;
- explicit expectations are clear in the customers‟ minds in advance of the service processes. They can be divided into realistic and unrealistic expectations;
- implicit expectations refer to elements of a service which are so obvious to customers that they do not consciously think about them but take them for granted”
Intentional dynamics = expectations management Unintentional dynamics
Figure 2 A dynamic model of expectations
(Ojasalo, 1999, p. 97, in Grönroos, 2007, p. 99)
Followed Fig. 2, Grönroos (2007) stated that a service provider should understand fuzzy expectations because these expectations have still impact on satisfaction with quality or customers will be disappointed in case of the service provider does not fulfill it. The characteristics in this expectations of customers is that, “customers may feel that there is a need for service or for a change of their current state in general, but they do not have a clear understanding of what would be fulfill this need or change the current situation” (Grönroos, 2007, p. 100) or customers expect something more in addition to be done but they don‟t know exactly what and how should be done. Grönroos (2007, p. 100) also said that if the service provider “can make the explicit of these expectations for the customer and for itselft, there is an opportunity to satisfy the customer”.
Even though customers normally presume that explicit expectations will be met, unrealistic might be existed in these expectations. Service providers have to help customers adjust these unrealistic expectations into more realistic ones to ensure that a service delivery will meet customers‟ expectation. In this stage, service providers should be awared of the more vague promises or “implied-in-fact‟ promises because it can form unrealistic explicit expectations that lead customers to believe that service offered will include features that infact are not included. Beside explicit expectations, implicit expectations also have to be fulfilled because they are apparent that customers are never clearly expressed. Such implicit will become explicit if they are not fulfilled. (Grönroos, 2007)
Both fuzzy and implicit expectations should be detected, because they can form explicit expectations as seen in the thick narrows (Fig. 2); called “international dynamics”. It mean that how service provider can and should actively manage expectations. For the dotted line called unintentional dynamics, it is “shifts in the nature and range of expectations that take place over time interference from the service provider as the relationship process”. (Grönroos, 2007, p. 101)
Finally, the service provider should design the service offering to customers in order to meet all their expectations, and the dynamic approach to managing expectations in service contexts are therefore concerned (Grönroos, 2007). Berry and Parasuraman (1991 in Caruana, 1995)
Explicit expectations Implicit expectations Fuzzy expectations
also suggested that the management of customers‟ expectations involves in the relationship management and in the delivery of quality that the following.
1) “a realistic picture of the service is potrayed to the customer, 2) a premium is placed on company reliability,
3) effective communications with customers take place,
4) employees excel during service performance and exceed customers‟ expectations, 5) the recovery situation is exploited to the full. „a good recovery can turn angry,
frustrated customers into loyal ones (Hart, Heskett and Sasser, 1990 in Berry & Parasuraman, 1990)‟
2.4 Conceptual Framework Model
The theorical concepts used to shape and structure our research are mainly grounded on the theory of service quality. This research is mainly concentrated on service quality which is measured by SERVQUAL instrument as shown in Fig. 3.
Figure 3 Theorical framework of this research
Tangibles Reliability
Perceived Service Quality of Swedish Tourist Empathy Assurance Responsivenes s Management of Customers‟ Expectation of Thailand Resor AB
Service Quality of Thailand Resor AB
CHAPTER 3 Method
This chapter presents the way to conduct and gather information. Research method and data collection heading are therefore expressed as well as the way to analyze the data is developed.
3.1 Research Methods
Quantitative and qualitative methods are basically two different types of research method for collecting information. To accomplish each research purpose, the most appropriate method has to be chosen. Firstly, quantitative method is associated with numerical measurement or statistics as numbers or quantity is presented. (Swaine & Kozicki 2005, Connecting Learning Ltd) This method is generally applied for doing research in case of to verify the existing theories or to test hypotheses developed by previous researchers (Björklund & Paulsson, 2003 in Stromgren, 2007). It could be collected through questionnaires, surveys or attendance records. The other types of research method, quanlitative method, is on the other side, it is formed to collect data in case of in depth knowledge and understanding (Swaine & Kozicki 2005) as same as to gain a range of perspectives, opinions, ideas, and feelings which data cannot be presented by numbers. The quanlitative data can be acheived through individual interviews or group discussions, video, written diaries or observation numbers. It could be implied that number and statistic are not involved in the qualitative method and therefore the main different between these two research methods are the use of number and statistic. (Björklund & Paulsson, 2003 in Stromgren, 2007)
In this research, both quanlitative and quantitative methods are applied for collecting all relevant data of service quality offered by Thailand Resor AB. Lisewise Björklund & Paulsson (2003 in Stromgren, 2007) said that “while these two approaches to research are often presented as if they were in binary opposition to one another, they can also be used to complement one another.” Quantitative method is chosen to track data through rating-scale questionnaires based on previous theory (as mentioned by Björklund & Paulsson, 2003 in Stromgren, 2007) of SERVQUAL model developed by Parasuraman, Zeithaml and Berry (Parasuraman et al., 1990) because evaluating service qulity is directly defined by customers who have ever used such service as Parasuraman et al. (1990, p. 16) stated that “only customers judge quality”. At the same time, there have the open-questions in this questionnaire to finding out new things concerned with customers‟ expectations as well as to acquire quanlitative data that dealed with the attitudes and opinions of a range of individuals on an issue, and “how people understand their experiences (i.e. qualities)” (as mentioned by Björklund & Paulsson, 2003 in Stromgren, 2007).
3.2 Data Collection
For data collecting, two different types of data sources are expressed; primary and secondary sources of data. Throughout this research, both primary and secondary sources of data are used and discussed as in the following sub-topics. It is beginning with searching for the
secondary data as an overviews of literature involving in service quality and travel agencies in Sweden. Then collecting the primary data of Swedish tourist customers in Thailand Resor AB will be acheived by using questionnaires.
3.2.1 The Secondary Data
As mentioned by Stromgren (2007), the secondary data is indirectly relating to the purpose which is collected through a theorical study. The secondary data used in this research is consisted of books, electronic database and the internet website to acquire information of service quality and relevant concepts and theories as well as to fulfill the information of our research question consecutively. The books are loaned from the library‟s Mälardalen university. At the same time, any journals and articles are obtained from Malardalen University Library‟s online databases like Emerald, SAGE Premier, Science Direct, etc. These are wholly based on peer reviewed researches as suggested by Fisher (2007, p. 81) that means “two or more expert referees approved the papers before they were accepted for publication”. Fisher (2007) also recommended the journals that researchers should use like a main source for research dissertation and “it is probably being more important than books because the most up-to-date research and debates will be found in journals Fisher (2007, p. 81)”. Finally the internet as well as the World Wide Web is one beneficial source for finding data, such as the search engines or google toward the key words related in this study. However Fisher (2007, p. 81) stated that “the Web has to be used with care, because it includes both high-quality material and utter tosh.” Therefore the World Wide Web sources presented in this research was reliable sources, such as the sources sited by any universities and well-known organizations/ institutions.
3.2.2 The Primary Data
Throughout the research, the primary sources are used to conduct all the data which are directly related to the study purpose (Stromgren, 2007). Both questionnaire and interview are used as a research instrument for gathering information involved this purpose from target respondents.
3.2.2.1 Questionnaire
In this research, the questionnaire is provided to collect data of Swedish tourist in terms of perceived and expected service quality that is offered by the travel agency, Thailand Resor AB. The presentation of sample size, and how questionnaire are constructed, distributed and analyzed in order to gather accurately data, are expressed in this section.
a) Target Respondents
As this research studies in the travel agency named “Thailand Resor AB” which is located in Stockholm, Sweden. Swedes are the most customers of this travel agency and therefore Swedish tourists represent the target respondents in this research. The respondents are randomly selected from Swedish tourists who have ever experienced with the services offered by Thailand Resor AB, especially in Thailand travelling programes.
b) Sampling Size
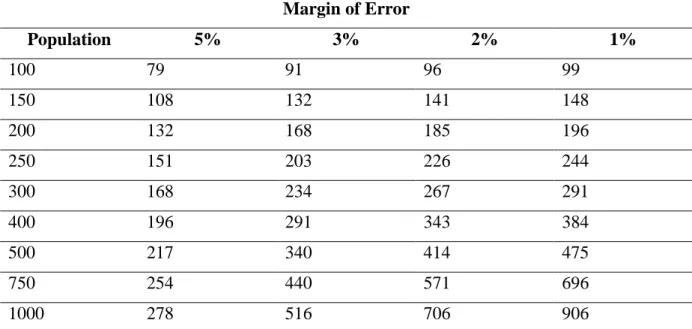
Determining sample size is a very important issue for collecting an accurate result within a quantitative survey design. “One of the real advantages of quantitative methods is their ability to use smaller groups of people to make inferences about larger groups that would be prohibitively expensive to study” (Holton & Burnett, 1997, p. 71, in Bartlett, Kotrlik, & Higgins, 2001). According to Fisher (2007, p. 189), to obtain the result that is representing the whole population, sample size should be taking regarding in part on the size of the margin of error that researcher can accept (Table 3).
Table 3 Estimating margin of error on sample survey results at 95% level of uncertainty
(Saunser et al., 2002, p. 156 in Fisher, 2007, p. 190)
Margin of Error Population 5% 3% 2% 1% 100 79 91 96 99 150 108 132 141 148 200 132 168 185 196 250 151 203 226 244 300 168 234 267 291 400 196 291 343 384 500 217 340 414 475 750 254 440 571 696 1000 278 516 706 906
Note: the number in table represented the number of complete questionnaires researcher have to get from respondance (returning of questionnaires)
Our target groups, Swedish tourist customers, are derived from customer database of Thailand Resor AB. In 2009, company have totally about 1500 customers, which is 700 Swedish customers and 800 of other national customers. Hence 254 Swedish customers are sampling in this study regarding 5% (+5/ -5) a margin of error in Table 3. The sampling technique chosen is random sample from population and all elements in the population have an equal chance of being included in the sample. Followed by Fisher (2007, p.189), the random survey is that “Random surveys of a suitably large sample allow you to determine what is average and what the variations around the average are, to a definable level of statistical confidence”.
c) Design of Questionnaire
In this stage, authors use an instruction for designing a questionnaire by setting any relevance questions followed Fisher (2007, p. 192). Fisher (2007) concerned 6 points in order to get the response rate at maximising level.
1. “Keep the questionnaire as short as possible 2 or 4 sides of A4 paper would be good for research for a Master‟s dissertation.
2. Design it to look attractive by using the capacities of your word processor.
3. Give it a logical and sequential structure so that the repondent can easily see what the questionnaire is about and can follow its themes as they develop.
4. Divide the questionnaire into parts that correspond to the various issues you are asking questions about. If you are going to ask for demographic information about the respondents (such as age, sex, job title, or whatever), ask for it at the end of the questionnaire. People are more likely to answer personal questions if they have already invested time and effeort in completing the rest of the questionnaire.”
5. Ask the easy questions first and the hard ones last.
6. Keep any personal questions (as long as they are justified) until last.” (ibid, 2007)
Based on these recommendations, authors have built the questionnaire that can be seen in Appendix A. The questionnaire have been developed into 3 main parts with different types of the question formats in order to conduct the relevance data of service quality offered by travel agency, Thailand Resor AB. Part I and II are grounded on SERVQUAL method of service quality concept that composed of expectation and perceived service quality of customers and that there are issues in measuring both of them in the same questionnaire. The last part, Part III, deal with a general information of respondents as shown in detail below.
Part I: Customers’ Expectations
To collect data of customers‟ expectation, 4 sub-topics questions are formed in this part. The first sub-topic (No. 1.1) follows the SERVQUAL questionnaire proposed by Parasuraman et al. (1990) that consists of 22 statements of questions based on 5 dimensions (i.e. tangibles, reliability, assurance, responstiveness, and empathy) (see 22 statements in Appendix A). These statements are then grouped for pertaining to the dimension as shown in Table 4. The formulation of the questions is the results of authers‟ understanding of each SERVQUAL dimension as presented in above theory.
Table 4 Statement pertaining to the dimension presented in the questionnaire (Parasuraman et al., 1990, p. 176)
Dimension Statements pertaining to the
dimension Tangibles Statements 1-4 Reliability Statements 5-9 Assurance Statements 10-13 Responstiveness Statements 14-17 Empathy Statements 18-22
A form of rating scale is claimed by Fisher (2007, p. 195) that is “commonly used to ask people about their opinion and attituded”. The five-point and seven scale are generally founded in previous study of service quality. In this study, the likert scale based on a five-point scale is used to acquire the data about customer perception according to SERVQUAL dimensions, towards Thailand Resor AB in Stockholm region after experiencing. We use five-point scale instead of seven-point scale because there are a lot of questions in this questionnaire needed the customers rating. Therefore the seven-point scale might be difficult to get an exacly feeling, respondents might be annoyed or frustrated for rating on too many question. Scales of 1 to 5 are used to rate a graduated scale and score each question range from 1 (strongly disagree) to 5 (strongly agree). (Fisher, 2007) Furthermore “no opinion” colume is also included to ask for opinion of respondences in 22 statements of questions for standing in the measurement of the dynamics of customers‟ expectations.
Secondly, how important each of five features of expectations pertaining to Thailand Resor AB and the service they offer are prioritized according to respondents‟ mind (sub-topic No. 1.2). Therefore the ranking questions are used as the question format in this topic for asking the respondents to put a number into rank order on each statement.
The open questions are subsequently used in sub-topic No. 1.3 and 1.4, to ask for knowing new ideas and novel points of view or cannot anticipate the likely answers as mentioned by Fisher (2007). These questions are developed in concern of obtaining customers‟ expectations views of the target respondents.
Part II: Perceived Service Quality
This part is also organized for gethering data about service quality perceived by Swedish tourists of Thailand Resor AB. It is divided into 3 sub-topics. Firstly, respondents are asked the same 22 statement questions about the perceived service quality based on SERVQUAL (as same as sub-topic No. 1.1 of customers‟ expectations) with a set of five graduated scale (1; stroingly disagree to 5; stroingly agree). Then these five features pertaining to perceived service quality are presented for asking the respondents to put a number into rank order as well (sub-topic No. 2.2). Finally, an open question is used to obtain customers‟ new ideas and
opinions of the overall the service quality they perceieve as well as their suggestions in terms of “how Thailand Resor can provide better service to customers”.
Part III: General Information
This part is asked for the general demographic of respondents and other information related in their former travel experience. The dichotomous questions and multiple choice questions mainly use to collect the general data of respondants, for instance, demographic data (age, sex, income, etc.), traveling experience (have you ever travel with travel agencies?, etc.). Referred to Fisher (2007) the dichotomous questions is the questions that have only 2 alternatives to choose between, and suitable for clear-cut issures. For the nultiple choice questions, it is the questions that have a choice of 3 to 5 options and asks for one choosing. (Fisher, 2007)
d) Distributing the Questionnaire
The authors directly send the questionnaire to Thailand Resor AB, for distributing it to their customers that they have contacted address in database. The questionnaire is surveyed approximately 6 weeks, from the first of May 2009 until the middle of June 2009. The questionnaire distributed to Swedish people is only expressed in English because The Translation People (2009) said that “most Swedish people born in the last 50 years are able to communicate very well in English”. Furthermore it is found that “the general level of proficiency in English in Sweden is quite high” as English is widely taught in Sweden from primary school as well as English is ordinary reached Swedish people on television, in films and in music (Cunningham U., n.d.). However, the respondents are firstly maked sure that they are Swed who have ability to do the English questionnaires, by asking for English language before handing out questionnaires to each respondent.
3.2.2.2 Interview
The interview is used in this research in order to fulfill data provided by the study company, Thailand Resor AB. This interview data is related in area of no information about company or limitation of information in English and some area of information/ knowledge that relevance in this research. At the beginning of doing this research, the authors contact Thailand Resor AB via its telephone in order to discuss on the subject with their expert on 27th April, 2009. Then the authors met an owner of Thailand Resor AB, “Miss Tanaporn Nelson”, on 20th Mar, 2009, and an overviews of company profile and tourism market in Sweden are obtained. The data drawn from the interview is firstly transcribed to extract useful information from them, and then related those of information, comments, and suggestions with theories and concepts of our research.
3.3 Analysing Data
The empirical data collected from questionnaires are analyzed as the following descriptions.
3.3.1 Summarising Data
The large amount of data is normally analysing in diagrammatic form; e.g. tables, histograms and pie charts, by using statistical software packages (Fisher 2007). Throughout this research, SPSS 16 software (Statistical package for social sciences) and Microsoft Office Excel 2007 are statistical software packages used to tranform the raw data drawn from questionnaires to be easy to facilitate one as well as summarised into categorical data via tables, histograms and pie chart. The descriptive statistics like mean, mode, and median are determined and displayed by table. Meanor average is the sum of all data, divided by the number of data. Mode is the greatest frequency of data. Median is the middle vale or the number at which half data are more than that number and half are less than that number. Moreover standard deviations are also expressed to measure dispersion of data around the mean.
In this research the numeric data according to likert scale as well as gathering from questionnaires is defined as an opinion of respondents by a graduated scale which is ranged from 1 (strongly disagree) to 5 (strongly agree). The descriptive statistics‟ data (mean, mode, and median) is interpreted in the same way as the following; Koobgrabe, et. al. 2008
Table 5 An interpretation of Likert Scale
The Average between Interpretation of Respondents’ Opinion
4.21 – 5.00 The most
3.41 – 4.20 At much
2.61 – 3.40 Moderate
1.81 – 2.60 Less
1.00 – 1.80 At the least
3.3.2 Analysing of Service Quality based on SERQUAL
SERVQUAL scores can be used to assess a given firm‟s quality for each feature. The gap between perception and expectation (perceptions score minus expectations score) can then be judged on the service given to the customer. (Jannadi & Al-Saggaf, 2000)
SQi(feature) = Pi – Ei (1)
SQ (dimension) = 𝑛𝑖→1(𝑃𝑖 – 𝐸𝑖)/ n (2) when n = number of items in the dimension
when n = total number of features i = each feature
SQ = Service Quality P = Perception score E = Expectation score
The measurement shows the high level of perceived service quality when the higher (more positive, +) the perception minus the expectation score is obtained. In the contrary, the low level of perceived service quality is found when the bigger the minus score between the perception and expectation score is obtained or the worse the company‟s service quality. (Jannadi, O. A. & Al-Saggaf, H, 2000)
3.3.3 Interpretation
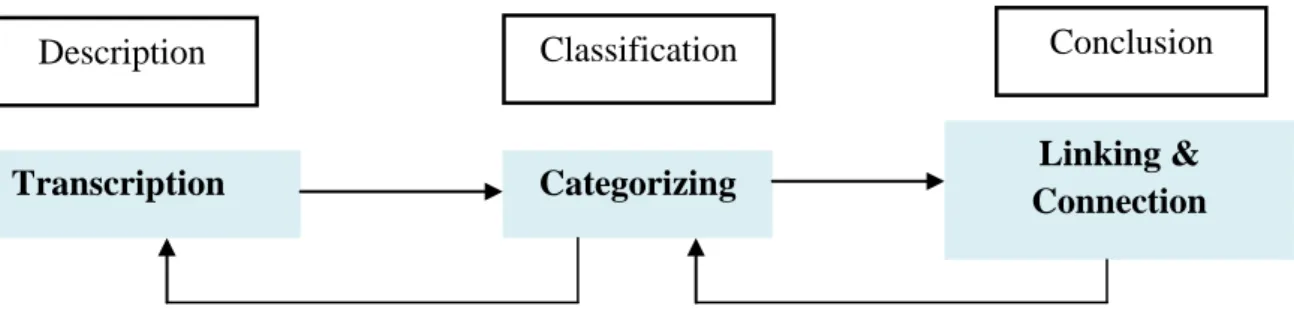
Then interpretation of qualitative information in this questionnaire will be used to help justify the quantitative results thoughts the respondents‟ feelings. Furthermore this data is liked with theories and concepts to identify how Thailand Resor AB can manage those of customers‟ expectation. Furthermore as mentioned by Bond “data never speak for themselves – they have to be interpreted by the researcher” (Bond 2006, p. 42 in Ferzan, Dung, & Thuy, 2008), and the interpretation of qualitative data is developed under the process suggested by Bond (2006, p. 43): description – classification – connection (fig. 4). Our interpretation of service quality based on SERVQUAL instrument applies from Bond‟s interpretation process by jumping into the second stage of Bond‟s, because the main collected data in this research is directly come from questionnaires. Therefore it is no need to transcrip and note from interview. Then organizing and classifying data into meaningful set that are the 5 dimentions of service quality. Finally the connection stage involved interpreting customers‟ view on each dimension of Thailand Resor AB‟s service quality and conclusions are summed up from the interpretation and linked with theories to identify areas company should improve.
Figure 4 Data Analysis Process from Bond (2006, p. 42, in Ferzan, Dung, & Thuy, 2008)
Transcription Categorizing Linking &
Connection
Conclusion Classification
CHAPTER 4 Finding and Analysis
This chapter presents the empirical data gathering by questionnairs which is divided into three parts; i.e. the general information of repondents, service qality of Thailand Resor AB from respondents’ experiences, and cutomer’s expectations . Analysis and discussion were also presented in this chapter.
The survey of this research was conduced by questionnaire. The duration was approximately 6 weeks (the first of May to the middle of June 2009). The questionnaires were directly sent to our study company, Thailand Resor AB, for distributing to their customers by e-mail, letter and on sight. The number of usable respondents was 254 which was selected from the total distribution of around 300.
4.1 General Information
This section shown the general information of our respondents which consisted of repondents demographics data and their background of travelling by travel agencies. (Question 1 to 3 of questionnair, see Appendix A)
4.1.1 Respondents Demographics
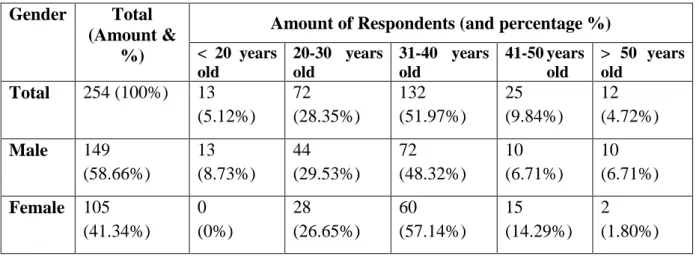
Based on gender, the main repondent in this research was in the age group of 31-40 years old which shown a percentage of 51.97. The age group of 20-30, 41-50, <20, and > 50 years old were followed respectively. The total repondent was also classified into 2 groups which were 58.66% of male and 41.34% of female. The main respondent of both male and female was in the age group of 31-40 years old which was as same as the tendency of the main respondent of the total.
Table 6 Sex and Age of Respondents
Gender Total
(Amount & %)
Amount of Respondents (and percentage %) < 20 years old 20-30 years old 31-40 years old 41-50 years old > 50 years old Total 254 (100%) 13 (5.12%) 72 (28.35%) 132 (51.97%) 25 (9.84%) 12 (4.72%) Male 149 (58.66%) 13 (8.73%) 44 (29.53%) 72 (48.32%) 10 (6.71%) 10 (6.71%) Female 105 (41.34%) 0 (0%) 28 (26.65%) 60 (57.14%) 15 (14.29%) 2 (1.80%)