APPLICATION OF GEOSTATISTICAL
METHODS TO DESCRIBE VARIATION
IN TECHNOLOGICAL PARAMETERS
OF ASH-SLAGS
Barbara Namysłowska-Wilczyńska
Wrocław University of Technology, Poland
Bożena Skorupska, Andrzej Wieniewski
Institute of Non-Ferrous Metals, Gliwice, Poland
ABSTRACT
Spatial analyses were carried out to develop a 3D geostatistical model of the spatial variation in the technological parameters of an ash-slag heap connected with the operation of the power utilities located near Świecie (Toruń). Tank A filled with ash-slags was the subject of geostatistical studies. The spatial variation of organic carbon content Corg, ash content AO,
moisture content W and recoverability e’ (defined as the amount of carbon [kg] recovered from 1 ton of ash-slag), was analyzed. The variation of these parameters in the horizontal and vertical extents of the ash-slag heap was subjected to structural (variographic) analysis using the directional variogram function. The parameters of geostatistical models approximating the empirical variograms of content Corg., ash content AO, moisture content W and recoverability
e’ were the basis for the estimation. Averages Z* and corresponding standard estimation deviations σk were estimated for the particular depths of the tank using (3D) ordinary (block)
kriging.
The variation of the parameters clearly differs between the particular depth levels of the waste heap. Carbon content Corg. and recoverability e’ were found to vary greatly while the variation
in ash content AO and moisture content W was respectively small and average. There is a
spatial correlation between the values of the investigated parameters. The variation of content Corg., moisture content W and recoverability e’, shows a certain regularity within the waste
heap tank. Maximum and minimum averages Z* (the upper limits) consistently decrease (a downward trend) with depth, in the interval of 1-10 m. The ranges of maximum averages Z* of content AO notably increase, reaching higher values in deeper ash-slag horizons.
Thanks to the application of the geostatistical methods to describe the parameters of the waste material (treated as an anthropogenic deposit) databases containing complete valuable input information for a project aimed at utilizing the deposited material were created.
KEY WORDS
Ash-slags; Technological parameters; Variation; Spatial analyses; Geostatistical methods; Directional variogram; Ordinary kriging.
1 INTRODUCTION
The aim of the spatial analyses was to create a 3D geostatistical model of the variation in the technological parameters of an ash-slag heap (tank A) connected with the operation of the
power utilities located in the Świecie area near Toruń in the Kujavian-Pomeranian Province. The various (estimation, simulation) applications of geostatistical methods in many fields of science and research, such as Earth sciences (geology, geophysics) and mining [5 - 6, 9 - 10] environmental protection [3 - 4, 8], climatology [8, 10], agricultural sciences, geochemistry, oceanology, epidemiology, meteorology, forestry, materials science and power engineering [5], and also to solve interdisciplinary problems have been widely reported in the literature [3 - 6, 8 - 9]. The great potential of geostatistics, enabling the modelling, estimation or forecasting of estimated averages Z* and simulated values Zs of the parameters characterizing various
regionalized phenomena [1–2, 5, 8, 10], and the universal methodological approach of geostatistics encourage researchers to try these techniques to solve problems in new research areas. A valuable advantage of geostatistical methods is that averages Z* and values Zs are
determined with respectively minimum estimation variance σ2k and also many other parameters
describing the effectiveness and quality of the estimations are obtained.
The present studies of the variation in the technological parameters of the ash-slags were carried out in collaboration of Author with the Institute of Non-Ferrous Metals in Gliwice [7] as part of Project ITI (KB/140/12504/IT1-B/U/08): “Development of a technology for the utilization of waste dump ash-slags through carbon separation by the froth flotation method” pursued by the Raw Mineral Materials Processing and Waste Utilization Department in INFM [11, 12].
Only selected results of the spatial analyses of the ash-slag heap parameters are presented. Variograms of organic carbon content Corg and recoverability e’ were modelled using the
directional variogram function. Then averages Z* of the parameters were estimated using ordinary (block) kriging. The results of the geostatistical studies are shown against the results of the estimation of the basic statistics, i.e. ash content AO, carbon content Corg., moisture
content W and recoverability e’ of the ash-slags, and the correlations between the parameters.
2 OBJECT AND RANGE OF STUDIES
The object of the statistical and geostatistical studies 1) was tank A within the ash-slags heap [7]. The ash-slag heap tank dimensions were: 150 m x 400 m x 10 m. The specific gravity of the material in the tank was 1.948 g/cm3. Test samples were taken from exploratory boreholes drilled within the ash-slag heap area at a depth of 1 ÷ 10 m and sample size n = 120.
Ash content AO, moisture content W, recoverability e’ were determined by the INFM
Laboratory of the Raw Mineral Materials Processing and Waste Utilization Department while carbon content Corg. was determined by the INFM Analytical Chemistry Laboratory [7]. A
database (in 3D) on the four technological parameters of the ash-slags deposited in tank A was created. The database contains values of coordinates X, Y, Z (depth) specifying sampling sites and the studied regionalized variables. The database content was the basis for the spatial analyses.
The variation of the selected waste heap parameters, i.e. organic carbon content Corg. and
recoverability e’(defined as the amount of carbon [in kilograms] recovered from 1 ton of ash-slag), was studied. Parameter e’ is calculated as a product of the yield and the carbon content in a given sample. The basic statistics and the distribution histograms of the parameters were estimated and the correlations between their values were analyzed.
3 INITIAL EVALUATION OF BASIC STATISTICS OF TECHNOLOGICAL PARAMETERS
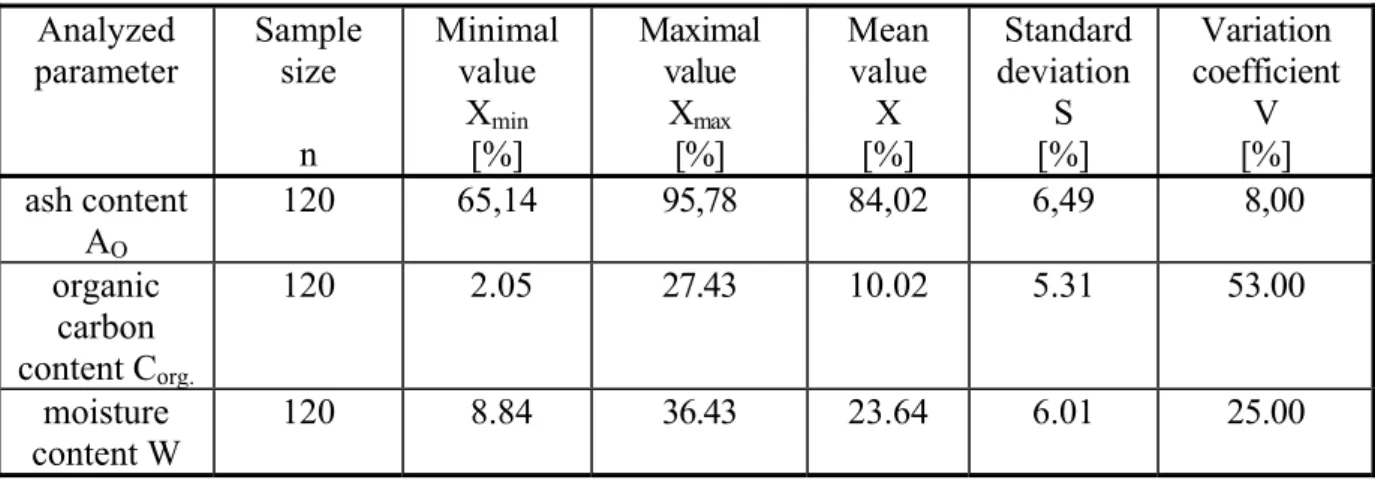
The estimates of the basic statistics of the technological parameters for tank A, based on the original data, show that the behaviour of the statistics varies depending on the parameter (see Tables: 1 ÷ 2). Ash content AO varies slightly (coefficient V – 8 %), moisture content W
varies moderately (V – 25 %), whereas organic carbon Corg. and recoverability e’ (V- 53 ÷ 59
%) vary greatly.
4 ANALYSIS OF CORRELATIONS BETWEEN TECHNOLOGICAL PARAMETERS The obtained linear correlation coefficients r indicate that the values of the investigated parameters are correlated [7]. The spatial correlations vary within tank A where the ash-slags are deposited.
Table 1. Basic statistics of technological parameters of ash-slags in waste heap Analyzed
parameter Sample size n Minimal value Xmin [%] Maximal value Xmax [%] Mean value X [%] Standard deviation S [%] Variation coefficient V [%] ash content AO 120 65,14 95,78 84,02 6,49 8,00 organic carbon content Corg. 120 2.05 27.43 10.02 5.31 53.00 moisture content W 120 8.84 36.43 23.64 6.01 25.00
Table 2. Basic statistics of technological parameters of ash-slags in waste heap Analyzed parameter Sample size n Minimal value Xmin [kg/tmat.] Maximal value Xmax [kg/tmat.] Mean value X [kg/tmat.] Standard deviation S [kg/tmat.] Variation coefficient V [%] recoverability e’ 120 7.97 254.33 85.42 50.43 59.00
Strong inverse negative-sign correlations between: ash content AO and organic carbon
content Corg. (r = - 0.75), ash content AO and moisture content W (r = - 0.75) and ash content
AO and recoverability e’ (r = - 070) were found. The strongest spatial positive-sign
5 STRUCTURAL ANALYSIS OF VARIATION IN TECHNOLOGICAL PARAMETERS
The structure of the spatial variation in the technological parameters was analyzed using directional variogram function γ(h) (variographic analysis). The variograms of the parameters, calculated along the borehole sampling depth, indicate a clear upward trend for variogram function γ(h) [ 7 ]. The strongest upward trend of the values of γ(h) with depth was observed in the content Corg. variograms (see Figure 1) and the recoverability e’ variograms (see Figure 2).
The variograms were approximated with a spherical model (Corg. ,e’) (see Tables 3 ÷ 4) or a
spherical model combined with the nugget effect CO (W, AO) [7]. Correlation distances, i.e.
ranges of influence, varied. The longest one was found for Corg..– a = 74.24 m and much shorter
for: e’– a = 13.22 m, W – a = 14.42 m and AO – a = 13.47 m and 11.26 m. No nugget effect CO
was observed in the directional variograms of the parameters (Corg., e’), which indicates the
lack of any sharp changes in the values of γ(h).
D-90 360 180 Corg. 0 20 40 60 80 100 120 140 Distance [m] 0 50 100 150
Variogram:content of coal Corg.[%]2
Isatis
Figure 1. Directional variogram of organic carbon content Corg. in heap ash-slags [%]2, with
D-90 360 180 e' 0 20 40 60 80 100 120 140 Distance [m] 0 1000 2000 3000 4000 5000
Variogram: recoverability e'[kg/tmat.]2
Isatis
Figure 2. Directional variogram of recoverability e’ of heap ash-slags [kg/tmat.]2, with the
fitted theoretical model.
Table 3. Comparison of geostatistical model parameters of directional (along axis Z) variograms of technological parameters of ash-slags in heap (tank A)
Analyzed parameter Nugget effect variance C0 [%]2 Partial sill variance C’ [%]2 Total sill variance C [%]2 Range of influence a [m] Principal structures of model organic carbon content Corg. - - 158.74 74.24 spherical
Table 4. Comparison of geostatistical model parameters of directional (along axis Z) variograms of technological parameters of ash-slags in heap (tank A)
Analyzed parameter Nugget effect variance C0 [kg/tmat.]2 Partial sill variance C’ [kg/tmat.]2 Total sill variance C [kg/tmat.]2 Range of influence a [m] Principal structures of model recoverability e’ - - 5558.87 13.22 spherical
6 RESULTS OF ESTIMATION OF TECHNOLOGICAL PARAMETERS
In the next stage of the geostatistical studies the ordinary (block) kriging technique was applied. Averages Z* and standard estimation deviation σk were estimated in 3D for the
particular ash-slags deposition depths within the heap, i.e. in an interval of 1 ÷ 10 m [7]. A 3D elementary grid with a 5 m x 5 m x 1 m elementary block was assumed for the kriging computations. The number of nodes along the particular axes was: X – 63, Y - 59 and Z – 10. The total number of 34090 nodes were taken into account in the estimation.
The kriging calculations took into account the values of the parameters of the geostatistical models representing the directional variograms of organic carbon content Corg. and
recoverability e’ in the heap (see Tables 3 ÷ 4).
As a result of the computations new databases containing 34090 grid data on grid node coordinates X, Y and Z, averages Z* and estimation deviations σk, evaluated in the centres of
the elementary grid blocks, were obtained [7]. The grid data can be further processed and they constitute a basis for more 3D analyses and the visualization of results and grid cross sections.
6.1. Results of estimating averages Z* of organic carbon content Corg. in nodes of 3D
elementary grid
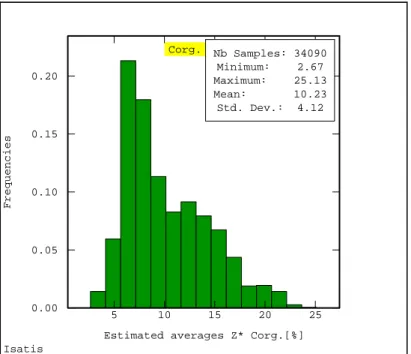
The histogram of estimated averages Z* of organic carbon content Corg. shows a clear
tendency towards positive skewness (see Figure 3), with coefficient g1 amounting to 0.75.
Variation coefficient V of averages Z* and standard estimation deviation σk of carbon content
Corg. in the ash-slags indicates respectively moderate (the upper limit of coefficient V) and
low variation of the two geostatistical parameters (see Table 5) [7].
Figure 3. Histogram showing distribution of averages Z* of organic carbon content Corg. [%]
in heap ash-slags.
Corg.
5 10 15 20 25
Estimated averages Z* Corg.[%] 0.00 0.05 0.10 0.15 0.20 Frequencies Nb Samples: 34090 Minimum: 2.67 Maximum: 25.13 Mean: 10.23 Std. Dev.: 4.12 Isatis
Table 5. Global statistics of geostatistical parameters of organic carbon content Corg. in heap
ash-slags (tank A), in nodes of 3D of elementary grid (ordinary block kriging). Geostatistical parameter Number of grid nodes n Minimal estimated value Xmin [%] Maximal estimated value Xmax [%] Mean value X [%] Standard deviation S [%] Variation coefficient V [%] estimated average Z* 34090 2.90 24.33 10.24 3.91 38.00 standard deviation of estimation σk 34090 2.10 13.62 10.71 1.13 11.00
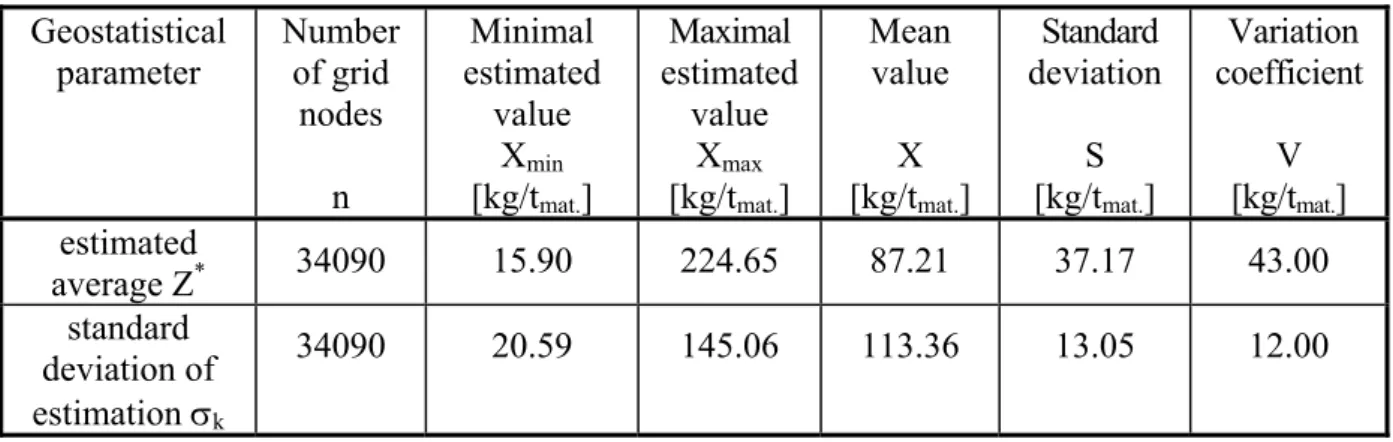
6.2. Results of estimating averages Z* of recoverability e’in nodes of 3D elementary grid The histogram showing the distribution of averages Z* of ash-slag recoverability e’ is characterized by distinct positive skewness (see Figure 4), with coefficient g1 reaching 0.80.
The coefficients of variation (V) of averages Z* indicate high variation of parameter e’, similarly as previously observed for content Corg. (see Table 5), and low variation of standard
estimation deviation σk (see Table 6).
The variation in averages Z* of recoverability e’ and (to a lesser degree) carbon content Corg
is higher in comparison with the very low variation in averages Z* of ash content AO and the
low variation in averages Z* of moisture content W [7].
Figure 4. Histogram showing distribution of estimated averages Z* of heap ash-slag recoverability e’ [kg/tmat].
Table 6. Global statistics of geostatistical parameters of recoverability e’ of heap ash-slags (tank A), in nodes of 3D elementary grid (ordinary block kriging).
e'
0 100 200 Estimated averages Z* e'[kg/tmat.] 0.00 0.05 0.10 0.15 0.20 Frequencies Nb Samples: 34090 Minimum: 19.15 Maximum: 220.05 Mean: 87.24 Std. Dev.: 36.88 Isatis
Geostatistical parameter Number of grid nodes n Minimal estimated value Xmin [kg/tmat.] Maximal estimated value Xmax [kg/tmat.] Mean value X [kg/tmat.] Standard deviation S [kg/tmat.] Variation coefficient V [kg/tmat.] estimated average Z* 34090 15.90 224.65 87.21 37.17 43.00 standard deviation of estimation σk 34090 20.59 145.06 113.36 13.05 12.00
7 CHARACTERIZATION AND 3D VISUALIZATION OF ESTIMATION RESULTS The raster maps showing the distribution of estimated averages Z* and standard estimation deviations σk of the technological parameters of the ash-slags allow one to trace the changes
in their values within the deposition area and to see if there is a spatial correlation between the values of the parameters as one moves towards the deeper horizons of the waste heap [7]. 7.1. Organic carbon content Corg. in ash-slags
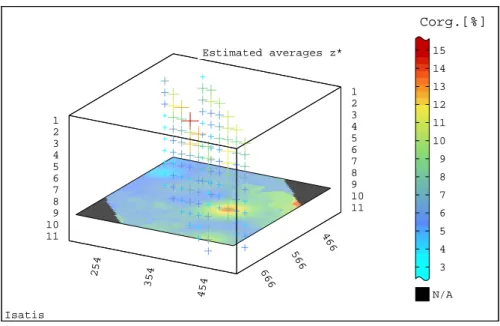
The raster maps of estimated averages Z*of organic carbon content Corg. [%]in the ash-slags
are shown in Figures 5 ÷ 6.
Figure 5. Raster map showing distribution of estimated averages Z* of carbon content Corg.
[%] in ash-slags in heap (at depth of 2 m).
Corg.[%] N/A 24 23 22 21 20 19 18 17 16 15 14 13 12 11 10 9 8 1 2 3 4 5 6 7 8 9 10 11 1 2 3 4 5 6 7 8 9 10 11 466 566 666 25 4 35 4 45 4 Estimated averages Z* Isatis
Figure 6. Raster map showing distribution of estimated averages Z* of organic carbon content Corg. [%] in ash-slags in heap (at depth of 9 m).
In the raster maps of the distribution of Corg. content averages Z* one can distinguish two
subareas differing in the ranges of this parameter (see Figure 5 ÷ 6). One of the subareas is characterized by higher carbon content values in a range of 17.32 ÷ 19.11 % at a depth of 2 m (see Figure 5) and a narrow zone of increasedCorg. content values in a range of: 20.90 ÷ 22.68
% at the same spatial location . In the other subarea the Corg. content is much lower, ranging
from 8.37 to 11.95 % at a depth of 2 m. There is a centre of increased Corg. content in a range
of 12.54 ÷ 13.74 % at a depth of 9 m (see Figure 6).
The spatial location of the narrow zones and centres of increased Corg. content exactly
coincides with that of the zones of low ash content AO while the subareas with lower Corg. are
associated with the subareas characterized by higher AO [7].
Maximum estimated averages Z* Minimum estimated averages Z* of organic carbon content Corg. of organic carbon content Corg.
1 m 21.13 ÷ 24.33 [%] 7.22 ÷ 10.43 [%] 2 m 20.00 ÷ 22.68 [%] 8.37 ÷ 11.06 [%] 3 m 17.75 ÷ 20.26 [%] 6.89 ÷ 9.40 [%] 4 m 16.82 ÷ 19.52 [%] 5.10 ÷ 7.81 [%] 5 m 15.02 ÷ 17.82 [%] 2.90 ÷ 5.70 [%] 6 m 14.70 ÷ 17.37 [%] 3.10 ÷ 5.78 [%] 7 m 14.39 ÷ 17.04 [%] 2.92 ÷ 5.56 [%] 8 m 13.65 ÷ 15.95 [%] 3.69 ÷ 5.99 [%] 9 m 11.94 ÷ 13.74 [%] 4.16 ÷ 5.95 [%] 10 m 11.99 ÷ 13.74 [%] 4.39 ÷ 6.14 [%]
The ranges of maximum averages Z* of content Corg. change consistently with deposition
depth (see Figures 5 ÷ 6). A similar regularity (but with some fluctuations) is observed for the upper boundaries of minimum averages Z*.
Corg.[%] N/A 15 14 13 12 11 10 9 8 7 6 5 4 3 1 2 3 4 5 6 7 8 9 10 11 1 2 3 4 5 6 7 8 9 10 11 466 566 666 25 4 35 4 45 4 Estimated averages z* Isatis
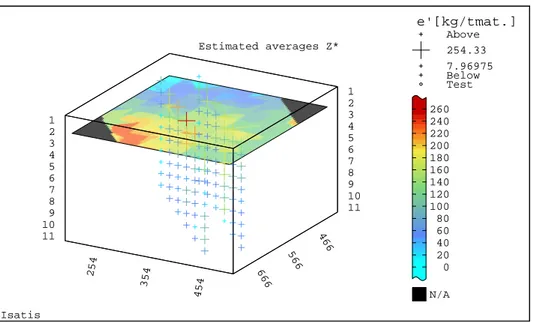
7.2. Raster maps of estimated averages Z* of ash-slag recoverability e’
The raster maps of estimated averages Z* of ash-slags recoverability e’ [kg/tmat.] are shown in
Figures 7 ÷8.
Figure 7. Raster map of estimated averages Z* of ash-slag recoverability e’ [kg/tmat.] at heap
depth of 2 m.
Figure 8. Raster map of estimated averages Z* of ash-slag recoverability e’ [kg/tmat.] at heap
depth of 9 m.
The raster map distributions of averages Z* of recoverability e’ (see Figures 7 ÷ 8) to a large degree resemble the distributions of averages Z* of carbon content Corg. (see Figures 6 ÷ 7).
e'[kg/tmat.] Above 254.33 7.96975 Below Test N/A 260 240 220 200 180 160 140 120 100 80 60 40 20 0 1 2 3 4 5 6 7 8 9 10 11 1 2 3 4 5 6 7 8 9 10 11 466 566 666 25 4 35 4 45 4 Estimated averages Z* Isatis e'[kg/tmat.] Above 254.33 7.96975 Below Test N/A 260 240 220 200 180 160 140 120 100 80 60 40 20 0 1 2 3 4 5 6 7 8 9 10 11 1 2 3 4 5 6 7 8 9 10 11 466 566 666 25 4 35 4 45 4 Estimated averages Z* Isatis
a weak zone of higher recoverability e’ (Z*: 106.54 ÷ 123.02 kg/tmat.; 106.75 ÷ 121.49 kg/tmat.)
(see Figure 8) , which fades out at 10 m [7].
Centres of lower ash content AO correspond to the zones of increased carbon content Corg. (see
Figures 5 ÷ 6) and increased recoverability e’ (see Figures 7 ÷ 8), and vice versa [7].
Maximum estimated averages Z* Minimum estimated averages Z* of recoverability e’ of recoverability e’
1 m 192.94 ÷ 224.65 [kg/tmat.] 55.54 ÷ 87.25 [kg/tmat.] 2 m 183.69 ÷ 210.28 [kg/tmat.] 68.46 ÷ 95.06 [kg/tmat.] 3 m 158.84 ÷ 182.81 [kg/tmat.] 54.94 ÷ 78.92 [kg/tmat.] 4 m 150.13 ÷ 176.24 [kg/tmat.] 36.96 ÷ 63.08 [kg/tmat.] 5 m 136.16 ÷ 163.82 [kg/tmat.] 16.30 ÷ 43.96 [kg/tmat.] 6 m 125.59 ÷ 150.67 [kg/tmat.] 16.88 ÷ 41.97 [kg/tmat.] 7 m 123.02 ÷ 147.74 [kg/tmat.] 15.90 ÷ 40.62 [kg/tmat.] 8 m 121.49 ÷ 143.60 [kg/tmat.] 25.69 ÷ 47.79 [kg/tmat.] 9 m 77.26 ÷ 87.85 [kg/tmat.] 31.40 ÷ 41.99 [kg/tmat.] 10 m 73.60 ÷ 82.99 [kg/tmat.] 32.90 ÷ 42.29 [kg/tmat.]
The ranges of maximum averages Z* of recoverability e’ show a strong tendency for this parameter to decrease with ash-slag heap depth (see Figures 7 ÷ 8). This observation applies to both the upper and lower limits of the averages Z*. They decrease down to a depth of 7 m, and then in the 8 ÷ 10 m interval the averages Z* increase again.
The three parameters, i.e. carbon content Corg., moisture content W and recoverability e’ show
certain regularity. Maximum averages Z* and, on the whole, minimum averages Z*, and particularly their upper limits, consistently decrease. Whereas the ranges of maximum averages Z* of ash content AO markedly increase, reaching higher values Z* in the deeper
horizons.
The values of variation coefficients V of ash-slag content Corg. (V - 38 %) and recoverability
e’ (V - 43 %) averages Z* indicate moderate and high variation of the parameters. The high variation of averages Z* is accompanied by relatively low values of standard estimation deviation σk (kriging error σk) and low values of V(11 – 12 %).
The highest averages Z* of content Corg. and recoverability e’ occur in the surface layers (1 - 2
m) and in the near-surface layers (3 - 4 m) of the analyzed waste heap. The deeper deposited layers (5 - 8 m) are characterized by markedly lower averages Z*. The lowest content Corg. and
recoverability e’ were found in the deepest horizons (9 - 10 m). It seems that the ash-slag horizon characterized by the highest recoverability e’ could be utilized by some sectors of economy (mining, power engineering).
8 CONCLUSIONS
A 3D geostatistical model representing the variation of the technological parameters of the ash-slags forming a power industry waste heap (tank A) has been developed. Thanks to this model the horizontal and vertical spatial variation of the parameters in the ash-slag heap could be accurately identified and full documentation of the identified variation, in the form of raster images of the distributions of averages Z* and standard estimation deviation σk, was produced.
Thanks to the application of geostatistics to the description of the variation in the technological parameters of the wastes (considered as an anthropogenic deposit) a full set of data valuable from the scientific, methodological and practical points of view was acquired. These important data can be very useful when work on the utilization of the deposited material is undertaken. REFERENCES
[1] Armstrong M., 1998. Basic Linear Geostatistics. Berlin: Springer.
[2] Isaaks E. H. Srivastava R. M., 1989. An Introduction to Applied Geostatistics. N.Y.: OUP.
[3] Namysłowska-Wilczyńska B., Rusak K., 2003. Geostatistics description of heavy metal content variation in soil of Olkusz region against a background of geological structure by GIS method. Mathematische Geologie, Volume 7. Mathematical Methods Applied to Geology and Mining. Mathematische Methoden in Geologie und Bergbau. CPress Verlag. Band 7, Dresden, 51-63.
[4] Namysłowska-Wilczyńska B., Pyra J., 2005. Spatial analysis of copper content in the soil-water environment of the Legnica-Głogów Copper District (in Polish). Annals of Geomatics, Vol. III, No. 4, Polish Association of Spatial Information, Warsaw, 137-147.
[5] Namysłowska-Wilczyńska B., 2006. Geostatistics – Theory and Applications (in Polish). Wrocław University of Technology Publishing House, Wrocław.
[6] Namysłowska-Wilczyńska B., 2007. Spatial analyses using geostatistical methods. 3D modelling of the Rio Blanco porphyritic copper deposit in Peru (in Polish). Annals of Geomatics, Polish Association of Spatial Information, Warsaw, Vol. V, No. 1, 91-103. [7] Namysłowska-Wilczyńska B., 2008. Geostatistical analysis of the variation in ash-slag
technological parameters for selected waste heap (in Polish). Report of the Institute of Geotechnics and Hydrotechnics at Wrocław University of Technology, series SPR No. 8/2008. Wrocław.
[8] Namysłowska-Wilczyńska B.(ed.), 2008. 3D Geostatistical Modelling and Forecasting of Precipitation Amount and Sulphate Content in Precipitation for Middle Oder Basin. Collective work – Modelling of Hydrological Processes, Wrocław University of Technology Publishing House, 35-74.
[9] Namysłowska-Wilczyńska B., 2009. 3D geostatistical modelling of parameters of Rio Blanco porphyritic copper deposit in Peru. Proceedings - Primer Seminario Internacional de Geologia para la Industria Minera, Editors: Irene Aracena, Carmen Holmgren & Romke Kuyvenhoven, GEOMIN 2009, GECAMIN, 10–12 June 2009, Antofagasta, Chile, CAPITULO 05, Geoestadistica, 301-325.
[10] Wackernagel H., 1998. Multivariate Geostatistics, An Introduction with Applications. 2nd edition, Springer‐Verlag, Berlin Heidelberg New York.
[11] Wieniewski A, Skorupska B. et al., 2009. Development of a technology of utilizing waste dump ash-slags through carbon separation by froth flotation (in Polish), Technological Initiative I Project, INFM 6656/1-12/09, Gliwice.
[12] Wieniewski A., Skorupska B., Mazurek D., 2009. Technology of utilizing waste dump ash-slags through carbon separation by froth flotation. XVIIth International Conference on Ashes in Power Industry, Zakopane.
![Figure 1. Directional variogram of organic carbon content C org. in heap ash-slags [%] 2 , with the fitted theoretical model](https://thumb-eu.123doks.com/thumbv2/5dokorg/3686754.45611/4.892.236.664.433.792/figure-directional-variogram-organic-carbon-content-fitted-theoretical.webp)
![Figure 2. Directional variogram of recoverability e’ of heap ash-slags [kg/t mat. ] 2 , with the fitted theoretical model](https://thumb-eu.123doks.com/thumbv2/5dokorg/3686754.45611/5.892.242.653.101.458/figure-directional-variogram-recoverability-slags-fitted-theoretical-model.webp)
![Figure 4. Histogram showing distribution of estimated averages Z* of heap ash-slag recoverability e’ [kg/t mat ]](https://thumb-eu.123doks.com/thumbv2/5dokorg/3686754.45611/7.892.228.561.674.965/figure-histogram-showing-distribution-estimated-averages-heap-recoverability.webp)