Lund Institute of Technology, Sweden
Department of Industrial Management and Logistics Division of Production Management
Authors: Fredrik Nilsson & Carl-Henrik Söderström
Academic Tutor: Carl-Johan Asplund Lund 2005-12-30
T
HE
F
UTURE
O
F
M
ARKETING
R
ESEARCH
Preface
We would like to thank the following persons who all have, in different ways, helped us in completing our master thesis;
Ralf Ganzenmüller, Managing Director, Jan Bjerseth, Business Unit Manager and Thomas Brorsson, Quality and Risk Manager at the marketing research company GfK Sverige for letting us write our master thesis at GfK Sverige and for giving us access to valuable information and bringing years of experience to our disposal. We would also like to thank Håkan Adolfsson of Field Work Scandinavia, Pontus Bodelsson of QuickWise, Mikael Ohlsson of TEMO, Lars Björkman of Ipsos Interactive Services, Jens N. Laugensen of Zapera, Marie Hayling of TNS-Gallup, Carl Bernström of Hermelin Nordic Research, Christer Billsten, Production Manager of GfK Sverige, and Antonio Maranon of GfK Sverige, all for participating in our survey about the evolution of OAP in Sweden.
Finally we would like to thank Carl-Johan Asplund, our Academic Tutor at Lund Institute of Technology, Division of Production Management, for assisting us throughout the entire process of completing our master thesis.
Summary
Online Access Panel (OAP) marketing research is a new method for conducting marketing research in order to create decision power. For example the decision power can be used in product development, business development and innovation. There are hardly any common practices agreed upon concerning OAP marketing research and there have been many discussions as to whether the method can be seen as representative for the entire population or not. This master thesis focuses on the evolution of OAP marketing research in Sweden. The thesis is divided into three main areas, competitors, research methodology and risks.
The theoretical contribution of this master thesis has been to establish a fuller view of the OAP marketing research industry in Sweden and to position OAP marketing research relative traditional methods. The practical contribution is to help existing and new entrants to supply knowledge via OAP:s to their clients in order to develop their businesses. A comprehensive desk survey has been conducted and additional information has been collected through a mail survey of the companies on the Swedish market that uses OAP marketing research. The identified competitors were Bloomerce, CATINÉT A/S, Field Work Scandinavia, GfK Sverige AB, Hermelin Nordic Research Ipsos Interactive Services, QuickWise, Temo, TNS-Gallup and Zapera. These companies provide the knowledge needed to help technology driven industries like ABB, Alfa Laval, Astra Zeneca, IKEA and Sony Ericsson to gain decision power for making strategic and operative decisions. During the desk survey it was found that the Swedish telephone operator Telia had set up an OAP of their own. This was an interesting finding and the future trend in OAP marketing research could be that clients insource their OAP research.
OAP marketing research is showing rapid growth. The spend on online marketing research in Sweden has increased by 433% the past four years. This method is most likely to cannibalize internally on the traditional methods Computer Assisted Telephone Interview (CATI) and Computer Assisted Personal Interview (CAPI). CATI and CAPI have both been declining since the introduction of OAP. QuickWise is the market leader on the Swedish OAP market. Their leading position may have to do with the strategic approach QuickWise applies as they follow their clients through the entire process of marketing research.
Barriers of entry are to some extent low for conducting marketing research via OAP. This may trigger new entrepreneurs to enter the market. However the requirements for adequate maintenance are high and costly if the research is to be representative. In the future product competitors, implicit competitors, indirect competitors and companies building their own OAP:s might constitute a threat for Swedish OAP marketing research companies. Therefore future studies could be focused on comparing and following up these possible threats.
Sammanfattning
Marknadsundersökningar via Online Accesspaneler (OAP) är en ny metod för att skapa beslutskraft. Denna beslutskraft kan till exempel användas vid produktutveckling, vid företagsutveckling och vid innovation. Det råder brist på allmän praxis kring hur marknadsundersökningar via OAP ska genomföras och diskussionerna har varit många kring huruvida metoden kan anses som representativ för hela populationen eller inte. Det här examensarbetet fokuserar på utvecklingen av marknadsundersökningar via OAP i Sverige. Arbetet är strukturerat i tre huvuddelar, konkurrenter, undersökningsmetodik och risker.
Det teoretiska bidraget från detta examensarbete är att ge en mer komplett helhetsbild över de företag som använder sig av OAP vid marknadsundersökningar i Sverige, samt att positionera OAP relativt traditionella metoder. Det praktiska bidraget är att hjälpa existerande och nya aktörer på marknaden att leverera kunskap till sina klienter via OAP marknadsundersökningar.
En skrivbordsundersökning genomfördes och kompletterande material samlades in via en e-postundersökning av de företag på den svenska marknaden som genomför marknadsundersökningar via OAP. De identifierade aktörerna var Bloomerce, CATINÉT A/S, Field Work Scandinavia, GfK Sverige AB, Hermelin Nordic Research Ipsos Interactive Services, QuickWise, Temo, TNS-Gallup och Zapera. Dessa företag levererar den kunskap som behövs för att teknikintensiva företag såsom t.ex. ABB, Alfa Laval, Astra Zeneca, IKEA och Sony Ericsson ska få beslutskraft rörande viktiga strategiska och operativa beslut. Vid genomförandet av skrivbordsundersökningen upptäcktes att Telia har satt upp en egen Online Accesspanel med sina egna kunder. Detta var en intressant upptäckt och det skulle kunna vara en framtida trend att kunderna börjar genomföra dessa undersökningar internt via sina egna kundregister.
Marknadsundersökningar via OAP har visat en kraftig tillväxt. Omsättningen på genomförda OAP marknadsundersökningar har de senaste fyra åren ökat med 433%. Det mest sannolikt att OAP relativt andra marknadsundersökningsmetoder kommer att kannibalisera på telefonintervjuer (CATI) och personliga intervjuer (CAPI). Både CATI och CAPI har visat en negativ trend sedan OAP började användas. QuickWise är marknadsledande på den svenska marknaden. Denna position kan bero på att de följer sina kunder genom hela marknadsundersökningsprocessen och hjälper till att implementera resultaten.
Inträdesbarriärer på OAP marknaden är i vissa avseenden låga. Detta kan innebära att nyföretagare ger sig in på marknaden. Det ställs dock krav på att man kan uppdatera sin panel på ett korrekt sätt för att marknadsundersökningarna ska kunna anses vara representativa och av hög kvalitet, vilket är kostsamt och kräver rätt kompetens. I framtiden kan även produktkonkurrenter, indirekta konkurrenter, implicita konkurrenter samt företag med interna OAP, utgöra ett hot för de traditionella marknadsundersökningsföretagen. Därför kan detta vara ett uppslag för framtida studier.
Table of Contents
1 Introduction ... 1 1.1 Background ... 1 1.2 Problem ... 2 1.2.1 Competitors ... 2 1.2.2 Research Methodology... 2 1.2.3 Risks ... 3 1.3 Purpose... 3 1.4 Limitations ... 3 1.5 Target Group ... 3 1.6 Disposition ... 4 2 Practical Method ... 7 2.1 Competitors ... 8 2.2 Research Methodology... 9 2.3 Risks ... 9 3 Theoretical Framework... 11 3.1 Competitors ... 11 3.1.1 Five Forces ... 12 3.1.2 Market Growth ... 133.1.3 Purchasing Relationship Matrix ... 13
3.2 Research Methodology... 14
3.2.1 Product Life Cycle ... 14
3.2.2 Product Portfolio Matrix... 16
3.2.3 Competitor Matrix ... 17
3.2.4 Statistical Introduction ... 17
3.2.5 Data Collection Methods ... 30
3.3 Risks ... 32
3.3.1 Risk Management Framework... 32
3.3.2 The process of Risk Management ... 34
3.3.3 The Risk Matrix... 35
3.3.4 Moral Hazard and Adverse Selection... 35
4 Results... 37
4.1 Competitors ... 37
4.1.1 A Full Service MR Company ... 37
4.1.2 National Actors ... 37
4.1.3 Conducted OAP Surveys ... 48
4.1.4 Spend on On-line Research ... 49
4.1.5 Researching the Researchers... 49
4.1.6 Market Change ... 51
4.1.7 New Entrants ... 51
4.2.1 Product Portfolio Matrix... 52
4.2.2 Method Comparison ... 52
4.2.3 Quality ... 53
4.2.4 Respondent Behavior ... 56
4.3 Risks ... 60
4.3.1 Risk Management Framework... 60
4.3.2 Risk Management Criteria ... 62
5 Analysis ... 63
5.1 Competitors ... 63
5.1.1 Five Forces ... 63
5.1.2 Market Growth ... 66
5.1.3 Sales Arguments... 67
5.1.4 OAP Marketing Research Company Development... 68
5.1.5 Panel Size ... 69
5.1.6 The Supply Chain... 70
5.2 Research Methodology... 70
5.2.1 Product Life Cycle ... 70
5.2.2 Product Portfolio Matrix... 71
5.2.3 Competitor Matrix ... 73
5.2.4 Respondent Behaviour... 74
5.3 Risks ... 76
5.3.1 Risk Management of the OAP Company ... 76
6 Conclusion ... 81 6.1 Competitors ... 81 6.2 Research Methodology... 82 6.3 Risks ... 83 6.4 Looking Forward ... 84 References ... 85 Appendix I – Wordlist ... 89
1 Introduction
Online Marketing Research is a relatively new area for conducting surveys and the area has faced a rapid expansion over the past four years. Marketing research provides information to gain knowledge in the decision making process. This knowledge is essential to companies making technological decisions. One part of Online Marketing Research is the use of Online Access Panels. If it is possible to conduct representative research via OAP:s, this could mean a major benefit for an innovative industry.
1.1 Background
In order to produce superior value and satisfaction for costumers, companies need information at almost every turn. Companies also need a large quantity of information on competitors, resellers, and other actors and forces on the market place. Increasingly, marketers are viewing information not just as an input for making better decisions but also as an important strategic asset and marketing tool. As companies are becoming more international, they need information on larger, more distant markets. As income increases and buyers become more selective, sellers need better information about how buyers respond to different products and appeals.1
Since product and market development is very costly for the technological industry, marketing research can reduce money spent significantly if the research is conducted and applied correctly. In the beginning of summer 2005 we contacted GfK Sverige and together we identified a need to look further into the area of the fast growing marketing research method of Online Access Panels (OAP) in Sweden. There is reason to believe that this relatively new area of marketing research will have significant impact on classical marketing research methods in the future due to its competitive cost and efficiency.
The Internet has opened new doors regarding the recruitment of respondents as well as the communication between marketing research institutes and survey participants. As the internet access increases throughout the world, the number of marketing researches on the internet increases. According to the world branch organization for marketing research firms, ESOMAR, the spend on OAP as a percentage of the total spend on marketing research in Sweden has increased from 3% in 2000 to 16% in 20042. The price and the short lead times Online Access Panels
brings tend to be strong incentives for different OAP marketing research companies to try to expand their market shares within the field. In the Netherlands OAP researches have been conducted for about 2-3 years more within the GfK Group than in Sweden. Therefore it is wise to investigate the Netherlands further in order to gain
1 Armstrong & Kotler (2000) p. 103
experience. One of the main issues with OAP research is the difficulty to set together a sample that is representative of the population. Fundamental research projects conducted by GfK have shown that apparently all types of recruitment tend to distort with respect to demographic factors. Each form of recruitment demonstrates different features and effects which is also true in the case of offline recruitment and OAPs.
Even though it is hard to collect information representative of the Swedish population within OAP research, old methods like telephone recruitment may not be possible to carry out in the future, due to new laws and regulations. It is also possible that certain groups cannot be reached in traditional ways in the near future. A marketing research company with a broad portfolio of methods should on one hand take into consideration that the research method of OAP might cannibalize on other methods within the portfolio. On the other hand this method might be one of the only methods competitive enough in the near future.
1.2 Problem
From discussions with marketing research professionals three interesting questions that need answers have arisen. What does the marketplace look like in the area of OAP-research in Sweden? Since marketing research via OAP is a relatively new research technique changes are taking place fast. Barriers of entry are fairly low since all you need to start up a panel is access to the internet and computer skills. In order to forecast the future one has to understand the past, i.e. sample procedure, methods used etc. What risks does a full service market research company face in the field of OAP marketing research? Components like barriers of entry, demand and core competence may affect a full service company to some extent and awareness of these issues are important for future profits. With these questions in mind the problem can be divided into three main areas, Competitors, Research Methodology, and Risks.
1.2.1 Competitors
• Which players are active within the Swedish Online Access Panel market? • How have these companies developed during the past five years?
• What has affected this development? 1.2.2 Research Methodology
• How does marketing research via OAP:s differ from traditional methods representative for the entire population?
• What requirements does OAP marketing research induce into the supply chain in order to conduct representative surveys?
• What kinds of respondents exist, do they differ in recruitment procedures and how are they verified as being willing to participate in surveys?
1.2.3 Risks
• How does Online Access Panel marketing research affect other parts of a full service marketing research company?
1.3 Purpose
The main purpose is to establish a fuller view over the situation in the field of Online Access Panel market research. A description of the actors operating in Sweden will be made. The theoretical contribution of this master thesis is to establish a holistic view of the marketing research industry and to position OAP marketing research relative to traditional methods. The practical contribution is helping existing and new entrants to supply knowledge to their clients in order to develop their businesses. Methods used for panel recruitment and sampling will be critically examined and compared. With this information the report is supposed to give better understanding of how competitive and representative OAP research is conducted. The sub purpose with this report is to produce a rigid foundation of information for taking strategic decisions within the field of OAP, thus making the report a useful source of information and a good way to get introduced into the area of Online Access Panels. This study will suggest a reasonable range of incentives in order to comprise a better panel mix.
1.4 Limitations
This master thesis studies the method of Online Access Panel marketing research only. Other methods within a market research company’s portfolio will only be studied theoretically to provide facts for comparison with Online Access Panels. Furthermore the study is limited to the Swedish marketplace. Since it is hard to compare the products of different companies we assume that each product is mainly connected to one specific marketing research method. The terms Online, CAWI and OAP are all interpreted as having more or less the same meaning. This is done because of the fact that different publications uses the terms without defining them strictly. The main area of focus on competitive methods are the direct competitors and to some extent the indirect competitors. In the conducted e-mail survey no consideration has been taken to the fact that different surveys via OAP differ in sample size.
1.5 Target Group
The primary target group for this report is decision makers of Marketing Research firms. The secondary target group is students and teachers at Lund Institute of Technology in Sweden and other individuals with a special interest in the area of marketing research. In order to avoid any confusion terms and theories will concur with common practices and standards.
1.6 Disposition
Chapter 1 – Introduction
Online Marketing Research is a relatively new area for conducting surveys and the area has faced a rapid expansion over the past four years. Marketing research provides information to gain knowledge in the decision making process. This knowledge is essential to companies making technological decisions. One part of Online Marketing Research is the use of Online Access Panels. If it is possible to conduct representative research via OAP:s, this could mean a major benefit for an innovative industry.
Chapter 2 – Practical Method
The practical method focuses on division of the problem into three main areas, competitors, research methodology, and risks. The information has primarily been gathered by interviewing research professionals and secondarily by a comprehensive desk survey covering recent publications and findings.
Chapter 3 – Theoretical Framework
The theoretical framework provides the road map necessary to fully understand, evaluate and manage the OAP market. Some statistical theories and definitions need to be briefly explained in order to fully understand the business of marketing research. The traditional marketing research methods are also explained in this chapter.
Chapter 4 – Results
This chapter continues to follow the structure presented in the practical method. Each company acting on the OAP market in Sweden will be briefly introduced and key figures concerning OAP will be presented. A method comparison is presented and statistics about internet penetration will be presented as well as publications on respondent incentives and panel recruitment.
Chapter 5 – Analysis
In this chapter the competition will be analyzed and methods will be compared to establish which methods compete with each other. A lot of publications concerning the OAP market have been published during 2005, despite this fact there is still a distinct difference in opinions and no common practice has been agreed upon. The OAP market in Sweden is relatively new but it has had great impact on traditional data collection methods. The panel maintenance and survey conduction is very important otherwise there could be a risk of lack of quality and relevancy.
Chapter 6 – Conclusion
The conclusion chapter summarizes the findings from this master thesis, and is meant to give a holistic view over the OAP market situation, research methodology and the risks of cannibalization on traditional methods. The theoretical contribution of this master thesis is to establish a holistic view of the OAP marketing research industry in Sweden and positioning OAP marketing research relative to traditional methods. The actors using OAP in Sweden have been identified and studied and the evolution of OAP marketing research in Sweden has been studied. The practical contribution is to help new entrants to supply knowledge to their clients in order to develop their businesses.
Appendices
Appendix I – Wordlist
2 Research Design and Practical Method
The design of this research has been divided into three main areas focusing on competitors, research methodology, and risks. The information has primarily been gathered by interviewing research professionals and secondarily by a comprehensive survey covering recent publications and findings. The information in the survey has been gathered via literature, interviews, the internet and an e-mail survey.
Below a detailed practical method is given in order to work as a complete road map to the master thesis. If other students were to conduct this study again the results will not differ because of the practical procedure. However time could affect some of the findings. This report will have a deductive approach combining available statistics with applicable theoretical models concerning mapping and benchmarking of the competitors and their strategies. The primary research method will be conducted as a comprehensive desk survey since this is the most time efficient way of getting introduced to any area of research. Through this survey, secondary information concerning Online Access Panels will be gathered and analysed by imposing rigorous standards of theoretical models. Secondary information in the form of a pre-study will be obtained from Ralf Ganzenmüller, Managing Director of GfK Sverige, and Jan Bjerseth, Business Unit Manager of GfK Sverige. This information includes many of the actors, some publications concerning OAP:s and company internal publications from the Netherlands. Additional primary information will then be collected via an online survey on the companies active on the Swedish OAP market. The research will be divided into three main categories; Competitors, Research Methodology and Risks. This division helps structuring the report in Competitors (external analysis) and Research Methodology (internal analysis). The category Risks uses the results from the other two categories in order to assess OAP research, draw conclusions and make suggestions for improvement.
2.1 Objectivity and Bias
The objectivity of this master thesis is restrained by the fact that this master thesis has been carried out together with GfK Sverige. The conclusions about Swedish market could be somewhat misleading since most of the identified competitors are owned multinational companies located in other countries. Some actors can have been overseen since only companies with their own OAP:s have been included. For example, Netsurvey and SIFO have not been included since no information about OAP:s could be found. The fact that two of the identified companies did not answer the e-mail survey could change the outcome of this master thesis radically. This could be due to the fact that one of these companies might be the market leader. In the e-mail survey one question was the number of conducted OAP surveys. No consideration was taken to the number of respondents involved, the quality and economical value of the different surveys.
The terms CAWI, Online and OAP have sometimes been used in order to draw conclusions about OAP:s. Some statistics does not reveal what percentage of CAWI or Online that is comprised of OAP marketing research. The category Other Quantitative Marketing Research Methods has not been further studied despite the positive trend this area has had over the past years. This positive trend could mean that other methods included in the definition has shown a great positive trend, however this trend could also derive from the lack of definition of what Other means in the ESOMAR industry studies.
The risk of internal cannibalization of OAP on other methods can be biased because of the fact that the decrease of traditional methods could be related to other factors such as for example a higher awareness of companies spend on marketing research.
2.2 Competitors
The Swedish OAP companies will be mapped out through an extensive search via the World Association of Research Professionals ESOMAR and via the Swedish branch organization SMIF. The main sources of information concerning the companies are the 2005 edition of the Directory of Research Organizations from ESOMAR, and the company listing on SMIF’s homepage. A series of searches through the search engines Google, Spray and ESOMAR on the internet will be conducted. The key words that will be used for the searches are marketing, market research and Online Access Panels. The essential information on the different companies’ websites will be carefully documented during the research process and sorted into the four categories background, panel, quality and surveys. When all of the companies have been found and studied the research process will continue by sorting all of the key figures obtained from the relevant companies via an e-mail survey. The key figures asked for will be what year the OAP was established and how many surveys that was conducted in 2001 and in 2004. Sales arguments for OAP marketing research will also be asked for in the survey (appendix II). Missing key figures will then be collected primarily by studying official figures published by ESOMAR and SMIF.
A five forces analysis on the OAP market in Sweden will be made in order to cover all aspects from buyer to supplier and from substitute research methods to potential entrants. The five forces model gives a complete framework for analyzing factors related to the market and competition. The sources of market growth on the OAP market in Sweden will be visualized with a hierarchical diagram. The success factor of the market leader will be studied by applying the purchasing relationship matrix in the analysis. After mapping and analyzing the surrounding marketplace in Sweden, focus will be shifted towards an internal view of a full service marketing research company and the internal risks it faces.
2.3 Research Methodology
Primarily the traditional marketing methods will be identified and studied in order to make comparisons later on in the research process. The mostly accepted methods will be identified by comparing relevant literature. Key employees of GfK Sverige are to be interviewed in order to obtain their experience and knowledge regarding marketing research and statistical analysis. The main criterion for finding key employees is that they possess special competence within one or more of the three categories stated above. This includes sales management, production management, risk management and statistical management. One of the salesmen of GfK Sverige will be interviewed in order to take part of experiences from different marketing research methods. This will make it possible to create a holistic view of the market situation. One of the production managers will be asked to provide figures from each method concerning costs and lead times in order to more thoroughly quantify and compare the methods. A statistician at GfK Sverige will be interviewed in order to obtain further knowledge about what is important when conducting marketing research and how to make representative surveys. These interviews will also give information in the process of choosing relevant literature.
The methods for collecting data for further analysis will be presented and investigated. The product lifecycle model will be used to ease the understanding of how OAP in Sweden could evolve. The marketing methods used will be plotted in a product portfolio matrix in order to compare marketing research methods relative to OAP, and a competitor matrix in order to visualize the present market situation among the methods. In order to conduct this investigation some statistical theory is necessary. This theory will be collected via a desk study and via the statistician mentioned above. The procedure of picking respondents for OAP surveys is one of the factors affecting the quality and relevancy of the marketing research and this will be further investigated.
2.4 Risks
According to GfK, there is reason to believe that some of the traditional methods used by market research companies in Sweden will suffer from cannibalization of OAP marketing research3. This report will evaluate and classify which methods that
may suffer from the risk of being cannibalized by OAP:s and to what extent. The results from Competitors and Research Methodologies will be applied in The Committee of Sponsoring Organizations of the Treadway Commission (COSO’s) Enterprise Risk Management Framework while evaluating OAP marketing relative traditional methods regarding risks. The framework takes on a systematic approach to manage risks. The process of risk management will be described according to the ISO standard for further understanding of the process. From Competitors and Research Methodologies,
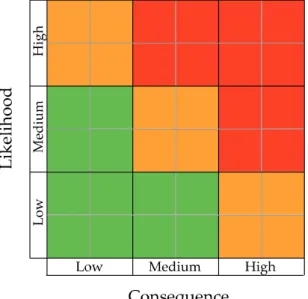
risks are divided into company external and company internal. COSO’s and ISO’s risk management processes are more or less common practice within risk management. Both quantitative and qualitative research methods will be considered and evaluated as potential victims of cannibalization in the risk analysis. Analysis of risks will be conducted with a semi-quantitative approach since it is virtually impossible to fully quantify likelihood and consequence. The different methods will be plotted in a risk matrix to visualize the potential negative impact they can have on company turnover. Furthermore, suggestions based on the research and analysis will be made for improvements concerning risk taking.
3 Theoretical Framework
The theoretical framework provides the road map necessary to fully understand, evaluate and manage the OAP market. Some statistical theories and definitions need to be briefly explained in order to fully understand the business of marketing research. The traditional marketing research methods are also explained in this chapter.
3.1 Marketing Research and Decision Quality
In order to produce value and satisfaction to customers, companies need information to make the right decisions. As more complex tools and methods are used by sellers and as the market tends to change more rapidly, managers need better, more up to date information. It is not a question of how to obtain as much information as possible, it is more a question of obtaining the necessary information. The information needed can be obtained from internal data, marketing intelligence and marketing research.4
Internal data is data already available within the company. This can be financial data from the accounting department, manufacturing reports, sales reports, information on customer demographics from the marketing division etc. It is often a relatively cheap way of accessing data, but there are some problems. Since the data was originally obtained for another purpose it may be incomplete or in the wrong form for making marketing decisions. Also, data ages quickly and it can take much effort holding the information up to date.
Marketing intelligence is systematic gathering and analysis of publicly available information about competitors and developments in marketing. The purpose of marketing intelligence is to improve strategic decision making, track competitors actions and act as an early warning system for opportunities and threats. This information can be obtained from various sources, from suppliers, customers or resellers, from competitors directly or purchased from outside suppliers of marketing intelligence.
Marketing research is used in addition to information about competitors and environmental happenings, often when there is a need for a formal study of specific situations. Marketing research is defined as the systematic design, collection, analysis and reporting of data relevant to a specific marketing situation facing an organization. The marketing research can be done company internal or it can be bought from an external provider. Even though many large companies have their own marketing research departments, outside firms are often used in order to conduct special research tasks or special studies.
3.2 Competitors
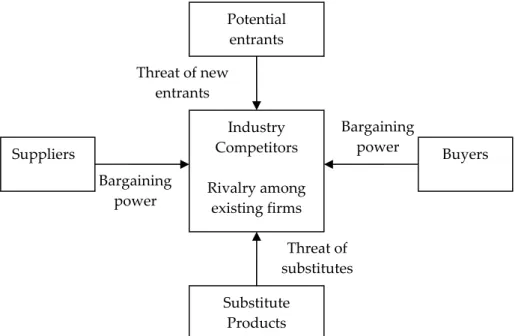
3.2.1 Five ForcesFive Forces analysis is a means of identifying the forces which affect the level of competition in an industry (figure 1). To be of most value a five forces analysis needs to be carried out by examining the influences on the competitive environment of the Strategic Business Unit (SBU).5
Figure 1 – Five Forces Model of Industry Profitability.
Competition among existing firms – Industry profitability will be low if there is intense competition between the competitors in the industry. Competitive intensity tends to be high where there are a large number of competitors, if the market is stable or declining, if fixed costs are high, and where competitive products are perceived as very similar.
Threat of new entrants – Profits will be depressed if it is easy for new competitors to enter the industry. Barriers to entry which can keep profits high include high capital investment, patents, economies of scale, restricted distribution channels and brand loyalty.
Threat of substitute products – An industry’s attractiveness is less if the product is easily substituted by alternative technology or the products from other industries.
5 Johnson & Scholes (1999) p. 115
Bargaining power Bargaining power Threat of new entrants Threat of substitutes Potential entrants Substitute Products Suppliers Industry Competitors Rivalry among existing firms Buyers
Strength of buyers – If buyers are strong, they will have the bargaining power to squeeze the profits of producers.
Strength of suppliers – If raw material suppliers, utilities or trade unions are strong, they can depress the profits to be earned in the industry.6
3.2.2 Market Growth
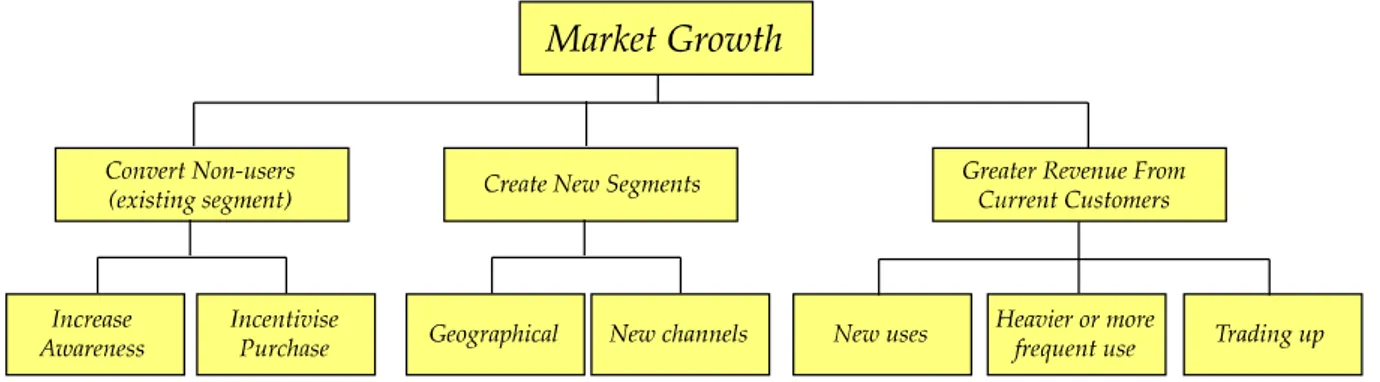
A market grows or declines in three ways (figure 2). The most obvious way is by attracting new costumers as they become aware of the product and are incentivised to purchase it. More important to the long term growth is the attraction of new market segments both nationally and internationally. 7
Figure 2 – Sources of market growth.
3.2.3 Purchasing Relationship Matrix
Differentiation is measured by the technical complexity of the product or service and the complexity of finding a replacement supplier. In marketing terminology, this is the degree to which a supplier has a sustainable differential advantage. The profitability impact is measured by the relative amount that a business unit spends with the supplier. The larger amount spent, the greater the value of negotiating a 1% price cut. The purchasing relationship matrix classifies supplier relationships into four types whereof the strategic partnership is the ideal position for the supplier (figure 3).8
6 Doyle (1994) p. 113-114 7 Ibid p. 71
Figure 3 – The purchasing relationship matrix.
3.3 Research Methodology
This chapter is essential for understanding how the quality of marketing research is affected by for example selection size, return rate, margin of error, representativeness etc. All the different methods used conventionally are also a subject of this chapter in order to later evaluate the different methods relatively OAP. A brief statistical introduction is provided in order to let the reader get acquainted with terms like normal distribution, standard error, variance, and confidence intervals.
3.3.1 Product Life Cycle
After launching a product, management wants the product to enjoy a long and profitable lifecycle. The company wants the product to earn a decent profit to cover the risk and profit involved with launching it. The Product Life Cycle (PLC) concept can describe a product class (computers), a product form (laptops), or a brand (Apple I-books). The PLC can be used by marketers to describe how products and markets work. But using the PLC concept for forecasting product performance can present some practical problems. Some of the problems can be identifying which stage of the PLC the product is in, pinpointing when the product moves into the next stage and what affects the movement. In practice it is difficult to forecast the sales at each stage, the length and the exact shape of the PLC curve. But when being used carefully the PLC can help in developing good strategies for the different stages in the life cycle.9
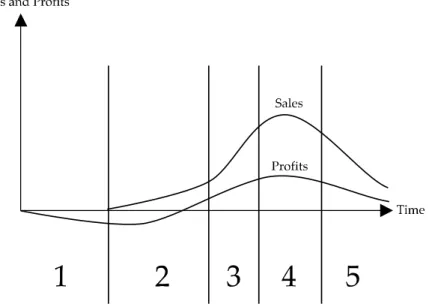
The product life cycle has five distinct stages (figure 4):
1. Product Development is when sales are zero and investment costs are mounting. 2. Introduction is the period when sales are slow and the profits are nonexistent,
due to large investments during the introduction phase. Because the market is not generally ready for product refinements at this stage, the company and its few competitors produce different basic versions of this product.
3. Growth is a period of rapid market acceptance and increasing profits. Educating the market remains a goal. Profits increase during the growth stage, as promotion costs spread over a large volume and unit costs fall. The advertising changes profile from awareness to conviction.
4. Maturity stage is when sales slows down because the product has reached acceptance among most of its potential buyers and because of increased marketing in order to defend the product against competition. In modifying the market, the company tries to increase its sales. The company also might try to modify the product by changing the quality, features or the style in order to broaden usage.
5. The decline stage is often characterized with dropping sales and prices. Sales decline for many reasons like technological advances; shift in consumer tastes and increased competition. Carrying weak products can be very costly to a firm not just in profit terms, but also in hidden cost as time consumption for management, frequent price and inventory adjustments. For these reasons companies need to pay more attention to their aging products. Management may decide to maintain in a declining market segment as other actors drop out.
3.3.2 Product Portfolio Matrix
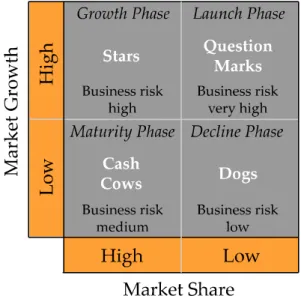
The Boston Consultancy Group (BCG) proposed one of the first ways of classifying business units, in relation to market share and market growth. The growth per share matrix permits Strategic Business Units to be examined in relation to a certain market segment and to the growth rate of that market segment (figure 5). Market growth rate is important for a Strategic Business Unit seeking to dominate a market, because it may be easier to gain dominance if the market is growing. A market that has reached its maturity phase is more likely to be stable and to contain customers loyal to their established business partners. The competition in the growth stage may be fierce so competing may include costly investments in sales and advertising.
• A Star has a high market share in a growing market.
• The Question Mark is also in a growing market, but does not have a high market share. It may be necessary to increase the market share by investing. But it is unlikely that the spending will result in sufficient cost reduction to offset such an investment.
• The Cash Cow has a high market share in a mature market.
• Dogs have low market share in static or declining markets. There may be cash drain due to inappropriate consumption of company time and resources. The original BCG analysis concentrated on the planning on cash flow requirements. For instance cash cows were supposed to create funds for innovation and development of question marks and stars.10
Figure 5 – The original Boston Consulting Group Matrix
3.3.3 Competitor Matrix
The competitor matrix describes four categories of competitors (figure 6). Direct competitors are those offering similar products and service to the same costumers, e.g. two steel companies selling to the construction market are direct competitors. Product competitors sell the same products to different costumer groups, a steel business focusing on the car industry does not compete directly with a company selling steel to the production industry. Indirect competitors sell different products to the same industry, steel and concrete are different products that might be highly competitive since the products can substitute one and other in construction. Implicit competitors are a bit more complex. For intake a family might see a holiday, a new car or a home improvement as three competitive alternatives for their limited family budget.11
Figure 6 – Types of competitors.
3.3.4 Statistical Introduction
3.3.4.1 Reliability
Reliability refers to the probability that, if the measures used in a specific survey was to be replicated, the same results would be obtained again. However it is likely to suppose that absolute coincidence will not occur. Therefore specified limits in the form of correlation coefficients can be used to determine the degree of reliability. 12
11 Doyle (1994) p. 119 12 Chisnall (2001) p. 38-39
Reliability is a measurement of to what extent random error occurs in the measurements.13 I.e. reliability refers to the stability and consistency of results from
research. Reliability is a necessary but not sufficient condition for validity and it is generally more difficult to resolve validity than reliability.1415
Three methods of estimating the reliability of measurements are test-retest, alternative forms and split-half.16 The test-retest method is used to assess stability over time. This
is done by using the same instrument and the same respondents at two points in time and correlating the results. The problems of the test-retest method are similar to the ones of pretest-posttest. The first test might well affect the respondents’ awareness of the topic in the second measurement if the second test I held too soon after the first one. The likelihood of true change in attitude, as opposed to random change, increases with time. Hence, a very short interval between test and retest will bias the reliability estimate upwards while a longer interval has the opposite effect.17 The
alternative forms method involves the usage of two instruments for measurement, assumed to be equal. These instruments are applied to the same sample and the results are correlated. The split-half method divides the sample into two matched halves, applying the alternative research techniques and correlating the responses.18
3.3.4.2 Validity
Validity refers to how well a specific research method measures what it claims to measure. Four methods for estimating validity are construct validity, content validity, concurrent validity and predictive validity. Construct validity requires understanding of the theoretical principles underlying the measurements derived from specific research. Content validity refers to the appropriateness of the research measure used; this logical approach can assess whether the full range of attributes relevant to the research survey. Concurrent validity involves comparing results from different types of survey methodologies, for example one existing and the other a proposed new approach using novel techniques. Provided the surveys are done under similar conditions the results can be correlated to establish the concurrent validity of the new research methodology. Finally, predictive validity relates to how well a research measure can predict something in the future.19
13 Kumar et al. (1999) p. 294 14 Chisnall (2001) p. 38-39 15 Kumar et al. (1999) p. 294 16 Chisnall (2001) p. 39 17 Kumar et al. (1999) p. 294 18 Chisnall (2001) p. 39 19 Ibid p. 39
3.3.4.3 Relevancy
For instance, the relevancy of a scale refers to how meaningful it is to apply the scale to measure a construct. Mathematically it is represented as the product of reliability and validity. If reliability and validity are measured in terms of correlation coefficients, the implications are as follows. The relevance of a scale can vary from 0 (no relevance) to 1 (complete relevance). If either reliability or validity is low, the scale will possess little relevance. Both reliability and validity are necessary for scale relevance.20
3.3.4.4 Sampling Size
Since it is not possible to calculate the random error when using a non probability sampling method, other criteria have to be set up in order to decide the sampling size. When probability sampling or methods being considered as probability sampling are applied there is a tested apparatus for deciding the sampling size. Briefly, the method is launched by deciding the desirable precision for the survey. The precision can be expressed in terms of confidence level and confidence interval. The necessary sampling size often rises as the demands for a higher confidence level, as well as for a lower confidence interval, is desired. Since a combination of variables often raises the requirements considerably for having a larger sampling size, the most important variable is used for setting the sampling size. The precision of the estimates can be set by deciding how broad the confidence interval should be and how high the degree of significance should be. The cost of the survey normally rises with higher demands of precision. Therefore the precisions demands should not be set higher than necessary. A common strategy is to pick the most important variable and use that variable to set the criterions of other variables within the survey.21
3.3.4.5 Sub Groups
When comprising sub groups it is important to put care and effort in the sampling procedure. If the sample is not representative for the target population, no general conclusions can be drawn about the target population. The first step in the sampling procedure is to identify the target population. After that it is important to control how representative the selection is. The procedure continues by selecting relevant sampling methods and then by choosing an appropriate sampling size.
20 Kumar et al. (1999) p. 295
The sampling size depends on different factors;
1. The confidence level decides how well the results represent the target population. If a confidence level of 0.95 is applied this means that 95 of 100 results will be within the confidence interval.
2. The margin of error is a measure of the uncertainty introduced when the entire target population is not questioned. If everybody is not asked the results will vary depending on which respondents that are being included in the sampling procedure.
3. The number of and consistence of the sub-groups is very important to define and make restrictions for. For a certain group sorted by e.g. gender, age and geographical localization, each sub-group should consist of at least 50 respondents. There is a role of thumb that says that the number of respondents in each subgroup should be at least 50, but 30 is mentioned just as often. It is very hard to exactly decide the exact amount of required respondents from time to time, since there are many parameters affecting the sampling size. 22
Hence sampling size, margin of error and confidence level are three important variables in terms of sampling. This is clarified by the following two statements; • The larger the selection, the higher the confidence level at a given margin of error. • The larger the selection, the smaller the margin of error at a certain confidence
level.
3.3.4.6 Sampling Paradox
If the selection is homogenous considering the number of different opinions, a smaller amount can be interviewed. If the sampling size constitutes less than 5% of the target population a rule of thumb says that no considerations about the size of the target population have to be taken. When the sampling size exceeds 5% the sampling size will be affected by the population size. The so called sampling paradox is an expression that says that the size of the population is often not very important when sampling size is established. The paradox means that the sampling size doesn’t have to be proportional in comparing surveys including two populations of different size. This depends on the fact that when the sampling size is small compared to the population, it is the absolute size of the selection that affects the precision of the results.23
22 Christensson et al. (2001) p. 119-121 23 Ibid p. 122
3.3.4.7 Large Sample Case
The rule or theorem that a large number of items chosen at random from a population will, on the average, have the characteristics of the population. The law of large numbers is also called Bernoulliʹs law.24
3.3.4.8 Normal Distribution
The properties of the normal curve were first identified in the eighteenth century, when it was observed that repeated samplings of the same population showed remarkable regularity in their distributions. The sampling measurements formed a bell shaped distribution, which was symmetrical and extending indefinitely in both directions (figure 7). 25
Figure 7 – Normal Distribution Curve
A normal distribution in a variate X with mean µ and variance σ is a statistic distribution with probability function on the domain (formula 1).
π
σ
σ µ 2 ) ( ) 2 ( 2 2 ) (− − = x e x PFormula 1 – The Probability Function
A variate is a generalization of the concept of a random variable that is defined without reference to a particular type of probabilistic experiment. It is defined as the set of all random variables that obey a given probabilistic law. 26 It is common
practice to denote a variate with a capital letter most commonly X. The set of all values that X can take is then called the range, denoted RX. Specific elements in the
range of X are called quantiles and denoted x, and the probability that a variate X assumes the value x is denoted P(X=x). 27
24 Answers.com (2005) 25 Chisnall (2001) p. 75-76 26 MathWorld (2005) [1] 27 Ibid [2]
The quantity commonly referred to as the mean of a set of values is the arithmetic mean also called the un-weighed average (formula 2).
∑
=
n i ix
n
x
1
Formula 2 – MeanFor a single variate X having a distribution P(x) with known population mean , the population variance var(X), commonly also written σ2, where x is the population
mean and (X) denotes the expectation value of X. For a discrete distribution with N possible values of xi, the population variance is therefore (formula 3):
∑
= − = n i i i x x x P 1 2 2 ( )( ) σFormula 3 – Variance of Discrete Distribution
Whereas for a continuous distribution, it is given by (formula 4):
∫
−= P x x x 2dx
2 ( )( )
σ
Formula 4 – Variance of Continuous Distribution
The arithmetic mean is still most the widely used measure of absolute dispersion of a distribution. It is important to note that because standard deviation measures dispersion in terms of units sampled, it has limited use for comparative purposes. Because of this limitation, standard error which is expressed as a percentage is valuable.28
3.3.4.9 Confidence Interval
A Confidence Interval is range of values constructed around a point estimate that makes it possible to state that an interval contains the population parameter between its upper and lower confidence limits. The most frequently used confidence interval is the 95% confidence interval. This can be interpreted as there is only a 5% chance that the sample is so extreme that the 95% confidence interval calculated will not cover the population mean.29
28 Chisnall (2001) p. 77 29 Mori (2005)
The confidence level reflects the certitude that the answers of the sample truly reflect the answers of the total population. Most often, a 95% confidence level is sufficient for making business decisions. When the research is performed at a 95% confidence level with a 2% confidence interval, the results reflect between 93% and 97% the true answers of the total population. A small confidence interval is more reliable than a large confidence interval. The sample size depends on the size of the target population and the homogeneity of the market. When researching several market segments with similar characteristics, the sample size may be determined for the overall target market population. When researching several distinctive market segments, findings cannot be lumped together and stratified sampling needs to be used. Stratified sampling determines the sample size for each market segment separately. Hence, the overall sample size for a study with distinctive market segments is much larger than for homogeneous segments. 30
3.3.4.10 Margin of Error
The results within a survey can always be proven to be adequate from a statistical point of view, depending on the magnitude of the margin of error (formula 5). Calculating the margin of error always requires probability sampling.
Margin of error =
n p p k×± (1− )× Formula 5 – Margin of error
k = is a confidence interval constant that can be founds in statistical tables for different kinds of confidence levels. A 95% confidence level has a constant k = 1.96 and a 99% confidence degree has a k=2.58.
p = the share of positives (1-p) = the share of negatives n = selection size
K represents the confidence level, p*(1-p) stands for the variation in the target population and n for the selection size. This requires that the selection size doesn’t exceed 5% of the target population. If the selection exceeds 5% a correction factor should be used (formula 6).
Correction factor = 1 − − N n N
Formula 6 – Correction factor
N = size of the target population n = selection size
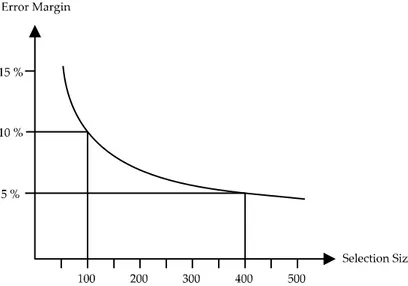
This factor is multiplied with the margin of error. When n is equal to N the correction factor becomes 0 which is correct because a total surveys margin or error is equal to zero. Normally the margin of error is largest when a variable is situated around 50% and smallest around 0% and 100%, e.g. for party votes. The margin of error varies with the selection size (figure 8). The example below explains how the margin of error affects the selection size.31
Figure 8 – How the error margin affects the selection size.
Example. Suggest that you have a selection of 100 respondents in a survey where you get a result that shows that 50% of the customers prefer a certain product. Since the margin of error is +/- 10%. In this case with a confidence level of 0.95, this would mean that in 95 cases of 100 you would get a result within the interval 40-60%. If you have bad luck you would in 5 of 100 cases get a result outside the margin of error.
3.3.4.11 Inference Problem
In the context of market research, inference means making conclusions about a target population from the information from a smaller group of people than the whole population. The validity of this kind of investigations depends on which units that are being examined within the population and how representative they are of the target population. 32
31 Christensen et al. (2001) p. 123-127 32 Lekvall & Wahlbin (2001) p. 229-230
3.3.4.12 Frame Error
Frame errors occur when the there have been changes within what you assume is the target population and when the data base containing the target population is not updated correctly (figure 9). For instance if you want to examine students opinion of some kind, but some of the “students” that are being questioned have actually started working.
Target Population The part of the population that you wish to examine.
Data Base Population A list of respondents ordered to match the target population Gross Population The remaining list of respondents that doesn’t fulfil the
criteria of the target population at the first check.
Misfit Population The remaining list of respondents that doesn’t fulfil the criteria of the target population after the list has been double checked with the respondents.
Not Covered Population Respondents of the target population who are not included in the data base list.
Net Population Data base population minus gross population, misfit population and not covered population.
Figure 9 – Different Populations in a Survey
Some of the least accountable data base registers can reach up 30-40% in misfit and not covered population. It is very hard to discover these kinds of error sources since you would have to examine a large amount of respondent not included in the register to verify the error.33
3.3.4.13 Loss of Data
There is often reason to believe that those who don’t respond the survey would answer differently than those who respond. If a survey is being sent out to companies with just a little activity within the investigated areas, the company might find their participation of low impact which may also affect the results in a negative way. When the loss of data reaches over 60-70%, the results are often not accountable. In order to decrease the amount of loss in a survey several methods can be taken into action. The most used methods are reminders and rewards. The number of questions and the degree of difficulty of the questions are also proven to be crucial factors for the amount of data loss. It is often easier to make conclusion about the survey result if the data loss can be explained by some reason like income, interests etc. If no such differences can be found it is more likely that there is no significant difference between the responding and not responding survey participants. If the response frequency differs between different groups of interest, then these different frequencies can be used to adjust the effects of data loss.34
3.3.4.14 Respondent Substitution
It is very important to see to that respondent substitutes are being carefully selected. Suppose that an amount of possible respondents has been chosen as interesting for a certain survey and some are not possible to reach. Therefore other respondents are being contacted. If the survey is primarily made during the evening maybe people that practice certain activities during evenings will not respond. If these respondents are substituted by people that do not practice these kinds of activities, then the “evening people” will be underrepresented in the survey.35
3.3.4.15 Probability Sampling
If a probability selection is applied to a marketing research the risk of inference problem is possible to calculate. If a probability selection is not applied it is only possible to make qualitative risk estimation. In order to carry trough the probability selection there has to be knowledge about which probability each unit of the population has to be included in the survey.36 It is important that as many as possible
of the randomly selected respondents are interviewed in order to maintain the statistical validity of the sample.37 Different methods of probability sampling are,
simple random, systematic random, stratified random, cluster, multi-stage, replicated, master, and multi-phase sampling.
34 Lekvall & Wahlbin(2001) p. 232-237 35 Lekvall & Wahlbin (1993) p. 153-162 36 Lekvall & Wahlbin (2001) p. 238 37 Chisnall (2001) p. 211
When simple random sampling is applied a confidence interval is calculated with an uncertainty margin that has the same size on both sides of the sample. Thus all units within the selection frame have the same probability of being selected. The higher the degree of confidence being used the lower the uncertainty.38
Systematic random sampling means that all of the possible respondents are sorted after each other in some way. The selection is made by choosing respondents by a selected interval, for instance every tenth or seventh. The start number is then randomly selected. The systematic random is meant to resemble simple random and is often a relevant approximation. One of the risks with this method is if there is a certain period among the possible respondents that consigns with the selection interval. This risk can however be decreased by changing the start point several times during the selection process.39
Stratified random sampling is a technique used in sampling, to ensure that the sample is representative in terms of the factors used for stratification. The population is first divided into a number of sub-groups or Strata, e.g. by geographical area. The required respondents are then sampled from each stratum.40
Cluster Sampling is also a systematic random method where you examine all of the units within selected clusters. For instance if you make a simple random sampling where you get a selection of schools or clusters, instead of conducting the selection process on all of the children in all of the schools.41
Multi-stage sampling means that simple random sampling is being applied several times in order to decrease the work load. For instance if you wish to make a survey over students habits you can first make a simple random sampling to get a number of schools then a simple random sampling to get different grades within the schools etc. This is made instead of, for instance, picking students from one hughe register over every student in the schools all over a country.42
38 Lekvall & Wahlbin (2001) p. 240 39 Ibid p. 244
40 BMRA (2005) [1]
41 Lekvall & Wahlbin (2001) p. 244 42 Ibid p. 244
The method of replicated sampling uses small sub-samples instead of one large sample from a universe, each being selected using the same method, at a random of the population. One of the advantages of this method is the ease of how standard errors can be calculated. Another major advantage lies in the valuable comparison that can be made between the different sub-samples while some interesting controlled experimentation could be introduced. Source of bias is easier to detect by comparing the different sub-samples. 43
Where there is likely to be repeated sampling of static population, it is useful to construct a master sample at random from which sub-samples, chosen at random, can be taken as required. Multi-phase sampling uses the former method of master sampling to distinct types of sampling units, e.g. towns, polling, districts, wards, individuals. These units are sampled at different stages until a final sampling unit, e.g. at the individual level is defined. With multi phase sampling techniques the same type of sampling is involved in each phase, but some are asked to give more information than others. 44
3.3.4.16 Non-probability Sampling
With non-probability sampling, individual units in the population do not have a chance of selection. Sometimes non-probability sampling is referred to as judgement or purposive sampling. When judgement samples are regarded as indicators of the over all quality of a batch or a consignment; for example, an expert may take a small amount of wheat from the top of a large batch in order to check its quality. It would in this case be physically impossible to select a random sample from somewhere inside the heap. But the experts approach is rendered acceptable because he/she may be presumed to have special knowledge of the general characteristics of the particular variety of wheat. Hence, a small judgement sample may be taken as a reliable indicator of its overall quality.45 Even if it is possible to make risk and
uncertainty calculations of the probability selection it is not always being used. Sometimes it is too difficult and expensive to make a correct probability selection. The inference error, which can be calculated if probability sampling is applied, is far from the only error that can occur within a survey. Therefore it can sometimes be highly motivated to select other methods like non probability sampling methods.46
There are different kinds of non-probability sampling, quota sampling, sequential sampling and judgement sampling.
43 Chisnall, Peter (2001) p. 111-113 44 Ibid p. 110-111
45 Ibid p. 111
Quota sampling means that certain parameters are set up in order to resemble the composition in the target population. The parameters can contain demographic information like number of persons from each sex, number of children etc. This method can be used when the demographic conditions highly affects the areas that are being investigated, which also keeps the random variation on a low level.47
Statisticians have tended to criticize this method for its theoretical weakness, while market research companies have defended it on grounds of cost and ease of administration and execution. In some cases it may not be possible to draw a probability sample, perhaps because of lack of suitable sampling frames or because of urgency to make vital decisions. Further it has been observed that marketing research is launched for decision making where generally comparison seems to be more utilized than absolute measurement.48
Sequential sampling is being used when the target population is quite small and to the greater part unidentified. For instance if you are looking for a farmer who uses a specialized machine of a certain brand. If no register of those farmers is available farmers has to be questioned for if they or anyone they know owns this kind of machine. This method is often far from statistically correct but sometimes that’s the only way to carry out a survey.49
In some of the surveys it is more important to find rigid support for certain issues or questions than to prove certain statistics. These kinds of investigations are often of a more explorative nature. If the method of judgement sampling is being applied it is important to clarify which criteria that will “approve” the respondents. Suppose that one of the criteria for picking the respondents is turnover. Should you choose those who have the highest, most increasing or a mix that is statistically representative? Since it is not possible to calculate the random error in a judgement sampling the survey has to be evaluated for its purpose. Normally the amount of respondents is relatively small when it comes to judgement sampling. In some cases the convergent principle can be used. This principle means that answers are collected until it is estimated that further answers won’t add new information to the results.50
47 Lekvall & Wahlbin (2001) p. 246 48 Chisnall (2001) p. 111-113
49 Lekvall & Wahlbin (2001) p. 247-248 50 Lekvall & Wahlbin (1993) p. 173-174
3.3.5 Data Collection Methods
3.3.5.1 Face to Face
This fully descriptive term is to be preferred instead of the term personal interview, which may sometimes be taken to include both face to face and telephone interviews. Face to face interviewing can be conducted in-home (A product test, usually, conducted in participantsʹ homes rather than at some central location, hall, store, etc.), in the street, in a central venue, at place of work.51 The face to face interview can
be far more extensive than the other forms of interviews, as long as the respondent finds the topic interesting. The face to face interview is often related to high costs. That is why this method is often used on smaller selections. When a personal interview is conducted it is possible to discuss different topics openly in order to air a wide spectrum of opinions.52
3.3.5.2 Computer Assisted Interviewing
Computer Assisted Personal Interviewing (CAPI) is conducted face to face, usually employing laptop computers. The interviewer is prompted with the question by the computer and the appropriate response codes are keyed in directly according to the respondentʹs answers. Routing procedures use these codes to determine which question appears next. Since the data is entered directly into the computer, analyses can be produced quickly. Computer Assisted Telephone Interviewing (CATI), unlike CAPI, is conducted over the telephone rather than face to face. Computer Assisted Web Interviewing (CAWI), unlike CAPI, is conducted over the Internet rather than face to face.53
3.3.5.3 Hall Test / Mall-Intercept Survey
Hall Tests or Mall-Intercept Surveys are a cost efficient way of interviewing respondents when there is a need for the respondents to see, feel or taste a product connected with the interview. Interviewers randomly approach respondents and either interview them at that location or invite them to be interviewed in a special facility near by. Since interviewers don’t travel and respondents are plentiful, costs are low. However, mall visitors or shopping center users are not representative of the general population.54
51 BMRA (2005) [2]
52 Lekvall & Wahlbin (1993) p. 186-187 53 MRS (2005)