_____________________________________________________________________________ © 2016 Per Adman. Detta är en Open Access artikel distribuerad under CC-BY-NC som innebär att du tillåter andra att använda, sprida, göra om, modifiera och bygga vidare på ditt verk, men inte att verket används i kommersiella sammanhang. http://dx.doi.org/10.15626/sj.20163101 ISSN: 2001-9327
LEARNING POLITICAL
TOLERANCE: AN EMPIRICAL
INVESTIGATION OF CAUSES
OF TOLERANCE IN SWEDEN
Per Adman, Department of Government, Uppsala University
E-post ǀ
per.adman@statsvet.uu.se
Introduction
Political tolerance is a key democratic attitude and a basic democratic virtue. A tolerant popula-tion is believed to promote a well-funcpopula-tioning democracy at large and, in addipopula-tion, from the perspective of normative democratic theory, truly democratic citizens must refrain from denying groups they dislike their political and social rights (see, e.g. Mendus 1999). Being politically tolerant is part of fulfilling the obligations of democratic citizenship (see e.g. Petersson et al 1989).
Several studies have concluded tolerance levels to be alarmingly low (Marquart-Pyatt & Paxton 2007; Viegas 2007; Peffley & Rohrschneider 2003). Majorities often hold intolerant views, even in countries that for a long time been democratically stable and successful. Moreover
,
a
round Europe, xenophobic and right wing parties are gaining ground, and manifestations of intolerance towards immigrants, certain ethnicities, and sexual minorities seem to be increasing.SurveyJournalen | 2016:3 nr 1 3
Concerns have even been raised that – unless the development is changed – democracy may be threatened in several parts of the continent.
How to improve tolerance, then? One dominant theory concerns learning, and states that tol-erance has to be learned by participating in democratic and pluralistic arenas within political and societal environments. Since the 1950s empirical research has been testing this theory, focusing on different factors included within its theoretical realm, such as participation in educational institutions and in associational life. Mostly, it has given the theory support. As with many other political attitudes and behaviors, U.S. is the empirically most investigated country. True, some studies consider other parts of the Western world, as well as Eastern Europe, and certain coun-tries in Africa and Asia (for overviews of this research, see Widmalm & Oskarsson 2013:539– 40). But Scandinavia, and Sweden not the least, has been investigated to a very little extent, and mostly in broad and general country comparative studies (Marquart-Pyatt & Paxton 2007; Peffley & Rohrschneider 2003). Given political, social, and cultural differences it is not evident that findings in previous research are valid in Sweden. Being a stable and comparatively successful democracy for a long time, this country is also known for its political and socio-economic egalitarianism, its comprehensive welfare state and comparatively successful inte-gration policy model (see e.g., Eger 2010). In fact, Sweden ranks among the most tolerant countries in the world (Viegas 2007; Peffley & Rohrschneider 2003). On the other hand have voices been raised that intolerance is increasing, signs being the recent electoral success of the xenophobic political party Sweden Democrats (sverigedemokraterna) as well as more frequent public expressions of intolerance towards immigrants. Nonetheless it seems justified to investi-gate this country, in order to test the generalizability of the learning theories.
The purpose of this paper is to empirically test the relevance of various factors included in the learning theory, using Swedish data. The tests are conducted with quantitative methods using a survey which is particularly suitable, more precisely the Citizen Survey (conducted in 2003). It allows better and more complete investigations of the learning factors than surveys used in prior studies on Sweden (mostly World Values Survey; see in particular, Marquart-Pyatt & Paxton 2007; Peffley & Rohrschneider 2003).
The paper begins with an overview of prior research followed by a discussion of how to measure tolerance. Then a presentation takes place of the data and variables being used, as well as the analysis section. The paper ends with a concluding discussion of the findings.
Previous research
What makes an individual political tolerant, i.e. willing to grant political rights to others and even to members of groups she or he strongly opposes? This is a non-trivial question, according to tolerance researchers, as citizen’s natural state actually is to be intolerant. Our psychological dispositions are more or less prone to be suspicious to strangers and to be sensible to possibly threatening situations and groups (see, in particular, Sniderman 1975). What, then, makes us prepared to overcome our basic dispositions and allow our antagonists to hold political meet-ings, arrange demonstrations, etc.? Some kind of external influence is needed, according to
4 2016:3 nr 1| SurveyJournalen
learning theories of tolerance, as this attitude is a cognitively advanced phenomenon and there-fore has to be learnt, (see e.g., Sullivan et al 1981). Prior research mentions at least three different ways – or learning mechanisms – in which such processes can occur (for an overview, see Marquart-Pyatt & Paxton 2007). Firstly, tolerance can be learned through contact with di-verse groups. The idea is in line with the classical contact hypothesis, which originally con-cerned racial prejudice (Allport 1954). It assumes that various kinds of social contact – e.g. between members of various ethnic groups, involving experiences with different kind of people and with different kind of ideas – may reduce such prejudice. Secondly, tolerance can increase through experiences with institutions which function in a more or less democratic way. Then democratic socialization may occur, with democratic norms being transmitted, one typically mentioned setting being educational institutions (see e.g., Weil 1989). Thirdly, tolerance can be learnt through direct experience, i.e. using one’s civil liberties by being politically active oneself (Peffley & Rohrschneider 2003). Individuals who practice their civil liberties should be more convinced that exercising one’s political rights is something good and therefore also more prone to allow others – including one’s opponents – to perform such activities.
These three learning mechanisms do of course not exclude each other. In fact, they may take place more or less simultaneously and in the same environments. One important example is educational institutions, which can function both as socializing democratic settings and as en-vironments where one may meet people of different opinions and ethnicities. Here I will not separate in detail between the different mechanisms, as the aim is primarily to empirically test the learning theory on a more general note and not to observe the mechanisms and processes involved in detail.
As pointed out above, certain parts of the learning theories have been empirically investigated rather thoroughly, in particular in the U.S. This is especially the case with education, as a posi-tive effect of higher education on tolerance is probably the most recurrent finding within this research field (for an overview, see e.g., Hazama 2010; but see e.g., Jackman & Muha 1984). Participation in other social institutions, in particular voluntary associations, also seems to in-crease tolerance (Rapp & Freitag 2014). Moreover, positive influences of living in an urban area have been found. Higher exposure to different kinds of people and ideas are the assumed causes (Wilson 1991, 1994; Sullivan et al 1982).
Working life is another crucial social environment. Unemployed individuals obviously lack access to one important everyday social environment where learning might take place (see e.g., Jahoda, Lazarsfeld & Zeisel 1971 [1933]). Accordingly, it has been suggested that unemploy-ment leads to political intolerance. Empirical research on the matter is however insufficient and results are somewhat contradictory, showing negative effects on tolerance in some countries such as the U.S. and no effects in the Scandinavian countries Denmark and Norway (Mutz & Mondak 2006, Persell et al 2001; Pedersen 1996; Gaasholt & Togeby 1995; Hernes & Knudsen 1992). It seems like the impact may be weaker in Scandinavian than in liberal welfare states (cf., Esping-Andersen 1990). Accordingly, strong effects are not expected in this case when studying Sweden.1
SurveyJournalen | 2016:3 nr 1 5
All of these mentioned institutional arenas will be investigated empirically below. This also goes for political participation, the third suggested learning mechanism. Though empirical re-search is not comprehensive, existing studies in general do to some extent support this hypothe-sis, although not in all investigated countries (Marquart-Pyatt & Paxton 2007: Peffley & Rohrschneider 2003).
Empirical research where Sweden is analyzed separately basically consists of one study, con-ducted by Peffley and Rohrschneider (2003).2 Moreover, their study only investigates two of the just mentioned learning factors, education and political participation. As for education, expected positive effects are found.3 This is not the case with political participation, for which the corre-lation with tolerance is non-significant. However, the measure used (based on the World Values Surveys) is based on not only political activities but also the respondents’ attitudes towards undertaking such activities. In line with learning theories it is participation in the institution or activity itself that affects tolerance, and the inclusion also of attitudes may cause misleading results (I will return to this discussion in the analysis section). When it comes to such social arenas as associational life, working life, and living in a city, the impacts on tolerance are un-known. In sum, then, more empirical research in the Swedish case is much called for.
Measuring political tolerance
A common definition of political tolerance is ‘the willingness to respect political rights of indi-viduals who belong to other groups’ (see, e.g., Finkel et al 1999). Often it is added that this willingness should apply not only to other groups in general but also to groups that one dislike. Hence, political demonstrations and meetings conducted by one’s political opponents – and other groups one is against – should be accepted (Sullivan et al. 1982:784).4
There are two dominating traditions as how to measure the concept in surveys. The first one is represented by Stouffer who in his seminal work (1955), focusing on the U.S. in the 1950s, examined individual’s tolerance for actions undertaken by certain ‘target groups’. More pre-cisely, people were classified as intolerant if they denied civil liberties to socialists, atheists, or communists. This approach was later criticized for being confounded by the popularity of the selected groups. Sullivan and his colleagues (1979) therefore developed the content-controlled method, in which the respondents first are asked which group they like the least and then answer whether they are willing to extend political rights to the group in question (such as arranging a political meeting). The groups are selected from all over the political spectrum. This approach has also been criticized in different ways: e.g., for only considering left-wing and right-wing extremists, and to give a too vague picture of the degree of a person’s tolerance level as only one group is selected (see e.g., Mondak & Sanders 2003:495–496).
This criticism is taken into consideration when tolerance is defined and measured here. The respondent’s willingness to allow political rights to several social groups will be investigated, and no attention is paid to whether the respondent dislikes the group or not. Furthermore, tol-erance will be regarded as a scale, ranging from full toltol-erance to full intoltol-erance, depending on the number of groups one is tolerant or intolerant against. Finally, only groups are included that
6 2016:3 nr 1| SurveyJournalen
undoubtedly should be politically respected, namely stigmatized groups and ethnic minorities. The measure is then adequate, without question, as the political rights of these groups should be accepted, and may be considered as a ‘baseline tolerance measure’ from any reasonable demo-cratic perspective.5
Data and measures
The 2003 Citizenship Survey will be used. It allows investigating more of the learning factors than data used in prior studies on Sweden (World Values Survey; see Marquart-Pyatt & Paxton 2007; Peffley & Rohrschneider 2003). Furthermore, it contains more adequate measures, e.g., when it comes to political participation. In short, to my knowledge it is the most complete source of information on political tolerance in Sweden and very suitable for testing learning theories. The survey employed face-to-face interviews with a stratified random sample of in-habitants in Sweden (age 18–80), with a total sample size of 2137 individuals.6
The measure on tolerance is based on five items. The respondents were asked whether they thought that immigrants, homosexuals, people of a different race, people with AIDS, and drug addicts, respectively, should be allowed to hold public meetings. The answers were added and summarized in an additive index variable, measuring the number of groups one is tolerant against. It was standardized so that 0 means intolerance against all groups and 1 means tolerance against all groups.7 The variable is rather skewed, with most respondents reporting tolerant atti-tudes towards these groups, although there is still some variation (the mean is 0.9 and the stand-ard deviation is 0.2)
Political participation refers to conventional forms of participation as well as more recently recognized non-parliamentary ways to bring about societal change (cf. Teorell et al 2007; Stolle et al 2005; Barnes and Kaase 1979). Although political participation has been shown to be a multidimensional concept (see, e.g., Verba & Nie 1972), for reasons of simplicity, I use an in-dex variable consisting of items on all different participation forms included in the survey (such as voting, party activities, personal contacts, protests, and political consumerism). More pre-cisely, the index is based on 19 items, and in the causal analyses below it has been logarith-mized.8
As for socializing institutions, education measures the number of years spent in combined full-time schooling and occupational training. Weak labor force attachment is coded 1 for respond-ents that are unemployed or housewife/houseman, or on disability/early retirement pension (or not working” for other reasons”), and 0 for others. Pensioner is coded as 1 for those who are retired/pensioner, and 0 for those who are employed (or are studying).9 As for the level of ur-banization, city is coded 1 for those who live in one of the three biggest cities in Sweden (Stockholm, Gothenburg, and Malmo) and 0 for others. Small town is coded 1 for those who live in smaller towns and 0 for others. Small community takes on the value 1 for those who live in smaller communities and 0 for others (the reference group is those who live in the country-side). Associational activity is based on questions about engagement in 28 different types of voluntary organizations. The measure includes a wide-ranging array of recreational
organi-SurveyJournalen | 2016:3 nr 1 7
zations, interest and identity organizations, as well as ideological organizations.10 The infor-mation was summarized with an additive index variable.
A number of control factors will be included in the analysis. Demographic factors, such as age and gender, sometimes have been found to correlate with tolerance. Younger individuals usually show higher levels of tolerance than older, and some studies have found men to be more tolerant than women (see, e.g., Bobo & Licari 1989; Golebiowska1999; but see, e.g., Togeby 1994). Female is coded 1 for women and 0 for men, and age is the respondent’s age the year the inter-view took place. Socioeconomic factors–such as class, income, and profession–have been found to correlate rather weakly with tolerance (see, e.g., Sullivan et al 1981), but the class dummy variable white-collar will still be incorporated (it is coded 1 if the respondent has a white-collar job, and 0 for a blue-collar job).11
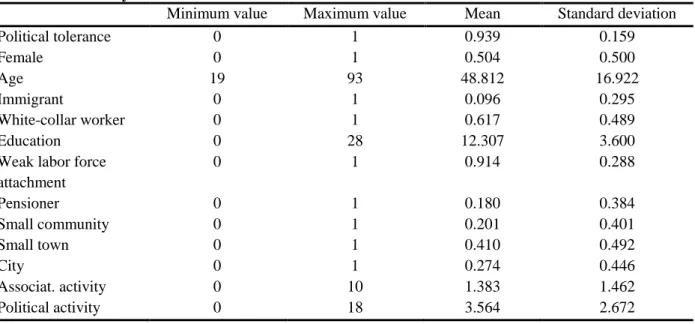
Immigrant status will also be included among the control variables. Nowadays comparatively many Swedish inhabitants are born in another country. To my knowledge, though, there exists no research on political tolerance among immigrants in Sweden. However, significant corre-lations with other political attitudes/behaviors have been discovered, in general indicating less political involvement and efficacy among immigrants than Swedish born individuals (see e.g., Adman & Strömblad 2015; Strömblad & Adman 2010; but see Myrberg 2007). Moreover, immigrants often have a more vulnerable situation in the labor market, and are in general also less active in civic associations. Therefore it seems well-motivated to include immigrant status as a control variable here.12 The variable immigrant is coded 1 for respondents who were born in another country and later migrated to Sweden, and is coded 0 for all other respondents. The means and standard deviations for all variables are shown in Table A.1 in the Appendix.
Findings
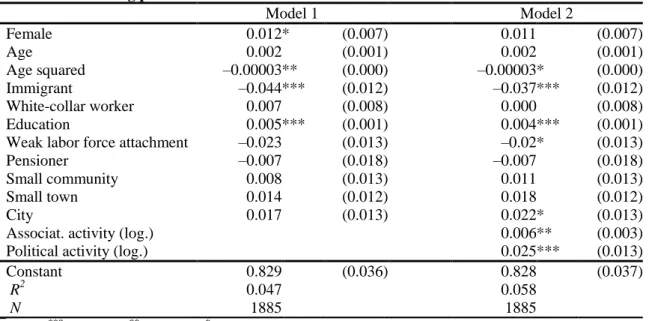
The analyses are presented in table 1. In the first model, not-so-easily changed institutional vari-ables are included – i.e. education, labor force attachment and living place (small community, small town, city, or living in the countryside) – together with the control variables (gender, age, immigrant status, and class). As for education and labor force attachment, the results are in line with the learning theories: higher education, as well as being part of the labor market, seems to have positive impact on tolerance. The coefficient for education is statistically significant on the .01 level. Substantially, e.g., a seven year increase in education is estimated to cause a 3.5 per-centage units increase in tolerance, which seems like a rather noticeable change considering the quite low variance in tolerance (the standard deviation is 0.16). When it comes to labor force attachment, individuals who for the moment are not part of the labor force on average score 2.3 percentage units lower on the tolerance scale, controlling for the other factors in the model (however, this effect is significant on the .10 level only). The exception among the learning factors included in the first model is living place, where the signs of the coefficients for the dummies are of the expected kind but no significant effects are discovered. As for living in a city, though, a statistically significant effect – although only on the 0.10 level – is actually re-ported in model 2 (where political and associational activities are added as controls); individuals living in a city then score 2.2 percentage units higher on the tolerance index than those who live
8 2016:3 nr 1| SurveyJournalen
on the countryside. In sum then, though it is not a clear-cut case, living place may affect toler-ance to some extent.
Table 1: Predicting political tolerance.
Model 1 Model 2 Female 0.012 * (0.007) 0.011 (0.007) Age 0.002 (0.001) 0.002 (0.001) Age squared –0.00003 ** (0.000) –0.00003 * (0.000) Immigrant –0.044 *** (0.012) –0.037 *** (0.012) White-collar worker 0.007 (0.008) 0.000 (0.008) Education 0.005 *** (0.001) 0.004 *** (0.001)
Weak labor force attachment –0.023 (0.013) –0.02 * (0.013)
Pensioner –0.007 (0.018) –0.007 (0.018)
Small community 0.008 (0.013) 0.011 (0.013)
Small town 0.014 (0.012) 0.018 (0.012)
City 0.017 (0.013) 0.022 * (0.013)
Associat. activity (log.) 0.006 ** (0.003)
Political activity (log.) 0.025 *** (0.013)
Constant 0.829 (0.036) 0.828 (0.037)
R2 0.047 0.058
N 1885 1885
Note: ***p < 0.01,**p < 0.05,*p < 0.10.Entries are ordinary least-squares estimates with standard errors in parentheses. R2 here refers to adjusted R2. The sample is weighted to be representative of people living in Sweden. The dependent variable political tolerance runs from 0 (no group is politi-cally tolerated) to 1 (all five groups are politipoliti-cally tolerated).
In model 2, associational and political activities are added. Here statistically and significant effects are discovered in both cases, on the .05 and the .01 levels respectively. Both variables have been logarithmized, and consequently the coefficients are somewhat difficult to interpret substantially. Further calculations however show that both effects are of substantial sizes, in particular when it comes to political participation.13 In line with the learning theories, more in-volvement in politics and in associational life indeed seems to lead to more tolerance. More-over, the findings support the suspicion concerning political participation (mentioned above), that limited support for the impact of this factor in prior Swedish studies might be due to the merging of political activities and attitudes towards political activities, in the measures on political participation. In line with the learning theories, the results here indeed show that par-ticipating in political acts itself affects tolerance (effects of attitudes towards political acts could however not be investigated here).
It should be added that the findings seem robust, in the sense that they remain also after con-trolling for a number of further factors of different kinds (both of a more background character as well as other attitude/behavioral factors; analyses not shown). The exception here is labor force attachment, where the coefficient is substantially reduced and nonsignificant when con-trolling especially for social trust. Arguably, though, this points not to a spurious effect but to that weak labor force attachment reduces trust in other people, which in turn has a negative in-fluence on tolerance.14 Hence, contrary to prior Danish and Norwegian studies, being outside of the labor market here seems to increase intolerance.
SurveyJournalen | 2016:3 nr 1 9
Admittedly, there are competing theories on the causes of tolerance which were not possible to measure with the data at hand. One example is the impact of perceived threat, a factor that may make us hesitate to involve in certain institutions and activities (e.g., if we perceive these en-vironments and acts as potentially physically threatening), and also may reduce tolerance levels (cf., Sullivan & Transue 1999), hence potentially making the findings reported above spurious. Moreover, there might be basic psychological dispositions that have an impact both on our ten-dency to be active in these institutions as well as on our ability to tolerate people who are differ-ent from our selves.15 Only future studies, including measures on these other factors, can show exactly how much the inclusion of these other factors would affect the findings reported here. Finally, a few words about the control factors’ coefficients in table 1. Model 1 points to women scoring somewhat higher on the tolerance scale than men (1.2 percentage units), when con-trolling for the other factors in the model. Substantially, this must be considered as a small difference, and it is significant on the 0.10 level only (further analyses shows that it is not ro-bust).16 The coefficients for age are not so easy to interpret, but calculations of estimated values (not shown) indicate that the middle aged are the most tolerant.
As for the immigrant variable, a substantially and statistically significant effect is found in Model 1. The coefficient is negative which means that immigrants score 4.4 percentage units lower on the tolerance scale than individuals who were born in Sweden, when controlling for the other factors in the model. To some extent it is weakened in Model 2, when the associational and political activity variables are included. Apparently, its correlation with tolerance is partly mediated via these two factors; additional analyses (not shown) do confirm lower associational and political activity levels among immigrants than native born individuals, when controlling for the other factors in the model. The large share of the of the immigrant variable on tolerance effect however remains as significant, both substantially and statistically, in Model 2. Further analyses, controlling for several other political attitudes and behavior (e.g., social trust and media exposure) as well as other background factors, do not weaken the effect and, hence, do not reveal any factor working as a mechanism in the causal relationship between the immigrant variable and tolerance. I will return briefly to this topic in the concluding discussion.
Concluding discussion
Prior studies have mostly empirically supported learning theories, showing that participation in different social and political arenas in general increase tolerance. However, this research has been limited to certain parts of the world, the U.S. in particular, and Scandinavia has almost not been studied at all. Given various contextual differences, it is not obvious that the findings will be the same in social democratic welfare states like Sweden.
Here particularly useful Swedish survey data has been analyzed. The findings in general con-firm the significance of learning factors also in the Swedish case. Rather convincing support was discovered when it comes to the importance of participating in institutions such as edu-cation, working life, and associational life, as well as being politically active. Especially in the case of working life, the result is somewhat surprising, as it was expected that working life may
10 2016:3 nr 1| SurveyJournalen
have weaker impact in a Scandinavian welfare state like Sweden (although, admittedly, the re-ported effect is not so strong). The only exception is living place, as no robust and positive effect of living in a city emerged. The findings in previous international research then seem to apply to the Scandinavian welfare state of Sweden fairly well too.
Future research may benefit from including additional factors. The levels of explained variance were low in the analyses – something this study shares with prior international reports – and there seems to be many unknown causal factors involved. For instance, paying more attention to psychological factors (cf. the big five; Oskarsson & Widmalm 2014; Ekehammar & Akrami 2007) seems like a promising route for future research, something the data at hand did not allow. The interaction between learning factors and psychological factors may also be interest-ing to investigate: perhaps certain social or political arenas have a particularly strong impact on tolerance among individuals with some specific psychological dispositions? Combining these two research traditions arguably has the potential to develop our understanding of tolerance and its causes.
A final note: The lower levels of tolerance among immigrants than among Swedish born indi-viduals also call for further investigation. This difference came across as rather pronounced and persistent, and the inclusion of learning factors did only affect it to a modest degree. Do these levels differ depending on the democratic or non-democratic traditions of the country where the immigrant was born? Does tolerance change over the years living in Sweden, i.e. does some kind of ‘resocialization’ take place (for a similar approach concerning political trust, see Adman & Strömblad 2015)? Future studies are indeed called for, regarding these issues.
Notes
1
Another theoretical perspective focuses on the impact of feeling threatened. Individuals who judge certain groups as threatening more easily become intolerant towards these groups, in order to reduce the feeling of threat (for an overview, see Marquart-Pyatt & Paxton 2007). Hard com-petition on the labor market and a minority becoming more successful is one possible ‘threat scenario’ (Hazama 2010:5). Hence, perceived threat is a competing mechanism possibly in-volved in the relationship between unemployment and tolerance.
2
Marquart-Pyatt and Paxton (2007) analyze Sweden lumped together with four other Western European countries, and, hence, it is not possible to determine the effects for Sweden separately.
3
Education is also investigated by Viegas (2007). The discovered lack of effects is however not convincing, as a rather large number of political attitudes are included in the same analysis; it is likely that education actually affects tolerance via these attitudes.
4
A closely related concept is social tolerance, i.e. whether other (disliked) groups are con-sidered as socially equal (e.g. accepted as neighbors). For delimiting reasons, this concept will not be considered here.
SurveyJournalen | 2016:3 nr 1 11
5
According to some researchers, an approach like this one does not allow a more precise estab-lishment of the level of intolerance since–they argue–this is a dichotomous question: either you are tolerant, or you are not. Establishing such a level is however not the purpose of this paper. I have undertaken the analyses presented below also using a summarized dichotomous measure on tolerance (i.e. dividing between on the one hand those who tolerate all groups and on the other hand those who are intolerant against at least one group). I have also used an index meas-ure on political tolerance where several further groups were included, such as left-wing and right-wing extremists, and racists (this index variable is much less skewed than the one being used in the analyses below). The results are very similar to what is presented here.
6
Principal investigators were Karin Borevi, Per Strömblad, and Anders Westholm at the Department of Government, Uppsala University. The fieldwork was carried out in 2002 and 2003 by professional interviewers from Statistics Sweden. The interviews averaged about 75 minutes in length. Funding was supplied by the Bank of Sweden Tercentenary Foundation and by the Government Commission of Inquiry about the Political Integration of Immigrants. The overall response rate was 56.2 percent. All analyses in this paper have been conducted with proper adjustments for the stratified sampling procedure.
7
According to principal component analysis, using the Kaiser criterion, it is without doubt reasonable to treat the items as one single dimension. The only dimension that passes the Kaiser criterion explains 56 percent of the variance, and the factor loadings vary between 0.5 – 0.8.
8
A scree-test, based on a factor analysis, in fact gives some support to treating political partici-pation as a one-dimensional phenomenon (for a similar approach, see e.g. Verba et al 1995, especially p. 544). The items included in the index are: Voting in the local elections (2002), and whether one–in order of trying to bring about improvements or to counteract deterioration in society–during the last 12 months has: Contacted a politician; Contacted an association or an organization; Contacted a civil servant on the national, local or county level; Membership in a political party; Worked in a political party; Worked in a (political) action group; Worked in another organization or association; Worn or displayed a campaign badge or sticker; Signed a petition; Participated in a public demonstration; Participated in a strike; Boycotted certain products; Deliberately bought certain products for political, ethical or environmental reasons; Donated money; Raised funds; Contacted or appeared in the media; Contacted a lawyer or judi-cial body; Participated in illegal protest activities; Participated in political meetings. However, separate analyses have also been undertaken where the different participation items are sorted according to ‘the standard multidimensional approach’ (four dimensions: voting, party activi-ties, contacting, and unconventional participation). The results (not shown) are very similar to what is being presented in Table 1.
9
Pensioner is a dummy which seems necessary to include (as most pensioners neither are working/studying or unemployed), although it is not expected to have any particular effect on tolerance in itself.
10
More precisely, are the different types of organizations the following: ’Sports club or outdoor activities club’; Youth association (e.g. scouts, youth clubs)’; Environmental organization’;
12 2016:3 nr 1| SurveyJournalen
‘Association for animal rights/protection’; ‘Peace organization’; ‘Humanitarian aid or human rights organization’; ‘Immigrant organization’; ‘Pensioners’ or retired persons’ organization’; ‘Trade union’; ‘Farmer’s organization’; ‘Business or employers’ organization’; ‘Professional organization’; ‘Consumer association’; ‘Parents’ association’; ‘Cultural, musical, dancing or theatre society’; ‘Residents’ housing or neighborhood association’; Religious or church organi-zation’; ‘Women’s organiorgani-zation’; ‘Charity or social-welfare organizations’; ‘Association for medical patients, specific illnesses or addictions’; ‘Association for disabled’; ‘Lodge or service clubs’; Investment club’; ‘Association for car-owners’; ‘Association for war victims, veterans, or ex-servicemen’; and ‘Other hobby club/society’.
11
This variable is based on the employment situation at the time when the respondent was inter-viewed. In case the respondent was not working at that moment, it refers to the most recent em-ployment.
12
Another background factor shown to affect tolerance is religious commitment (see, e.g., Viegas 2007). Although not included in the tables below, additional analyses (not reported here) show that church attendance – an often used proxy for religious commitment – does not influ-ence tolerance.
13
When moving from being active in no associations to being active in three associations (which is more or less a move from the mean subtracted by one standard deviation to the mean plus one standard deviation, see Table A.1) the expected tolerance increase amounts to two percentage units. The same operation for political participation (which in this case equals a move from participating in one political act to participating in six acts) implies an expected tolerance increase of six percentage units.
14
The relationship between trust and tolerance is most likely reciprocal, i.e., both factors affecting each other, implying that the effect of the former on the latter is over-estimated.
15
Reciprocity, or two-way causality, may also occur, in particular between – one the one hand – tolerance and – on the other hand – participation in politics and associational life. As a conse-quence, the effects shown here might be over-estimated, as it is difficult to take this problem into serious consideration with cross-sectional data, which has been used here. On the other hand, especially the effect of political participation on tolerance seems rather strong, and it is unlikely that it only goes from tolerance to participation; rather, it seems likely that some effect of political participation exists. Moreover, I have done further tests (not shown), where dis-cussing politics at home during childhood also was controlled for. This variable is considered to work as a proxy for ‘previous political engagement’ in a more general sense (in the absence of information on political tolerance at an earlier point in time, which panel data would provide). Although far from being an ideal test, it is worth noticing that the inclusion of this factor does not change the results presented here to any substantial degree.
16
Gender does not have a statistically significant effect on tolerance, when the whole sample is used. The number of respondents being analyzed is then 2015, compared to 1853 in the analyses in table 1, where only those who have values for all the variables in the models are included.
SurveyJournalen | 2016:3 nr 1 13
Appendix
Table A.1: Summary statistics.
Minimum value Maximum value Mean Standard deviation
Political tolerance 0 1 0.939 0.159 Female 0 1 0.504 0.500 Age 19 93 48.812 16.922 Immigrant 0 1 0.096 0.295 White-collar worker 0 1 0.617 0.489 Education 0 28 12.307 3.600
Weak labor force attachment 0 1 0.914 0.288 Pensioner 0 1 0.180 0.384 Small community 0 1 0.201 0.401 Small town 0 1 0.410 0.492 City 0 1 0.274 0.446 Associat. activity 0 10 1.383 1.462 Political activity 0 18 3.564 2.672 Note: n = 1885.
References
Adman, P., & P. Strömblad (2015): “Political Trust as Modest Expectations”, Nordic Journal of Migration Research, 5 (3), 107-116. DOI: https://doi.org/10.1515/njmr-2015-0007
Allport, G.W. (1954): The nature of prejudice. Cambridge, Mass.: Addison-Wesley.
Barnes, S.H., & M. Kaase et. al. (1979): Political Action: Mass Participation in Five Western Democracies. Beverly Hills: Sage.
Bobo, L., & F. C. Licari (1989): “Education and political tolerance testing the effects of cognitive sophistication and target group affect”, Public Opinion Quarterly, 53 (3), 285-308. doi: 10.1086/269154
Eger, M.A. (2010): “Even in Sweden: The effect of immigration on support for welfare state spending”, European Sociological Review, 26 (2), 203-217. DOI:10.1093/esr/jcp01
Ekehammar, B. & N. Akrami (2007): “Personality and prejudice: From Big Five personality factors to facets”, Journal of Personality, 75 (5), 899-926. DOI: 10.1111/j.1467-6494.2007.00 460.x
Esping-Andersen, G. (1990): The Three Worlds of Welfare Capitalism. Princeton, N.J.: Princeton Univ Press.
14 2016:3 nr 1| SurveyJournalen
Finkel, S.E., L. Sigelman, & S. Humphries (1999): “Democratic Values and Political Tolerance” in Measures of Political Attitudes, ed. S.E. Finkel et al. New York: Academic Press. Gaasholt, O. & L. Togeby (1995): “Interethnic Tolerance, Education, and Political Orientation. Evidence from Denmark”, Political Behavior, 17 (3), 265-285. DOI:10.1007/BF01498597 Golebiowska, E.A. (1999): “Gender gap in political tolerance”, Political Behavior, 21(1), 43-66. DOI:10.1023/A:1023396429500
Hazama, Y. (2010): “Determinants of Political Tolerance”, Discussion Paper no. 288, Institute of Developing Democracies. Chiba, Japan.
Hernes, G. & K. Knudsen (1992): ”Norwegians Attitudes Toward New Immigrants”, Acta Sociologica 35 (2), 123-139.
Jackman, M.R, & M.J. Muha (1984): “Education and intergroup attitudes”, American Sociological Review, 49 (6), 751-769.
Jahoda, M., P.F. Lazarsfeld, & H. Zeisel (1933/1971): Marienthal: The Sociography of an Unemployed Community. Chicago: Aldine Atherton.
Marquart-Pyatt, S.M. & P. Paxton (2007): “In Principle and in Practice: Learning Political Tolerance in Eastern and Western Europe”, Political behavior, 29 (1), 89-113. DOI: 10.1007/s11109-006-9017-2
Mendus, S. (1999): The Politics of Toleration: Tolerance and Intolerance in Modern Life. Edinburgh: Edinburgh University Press.
Mondak, J. J., & M.S. Sanders (2003): “Tolerance and intolerance, 1976–1998”, American Journal of Political Science, 47 (3), 492-502. DOI: 10.1111/1540-5907.00035
Mutz, D.C., & J.J. Mondak (2006): “The Workplace as a Context for Cross-Cutting Political Discourse”, The Journal of Politics, 68 (1), 140-155. DOI: 10.1111/j.1468-2508.2006.00376.x Myrberg, G. (2007): Medlemmar och medborgare. Uppsala: Acta Unversitatis Upsaliensis. Oskarsson, S. & S. Widmalm (2014): “Personality and Political Tolerance: Evidence from India and Pakistan”, Political Studies, http://onlinelibrary.wiley.com/doi/10.1111/1467-9248.12169/full
Pedersen, W. (1996): “Working-Class Boys at the Margins: Ethnic Prejudice, Cultural Capital, and Gender”, Acta Sociologica, 39 (3), 257-279. DOI: 10.1177/000169939603900301
Peffley, M. & R. Rohrschneider (2003): “Democratization and Political Tolerance in Seventeen Countries: A Multi-Level Model of Democratic Learning”, Political Research Quarterly, 56 (3), 243-257. DOI: 10.1177/106591290305600301
Persell, C.H., A. Green, & L. Gurevich (2001): “Civil Society, Economic Distress, and Social Tolerance”, Sociological Forum, 16 (2), 203-230. DOI:10.1023/A:1011048600902
Petersson, O., A. Westholm, & G. Blomberg (1989): Medborgarnas makt. Stockholm: Carlssons.
SurveyJournalen | 2016:3 nr 1 15
Rapp, C., & M. Freitag (2014): “Teaching Tolerance? Associational Diversity and Tolerance Formation”, Political Studies, 63 (5), 1031-1051. DOI: 10.1111/1467-9248.12142
Sniderman, P. A. (1975): Personality and democratic politics. Berkeley and Los Angeles: University of California Press.
Stolle, D., M. Hooghe, & M. Micheletti (2005): “Politics in the Supermarket. Political Consumerism as a Form of Political Participation”, International Political Science Review, 26 (3), 245-269. DOI: 10.1177/019251210505378
Stouffer, S. (1955): Communism, Conformity and Civil Liberties. New Brunswick: Transaction Publishers.
Strömblad, P. & P. Adman (2010): “Political integration through ethnic or nonethnic voluntary associations?”, Political Research Quarterly, 63 (4), 721-730. DOI: 10.1177/10659129093415 39
Sullivan, J.L., J. Piereson & G.E. Marcus (1979): “An alternative conceptualization of political tolerance: Illusory increases 1950s–1970s”, American Political Science Review, 73 (3), 781-794. DOI: 10.2307/1955404
Sullivan, J. L., G. E. Marcus, S. Feldman, & J. E. Piereson (1981): “The sources of political tolerance: A multivariate analysis”, American Political Science Review, 75 (1), 92-106. DOI: 10.2307/1962161
Sullivan, J., Piereson & J., Marcus, G. (1982): Political Tolerance and American Democracy. Chicago: University of Chicago Press.
Sullivan, J.L., & J.E. Transue (1999): “The psychological underpinnings of democracy: A selective review of research on political tolerance, interpersonal trust, and social capital”, Annual review of psychology, 50 (1), 625-650. DOI: 10.1146/annurev.psych.50.1.625
Teorell, J., M. Torcal & J.R. Montero (2007): ”Political Participation: Mapping the Terrain” in Citizenship and Involvement in European Democracies: A Comparative Perspective, eds J. van Deth, J.R. Montero & A. Westholm. London: Routledge.
Togeby, L. (1994): “The disappearance of a gender gap: Tolerance and liberalism in Denmark from 1971 to 1990”, Scandinavian Political Studies, 17 (1), 47-68. DOI: 10.1111/j.1467-9477.1994.tb00049.x
Verba, S. & Nie, N.H. (1972): Participation in America: Political Democracy and Social Equality. New York: Harper & Row.
Verba, S., Schlozman, K.L. & Brady, H.E. (1995): Voice and Equality: Civic Voluntarism in American Politics. Cambridge, Massachusetts: Harvard University Press.
Viegas, J. (2007): “Political and Social Tolerance” in Citizenship and Involvement in European Democracies, eds J. van Deth, J.R. Montero & A. Westholm. London: Routledge.
Weil, F. D. (1989): “The sources and structure of legitimation in western democracies: A consolidated model tested with time-series data in six countries since World War II”, American Sociological Review, 54 (5), 682-706
16 2016:3 nr 1| SurveyJournalen
Widmalm, S. & S. Oskarsson (2013): “Political Tolerance in India: Descriptions and Explan-ations from the Heartland”, Asian Survey, 53 (3), 533-558. DOI: 10.1525/as.2013.53.3. 533