Örebro University, SE-701 82 Örebro, Sweden Grevgatan 34, SE-114 53 Stockholm, Sweden
The report is available for download on www.entreprenorskapsforum.se
THE ENTREPRENEURIAL CHALLENGE -
A COMP
ARA
TIVE STUDY OF ENTREPRENEURIAL DYNAMICS IN CHINA, EUROPE AND THE US
THE ENTREPRENEURIAL CHALLENGE
- A COMPARATIVE STUDY OF ENTREPRENEURIAL DYNAMICS
Total early-stage entrepreneurial activity (TEA) Percentage of individuals aged 18-64 who are either a nascent entrepreneur or owner-manager of a new business.
Nascent entrepreneurship rate
Percentage of individuals aged 18-64 who are currently a nascent entrepreneur, i.e., actively involved in setting up a business they will own or co-own; this business has not paid salaries, wages, or any other payments to the owners for more than three months.
New business ownership rate
Percentage of individuals aged 18-64 who are currently an owner-manager of a new business, i.e., owning and managing a running business that has paid salaries, wages, or any other payments to the owners for more than three months, but not more than 42 months.
Characteristics of early-stage entrepreneurial activity Opportunity-based early-stage entrepreneurial activity Percentage of individuals involved in early-stage entrepre-neurial activity (as defined above) who claim to be purely or partly driven by opportunity as opposed to finding no other option for work. This includes taking advantage of a business opportunity or having a job but seeking better opportunity. Necessity-based early-stage entrepreneurial activity Percentage of individuals involved in early-stage entrepre-neurial activity (as defined above) who claim to be driven by necessity (having no better choice for work) as opposed to opportunity.
Improvement-driven opportunity early-stage entrepreneurial activity
Percentage of individuals involved in early-stage entre-preneurial activity (as defined above) who (1) claim to be driven by opportunity as opposed to finding no other option for work; and (2) who indicate that the main driver for being involved in this opportunity is being independent or increasing their income, rather than just maintaining their income.
High-growth expectation early-stage entrepreneurial activity: relative prevalence
Percentage of early-stage entrepreneurs (as defined above) who expect to employ at least 20 people five years from now.
New product-market-oriented early-stage entrepreneurial activity: relative prevalence
Percentage of early-stage entrepreneurs (as defined above) who report that their product or service is new to at least some customers and that not many businesses offer the same product or service.
International-oriented early-stage entrepreneurial activity: relative prevalence
Percentage of early-stage entrepreneurs (as defined above) who report that at least 25 percent of their customers are from foreign countries.
Established business ownership rate
Percentage of individuals aged 18-64 who are currently an owner-manager of an established business, i.e., owning and managing a running business that has paid salaries, wages, or any other payments to the owners for more than 42 months. Business discontinuation rate
Percentage of individuals aged 18-64 who, in the past 12 months, have discontinued a business, either by selling, shutting down, or otherwise discontinuing an owner/management rela-tionship with the business.
Note: this is NOT a measure of business failure rates. Individual attributes of a potential entrepreneur Perceived opportunities
Percentage of individuals aged 18-64 involved in any stage of entrepreneurial activity excluded who see good
opportunities to start a business in the area where they live. Perceived capabilities
Percentage of individuals aged 18-64 involved in any stage of entrepreneurial activity excluded who believe they have the required skills and knowledge to start a business.
Entrepreneurial intentions
Percentage of individuals aged 18-64 involved in any stage of entrepreneurial activity excluded who are latent entrepreneurs and who intend to start a business within three years.
Fear of failure rate
Percentage of individuals aged 18-64 involved in any stage of entrepreneurial activity excluded who report that fear of failure would prevent them from setting up a business.
THE ENTREPRENEURIAL CHALLENGE
– A COMPARATIVE STUDY OF ENTREPRENEURIAL DYNAMICS
IN CHINA, EUROPE AND THE US
The Swedish GEM-team 2016 consists of Pontus Braunerhjelm, Professor Royal Institute of Technology and Research Director Swedish Entrepreneurship Forum, Johan P Larsson, PhD Swedish Entrepreneurship Forum and Jönköping International Business School, Per Thulin, PhD Royal Institute of Technology and Swedish Entrepreneurship Forum and Ylva Skoogberg, Project Manager, Swedish Entrepreneurship Forum.The team wishes to thank the GEM global coordination team for their cooperation and support. We especially like to mention Yana Litovsky, Alicia Coduras and Francis Carmona for their efforts in providing high quality data and analysis. Finally we would like to express our gratitude to VINNOVA and the Federation of Swedish Enterprises, who has provided funding for this project.
4
© Swedish Entrepreneurship Forum, 2016 ISBN: 978-91-89301-83-2
Authors: Pontus Braunerhjelm, Johan P Larsson, Per Thulin and Ylva Skoogberg
Photo: Istockphoto
Graphic design and produktion:
Klas Håkansson, Swedish Entrepreneurship Forum Print: TMG Tabergs AB
PREFACE 7
QUICK SUMMARY – GEM 2016 IN 120 SECONDS 8
1 – GLOBAL ENTREPRENEURSHIP MONITOR – INTRODUCTION AND SUMMARY 11 2 – A CROSS-COUNTRY ANALYSIS OF ENTREPRENEURIAL ACTIVITY, AMBITION AND ATTITUDES 19
3 – INTRAPRENEURS – ENTREPRENEURIAL EMPLOYEES 41
4 – CONCLUSIONS AND SOME POLICY REFLECTIONS 47
REFERENCES 58
CONTENTS
Swedish Entrepreneurship Forum hereby presents The Entrepreneurial Challenge – A comparative study of entrepreneurial dynamics in China, Europe and the US, based on data from the Global Entrepreneurship Monitor (GEM). GEM is the most comprehensive worldwide study on entrepreneurship. Since the first survey, which covered 10 countries and was conduc-ted in 1999, the study has grown to include 181,000 respondents in 62 countries in 2015, representing over 72 percent of the world’s population and 90 percent of the world’s GDP. The launch of the global report was held at a conference in Boston in February and can be downloaded from the GEM Consortium website, www.gemconsortium.org.
GEM provides an annual and comprehensive picture of of the level, aspirations and attitudes to entrepre-neurship among the population, i.e. not only the entre-preneurs themselves. The analysis also draws attention to economic policy conditions for entrepreneurship, growth and innovation. International comparisons are made possible through extensive coordination of
methodology and wording of the questionnaires and analyses.
The Entrepreneurial Challenge examines the simila-rities and differences between the dominating econo-mic regions in terms of level of entrepreneurial activity, entrepreneurs’ ambition to grow, internationalise and to innovate, as well as the attitudes towards entrepre-neurship. We present the development over time for a large number of variables related to entrepreneur-ship. In addition, we compare entrepreneurial activity to intrapreneurial efforts undertaken by employees in already existing firms.
Pontus Braunerhjelm (editor), Johan P Larsson, Ylva Skoogberg and Per Thulin have contributed to the cur-rent report. As usual, the findings, policy recommen-dations and the analysis presented in the report repre-sent the views of the authors and is not necessarily shared by Swedish Entrepreneurship Forum. Financial support is gratefully acknowledged from Vinnova, Sweden’s innovation agency, and The Confederation of Swedish Enterprise.
PREFACE
Stockholm, June 2016 Johan Eklund
Managing Director Swedish Entrepreneurship Forum and Professor Jönköping International Business School Pontus Braunerhjelm
Professor KTH Royal Institute of Technology, Research Director Swedish Entrepreneurship Forum and Team Leader of the Swedish GEM team
• Total entrepreneurial activity (TEA) is considerably higher in the US, almost on par with China, despite being a more developed economy (referred to as innovation driven in GEM), and up to three times higher than in most other European countries and country groups.
• The lowest level of TEA is found in the large EU-economies Germany and France, and in those countries most severely affected by the aftermath of the financial crisis in 2007–2009, i.e. Portugal, Italy, Greece and Spain (PIGS-countries).
• TEA decreases with level of development and shifts from necessity- to opportunity-based as countries become richer. The latter refers to a pull-factor where an opportunity is identified that triggers a start-up, whereas necessity-based is a push-factor due to lack of alternative income possibilities. • In 2012–2015, between 70–90 percent of all
entre-preneurship is related to opportunity for the five innovation-driven economies and for three country groups (the Nordic countries, the PIGS-countries and the small EU-countries). Necessity-driven entre-preneurship has, as expected, increased in the PIGS-countries which were particularly hard hit by the economic crisis, but also in the UK and the small EU-countries.
• The earliest stage of entrepreneurship (nascent) is an indication of an experimentally organised eco-nomy – a flow of ideas continuously being tested at the market. Here the US dominates as well. With the exception of China, Sweden, being a traditional wel-fare state that is organised quite differently compa-red to the US, ranks second.
• The crisis that started in 2008 does not seem to have deprived countries of their informal investors. Instead, it increased in a number of countries bet-ween 2008 and 2011 compared to 2004-2007, and, in some cases, continued to increase in 2012–2015.
• Sweden is one of the countries with the largest share of informal investors; in fact, it has a higher share than any of the other innovation-driven countries or country groups, together with the US. Furthermore, China seem to host a large share of early-stage fun-ding individuals.
• Most countries report a gender gap in entrepreneur-ship where the share of women entrepreneurs is approximately 50 percent compared to males. The UK is the only country that has a trend-wise increase over the period 2004-2015.
• High-growth firms, or gazelles, accounts for a dis-proportionate share of new employees and conse-quently important for future growth. Anglo-Saxon countries, together with a few countries from Eastern Europe and Taiwan, are the top performers. • Germany positions itself at sixth place in terms of
hosting a large share of growth-oriented entrepre-neurs. Similarly, several of the Nordic countries, including Sweden, have moved up in the ranking of entrepreneurs expecting high-growth. These countries have also undertaken important reforms to enhance flexibility in their respective labour markets. • In eleven out of 24 countries, at least 50 percent of
the entrepreneurs consider their products or servi-ces to be new to either all or some of their custo-mers. This suggests a relatively high innovation capa-city among European entrepreneurs.
• Smaller countries could be expected to have a larger share of their customers abroad, given the limited size of their domestic markets. However, the picture is quite mixed. Even though a fairly large number of small countries are among those most internationali-sed, small PIGS-countries have a low degree of inter-nationalisation, as do the Nordic countries.
• The US is among the countries having the most internationalised entrepreneurs. In general, serving
QUICK SUMMARY
international markets signals both high ambitions and international competitiveness of a country’s early stage entrepreneurs.
• In most of the innovation-driven economies, there seem to be an increase in entrepreneurial intentions (to start a firm within a three year period) between 2004 and 2015, Sweden being the exception. France and the US are shown to have the highest levels, fol-lowed by the PIGS-countries, the small EU-countries, Sweden and the UK, whereas Germany and the Nordic countries trail behind.
• China’s trend is distinctively negative, which likely reflects that much of the previous entrepreneurship was necessity-based and a business-cycle effect. • A remarkable share, 70 percent, of Swedes claim
that they can identify good business opportunities. In China and France approximately 30 percent claim that they can identify profitable business opportu-nities. In the PIGS-countries the share has declined 2004–2007.
• A much smaller share, about 35–40 percent of the adult population, believes that they have the ability to set up and manage a firm. The exceptions are the US and the UK where the share is higher.
• Hence, there seems to be a Nordic paradox where individuals claim a high capability in identifying entrepreneurial opportunities but have much lower confidence regarding the competence to start and run firms. In US and UK the opposite pattern prevails. • Including all countries in GEM, irrespective of their stage of development, a negative correlation is reve-aled between intrapreneurship in existing firms and TEA. In other words, a low level of entrepreneurship appears to go hand-in-hand with high levels of intra-preneurship and vice versa.
• However, if we focus exclusively on the innovation-driven countries an opposite pattern emerges, i.e. entrepreneurship and intrapreneurship appear to be positively correlated.
• In almost all dimensions that measure entrepre-neurial activity, Anglo-Saxon countries are shown to outperform other countries – be it TEA, new busi-ness ownership, women’s entrepreneurship or those intending to start a business. To close the entrepre-neurial gap, in particular to the US, institutions must more clearly encourage risk, entrepreneurial endea-vour and firm growth.
• Opportunity-based TEA and expenditure on edu-cation, and R&D, are positively associated. Hence, supply of skills and interaction between universities and the business sector is important for the quality of entrepreneurship. Incentives should be designed to encourage such interactions.
• Handling regulations is always more costly for new and small firms since there is a fixed cost attached to such procedures. TRed tape mus be decreased and costs cut, i.e. through digitalised system, one stop shops, etc. One urgent issue is to facilitate participa-tion for SMEs in public procurement, preferably pai-red with procurement innovation policies.
• There is a distinct negative relationship between fear of failure and total entrepreneurial activity. Hence, it is an important task for policy-makers to reach a reasonable balance between the legitimate demands by a firm’s creditors and the obligations imposed on the individual entrepreneur.
• The intention to start a firm within three years is strongly associated with TEA three years ahead. Hence, the intention variable may be used as an early warning of the development of TEA.
1
GLOBAL ENTREPRENEURSHIP MONITOR
– INTRODUCTION AND SUMMARY
1. The global report can be downloaded from www.gemconsortium.org. 1.1 THE GLOBAL ENTREPRENEURSHIP MONITOR (GEM) – AN INTRODUCTION Why is entrepreneurship important? Because entre-preneurs are, as Schumpeter put it, “the agents of change”. The first industrial revolution was, in con-junction with institutional changes, driven by entre-preneurs, as were the second and third industrial revolutions. Today, we face an unprecedented level of global challenges that cannot be solved without the contribution of global entrepreneurship. These challenges, or development goals, must be addres-sed through close and innovative interaction among broad groups in society: incumbents, new firms, academia and policymakers. Therefore, it is criti-cally important to comprehend how entrepreneur-ship evolves, the ambitions of entrepreneurs and the attitudes towards entrepreneurial endeavours. That is what the Global Entrepreneurship Monitor accomplishes.
The 17th Global Entrepreneurship Monitor Report (GEM) was published in February 2016 and was based on data for 2015.1 Each year, the report examines
individual attitudes, activities and ambitions with respect to entrepreneurship around the world. Since the first survey, which covered 10 countries, was con-ducted in 1999, the study has grown to include 181,000 respondents in 62 countries in 2015, representing over 72 percent of the world’s population and 90 percent of the world’s GDP. This makes GEM the largest ongoing study of entrepreneurship and entrepreneurial dyna-mics in the world.
The current report focuses on entrepreneurial development among the three most important global players: China, the EU and the US More precisely, we will discuss how entrepreneurial activities, ambitions and attitudes have evolved over time in EU countries, the US and China. Part of the analysis will be narro-wed to the larger EU-countries (France, Germany, Italy and the UK), small EU countries (Belgium and the Netherlands), the Nordic countries and the PIGS -countries (Portugal, Italy, Greece and Spain), together with China and Sweden. The results will be presen-ted as weighed averages when country groups are used. We will explore how these different countries
THE ENTREPRENEURIAL CHALLENGE
12
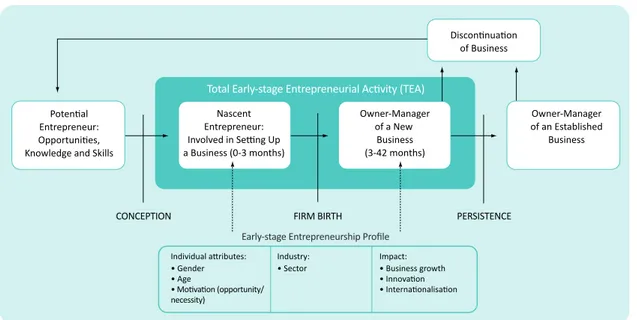
Figure 1.1: The entrepreneurial process
Figure 1.2: Characteristics and key concepts, economic development phases
and country groups compare with one another and whether there are lessons to be learned from diver-gent entrepreneurial patterns.
This introductory chapter describes the GEM model and briefly summarises the global results of the 2015 survey, and Chapter 2 presents more detailed results for various European countries, country groups, as well as China, Sweden and the US. The following Chapter 3 presents the results regarding intrapreneurship or the entrepreneurial activities of employees in incumbents. Finally, conclusions and policy recommendations are provided in Chapter 4.
THE GEM CONCEPTUAL FRAMEWORK
The GEM model is based on the idea that entrepre-neurship is key to a country’s prosperity and that this applies, albeit through different channels and in
various ways, regardless of the degree of a country’s economic development.
The objective of the model is to map the neurial process, beginning with the potential entrepre-neur, moving to the start-up of a business, then to an established business, and finally to a potential discon-tinuation of the business. The GEM differs from similar projects in that it takes the individual’s perspective on entrepreneurial activities, ambitions and attitudes2.
The GEM methodology focuses on the separate stages that characterise the entrepreneurial pro-cess (Figure 1.1). The starting point is the individual’s potential, i.e., whether an individual is considering exploiting identified opportunities and believes that he or she can start and run a firm. When the potential entrepreneur has converted perceived opportunities and capabilities into activity, the process moves to the
Potential Entrepreneur: Opportunities, Knowledge and Skills
Nascent Entrepreneur: Involved in Setting Up a Business (0-3 months) Owner-Manager of a New Business (3-42 months) Owner-Manager of an Established Business Discontinuation of Business
Total Early-stage Entrepreneurial Activity (TEA)
CONCEPTION FIRM BIRTH PERSISTENCE
Early-stage Entrepreneurship Profile Individual attributes: • Gender • Age • Motivation (opportunity/ necessity) Impact: • Business growth • Innovation • Internationalisation Industry: • Sector
From subsistence agriculture to mining of natural resources,
creation of regional scale intensive agglomerations
Increased industrialisation and economies of scale. Large companies dominate but niches in the supply chains opens for small
and medium-sized enterprises
R&D knowledge-intensive companies and growing service
sector. Greater potential for innovative entrepreneurial
activity
FACTOR-DRIVEN ECONOMIES EFFICENCY-DRIVEN ECONOMIES INNOVATION-DRIVEN ECONOMIES
Basic requirements Efficency enhancers Innovation and sophistication factors
13
Chapter 1. Global Entrepreneurship Monitor - Introduction and summary
Table 1.1: Countries by geographic region and economic development
next phase – that of the nascent entrepreneur (i.e., someone who is involved in starting a business during its first three months). The next stage is ownership and management of a new business, a period that runs from three months to 3.5 years after the start of the business. These two phases form the foundation for the measure of TEA (Total Early-stage Entrepreneurial Activity), which is a central part of the GEM survey. The GEM survey also collects data on businesses that are older than 3.5 years. These are defined as established businesses. Finally, information is gathered on the dis-continuation of businesses. This is the overall structure of the model that forms the basis for the results pre-sented in this report.
The participating countries in the survey are divi-ded by geographic region and different stages of economic development. The three different stages of development are defined as factor-driven, efficiency-driven and innovation-efficiency-driven economies. Figure 1.2 illustrates these stages and describes the characte-ristics of each category in greater detail, and Table 1.1 classifies the 62 countries that participated in the GEM study in 2015 by geographic region and stage of economic development.
1.2 SUMMARY OF THE GLOBAL GEM REPORT 2015
ENTREPRENEURIAL ATTITUDES, PERCEIVED OPPORTUNITIES, CAPABILITIES AND INTENTIONS
Promoting entrepreneurial awareness and positive attitudes towards entrepreneurship is a high priority on most countries’ policy agendas. The underlying notion is that an overall positive view of entrepre-neurship may result in more people taking the plunge into business start-ups. Consequently, the GEM survey gathers data on attitudes and entrepreneurial ambi-tions, in addition to data on entrepreneurial activi-ties. Attitudes towards entrepreneurship include an individual’s perceived ability to start a business, per-ceived business opportunities and fear of failure, all of which can be expected to influence entrepreneurial activity. Obviously, more severe consequences of fai-lure can deter an individual from exploring a perceived business opportunity.
In addition to factors at the individual level, there are contextual conditions, such as the dynamics of the labour market and other institutions (laws and regu-lations), that may affect individuals’ propensities to Factor-Driven
Economies Effi ciency-Driven Economies Innovati on-DrivenEconomies
Africa Botswana, Burkina Faso,
Cameroon, Egypt, Senegal, Tunisia
Morocco, South Africa Asia
& Oceania India, Iran, Philippines, Vietnam China, Indonesia, Kazakhstan, Lebanon, Malaysia, Thailand, Turkey
Australia, Israel, Japan, Republic of Korea, Taiwan Lati n America
& Caribbean Argenti na, Barbados, Brazil, Chile, Colombia, Ecuador, Guatemala, Mexico, Panama, Peru, Uruguay
Puerto Rico
Europe Bulgaria, Croati a, Hungary,
Latvia, Poland, Romania, Macedonia
Belgium, Estonia, Finland, Germany, Greece, Ireland, Italy, Luxembourg, Nether-lands, Norway, Portugal, Slovakia, Slovenia, Spain, Sweden, Switzerland, UK
THE ENTREPRENEURIAL CHALLENGE
14
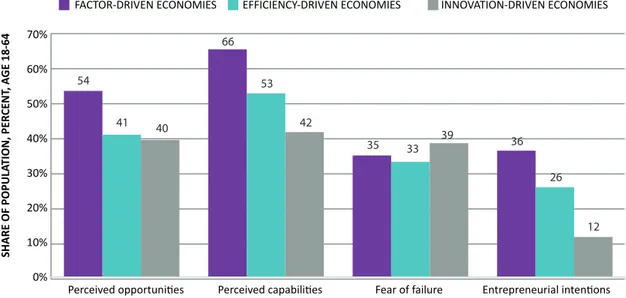
Figure 1.3: Individual attributes in the GEM economies in 2015, by phase of economic development
engage in entrepreneurial activity. Hence, a complex mix of individual, social and contextual factors under-lie individuals’ decisions to engage in entrepreneurial endeavours. GEM enables us to capture this complex-ity by providing individually based data.
As shown in Figure 1.3, there are considerable differences between countries in different stages of economic development regarding perceived entre-preneurial opportunities, individuals’ abilities to start businesses and entrepreneurial intentions. A gene-rally established pattern is that perceived opportu-nities and capabilities tend to decline as economic development increases.
The highest average levels of perceived business opportunities (54 percent) and perceived capabilities (66 percent) are found in the factor-driven countries, whereas the lowest are found in the innovation-driven countries (40 and 42 percent, respectively).
The next step in the entrepreneurial process starts when a potential entrepreneur decides that he or she intends to start a new business in the next three years; these are so-called potential entrepreneurs. Entrepreneurial intent also differs between countries in different stages of economic development, with factor-driven economies generally exhibiting signi-ficantly higher levels of entrepreneurial intent. This
can, at least partly, be explained by the fact that there are less labour market opportunities in these countries. In efficiency-driven and (especially) inno-vation-driven economies, entrepreneurial intentions are lower.
Perceived business opportunities, high confidence in one’s own capabilities and entrepreneurial inten-tions are not sufficient to lead to a high level of entre-preneurial activity. Fear of failure in entreentre-preneurial ventures may leave a large portion of potential opp-ortunities untapped. This fear is greater in innovation-driven countries than in efficiency- and factor-innovation-driven countries. It is important to note that fear of failure partly relates to the type of business a respondent intends to start, which also tends to correlate with degree of economic development. In factor-driven countries characterised by large economic inequalities, entrepreneurial intentions often focus on local, neces-sity-based entrepreneurship, with limited growth and development ambitions.
ENTREPRENEURIAL ACTIVITY (TEA) – ENTREPRE-NEURSHIP IN THE EARLY STAGES
As noted above, Total Entrepreneurial Activity (TEA) is a central part of the GEM survey. A country’s TEA is defined as the proportion of the population aged Perceived opportunities
FACTOR-DRIVEN ECONOMIES EFFICIENCY-DRIVEN ECONOMIES INNOVATION-DRIVEN ECONOMIES
Perceived capabilities Fear of failure Entrepreneurial intentions
SHARE OF POPULA TION, PER CENT , A GE 18-64 70% 60% 50% 40% 30% 20% 10% 0% 54 41 40 66 53 42 35 33 39 36 26 12
15
Chapter 1. Global Entrepreneurship Monitor - Introduction and summary
18–64 who are actively involved in starting a business in either the very early phase (nascent entrepreneur-ship, 0–3 months) or the phase that extends to 3.5 years after a company’s inception.
Table 1.2 shows TEA for all countries, categorised by development. Factor-driven economies are shown to have the highest proportion of entrepreneurial activity, with an average of 21 percent, while the correspon-ding proportion is eight percent for innovation-driven economies.
Among innovation-driven economies, the highest TEA levels are found in Canada (15 percent), Estonia (15 percent), Australia (13 percent) the United States and Israel (12 percent each), whereas the lowest levels are found in Germany and Italy (four percent). Motivational reasons
The motivational reasons for starting a business vary widely across countries. At the individual level, this is captured in the GEM model by the distinction bet-ween necessity- and opportunity-based entrepre-neurship. In the former case, the reasons for starting a business are related to limited possibilities to earn a livelihood relative to perceived business opportu-nities. Those who view entrepreneurship as an opp-ortunity rather than a necessity, are driven by the possibility to earn more money and achieve greater independence rather than the need to maintain an income. The share of necessity-based entrepreneur-ship in TEA is clearly linked to the level of economic development, with necessity-driven entrepreneur-ship decreasing as economic development increases (Table 1.2).
Necessity-driven entrepreneurship often relates to fun-damental economic factors. In developing countries, start-ups are often a consequence of a lack of jobs and undeveloped social security systems, which force people to try to acquire alternative livelihoods through entrepreneurship. As economies develop, the supply of jobs usually increases, resulting in fewer people being forced into necessity-based entrepreneurship. Factor-driven economies are characterised by the highest levels of entrepreneurial activity in the GEM study but also the highest proportion of necessity-based entre-preneurship. In 2015, the average of necessity-based entrepreneurship was 30 and 29 percent, respectively, for factor-driven and efficiency-driven economies, while the corresponding proportion for innovation-driven economies was 18 percent.
Innovation-driven economies exhibit, on average, the lowest levels of entrepreneurial activity but the highest proportion of opportunity-based entrepre-neurship. In these economies, the entrepreneur identifies and pursues an opportunity that can improve not only his or her income but also his or her degree of perceived independence. In the inn-ovation-driven countries, opportunity-driven entre-preneurship is the norm. The division between opp-ortunity- and necessity driven entrepreneurship can be seen as indicators of qualitative and quantitative entrepreneurship.
The gender gap
Through the years, GEM has shown that the early sta-ges of entrepreneurial activity among women vary considerably worldwide. These differences between countries reflect differences in culture and tradition Table 1.2: Entrepreneurial activity and motivational reasons by level of economic development
Factor-driven
Economies Effi ciency-drivenEconomies Innovati on-drivenEconomies Total Entrepreneurial Acti vity
(TEA) 21 15 8
Necessity-driven
Entrepreneurship (share of TEA) 30 29 18
Opportunity-driven
Entrepreneurship (share of TEA) 68 69 78
Note: TEA is the percentage of the adult population engaged in early stage entrepreneurial activity. Figures are the proportions of TEA that fall within each motivational category.
THE ENTREPRENEURIAL CHALLENGE
16
regarding women’s participation in the economy and more general societal perceptions of women’s role in the labour market.
Men generally dominate entrepreneurship in the early stages all over the world, but as previous GEM studies have shown, there is no notable difference between women and men in terms of perceived opportunities and capabilities. Only the fear of failure is somewhat higher among women than men.
Another pattern emerges when the motivational reasons for entrepreneurship in the early stages are examined, namely, that in all regions women’s entre-preneurship is more often necessity-driven than men’s. In six economies, women show equal or higher entre-preneurship rates than men (Vietnam, Philippines, Thailand, Malaysia, Peru and Indonesia). However, the necessity portion of female TEA is high. Malaysia though, exhibits gender equity in both TEA rates and necessity motives, where women are about as likely as men to be entrepreneurs, and equally likely to be necessity-motivated.
ENTREPRENEURIAL AMBITIONS FOR GROWTH, INNOVATION AND INTERNATIONALISATION
GEM also measures ambitions associated with entre-preneurship. More precisely, ambitions are defined as entrepreneurs’ expected job creation together with their innovation and internationalisation efforts. These types of entrepreneurial ambitions have been positi-vely linked to economic development.3
Growth ambitions
Growth ambitions of entrepreneurs in the early stages are directly connected to political priorities around the world, i.e., the creation of jobs. Young and small businesses are of particular interest in this respect, and their importance in contributing to job creation is established in the literature.4 GEM measures expected job growth associated with companies by asking early-stage entrepreneurs how many employees they expect to hire in the coming five years.
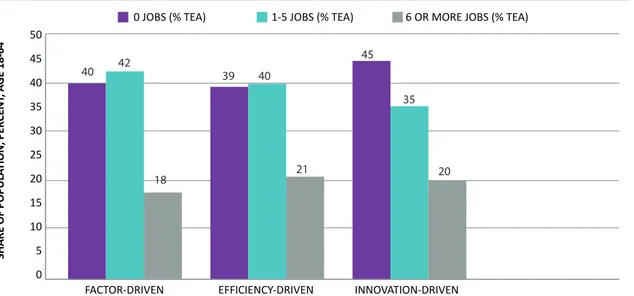
The results may come as a surprise. Although some may assume that entrepreneurs at the factor-driven stage operate without many employees, it is in fact the innovation-driven economies that, on average, have the highest proportion of entrepreneurs with no future hiring expectations (see Figure 1.4). Sophisticated technology and communications may enable entre-preneurs in developed economies to remain small,
perhaps as part of a broader value network. In less developed economies, however, it may be easier to hire people who have fewer job alternatives and where there are fewer regulations imposed on employers. Innovative orientation
While expectations of job growth and how they are realised constitute a visible effect of entrepreneur-ship in the short term, innovation is indicative of the long-term prospects of entrepreneurs. Innovation here refers to the Schumpeterian view that new products, services, processes, organisations and markets drive the further development of a country.
GEM measures the innovative orientation of a business from two perspectives (product and mar-ket). The study examines the extent to which entre-preneurial products or services are new to some or all customers in the market and whether few or no competitors offer the same product or service. It is important to note that this measure is rather context-dependent because some products/services, despite globalisation, may be new to internal markets in many economies, although they are already availa-ble in other markets. Nevertheless, a high degree of innovation tends to positively impact the economic development of the country in question.
North American economies are more innovation-oriented than the rest of the world in both respects. Asia and Oceania shows a different pattern of high product innovation but less introduction of products to new markets. African economies, with the excep-tion of South Africa, exhibit low innovative orientaexcep-tion in both respects. EU countries are, on average, more innovation-oriented in both dimensions measured by GEM than most other regions.
Internationalisation
As globalisation proceeds, it becomes increasingly important for new and young firms to penetrate foreign markets. While innovation may pave the way for small and new companies, such firms must also acquire skills to expand into markets for their products, particularly for ventures originating in countries with small domestic markets.
European countries, with their tradition of inter-national trade and geographical proximity to various markets, have the highest percentage of young com-panies that indicate that at least 25 percent of their customers are located outside their countries.
3. Amorós et al. (2013).
17
Chapter 1. Global Entrepreneurship Monitor - Introduction and summary
1.3 SUMMARY OF THE FINDINGS OF THE GLOBAL GEM REPORT 2015
The results of the Global GEM report 2015 confirm many of the findings of previous reports. The least economically developed parts of the world generally exhibit the highest levels of entrepreneurial activity but also the highest levels of entrepreneurship driven by necessity rather than perceived opportunities.
Perceived business opportunities and capabilities to start and run a business are also greatest in these factor- and efficiency-driven countries. The innovative orientation of businesses increases as economic deve-lopment increases. GEM 2015 shows, once again, that
there is a considerable gender gap in most countries and that women’s entrepreneurship is more often necessity-driven than men’s.
In the global GEM report, the authors stress the importance that decision-makers understand that different types of entrepreneurship coexist (e.g., early-stage entrepreneurship, established businesses, employees’ entrepreneurial activities). Identification and support of these different types of entrepreneur-ship and recognition, for example, of entrepreneurial activity manifested in established businesses contri-bute to an improved understanding of a country’s entrepreneurial capacity and potential.
Figure 1.4: Development phase averages for employment projections in the next five years (percentage of TEA)
FACTOR-DRIVEN
0 JOBS (% TEA) 1-5 JOBS (% TEA) 6 OR MORE JOBS (% TEA)
EFFICIENCY-DRIVEN INNOVATION-DRIVEN SHARE OF POPULA TION, PER CENT , A GE 18-64 50 45 40 35 30 25 20 15 10 5 0 40 42 18 39 40 21 45 35 20
A CROSS-COUNTRY ANALYSIS OF ENTREPRENEURIAL
ACTIVITY, AMBITON AND ATTITUDES
Chapter 2 contains three sections based on theGEM’s classification of entrepreneurship on entre-preneurial activities, entreentre-preneurial ambitions and societal attitudes towards entrepreneurship. Our comparison involves six countries (China, France, Germany, the UK, the USA and Sweden) and three country groups – small EU-countries (Belgium, Ireland and the Netherlands), the Nordic countries (Finland and Norway but not Sweden) and southern Europe (PIGS – Portugal, Italy, Greece and Spain).
These countries and country groups form the basis for the international comparisons when we look at entrepreneurial activity in section 2.1 (e.g., level, types, gender, age and industry composition) and entrepreneurial attitudes in section 2.3 (e.g., inten-tion, perceived opportunities and capabilities, fear of failure, career choice). When examining entrepreneu-rial ambitions (employment growth, market position, innovation and internationalisation), all innovation-driven economies are included in the analysis.
Time series, or more precisely, three to four-year averages during 2004 to 2015, will be presented for most of the variables used in the comparisons below. Data will be presented that cover the entire life cycle of entrepreneurs: potential entrepreneurs, people with intentions to found a business, early-stage
entrepreneurs who are actually starting and running a new business and owners of established businesses.5 2.1 ENTREPRENEURIAL ACTIVITY
We distinguish between individuals who are in the pro-cess of starting a business (i.e., nascent entrepreneur-ship, 0–3 months old), those operating a new business which is older than three months but younger than 3.5 years (new business ownership), and those operating an established business (older than 3.5 years). The nascent entrepreneurship rate combined with the new business ownership rate forms the total early-stage entrepreneurial activity (TEA) within an economy.
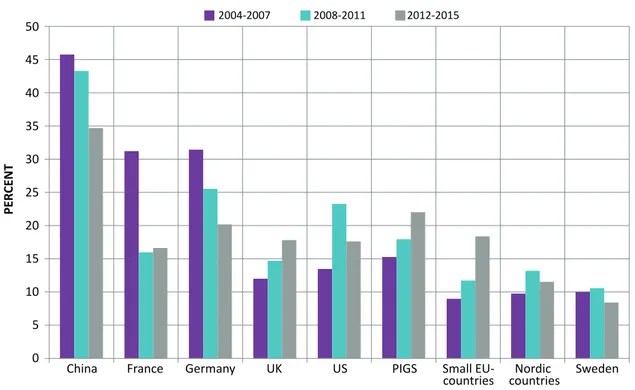
Figure 2.1 compares TEA for six countries and three groups of countries that participated in the GEM bet-ween 2004 and 2015. It is obvious that the TEA rates vary between the three categories of economies with higher and increasing levels of entrepreneurial acti-vity observed for the Anglo-Saxon countries but also for small EU-countries and Sweden. China has witnes-sed a marked decline in entrepreneurship, whereas a relative stable pattern can be observed for the remain-ing countries and country groups. The lowest level of entrepreneurial activity is found in the large EU eco-nomies of Germany and France, together with those countries most severely hit during the aftermath of the
2
5. However, exit will not be covered because it may occur for a number of reasons that are not well accounted for in the data, e.g., bankruptcy, mergers, and splits.
THE ENTREPRENEURIAL CHALLENGE
20
Figure 2.1: Total early-stage Entrepreneurial Activity (TEA)
Percentage of 18–64 year olds in population who are either nascent entrepreneurs or owner-managers of new businesses
Note: Small EU-countries comprise Belgium, Ireland and the Netherlands; Nordic countries comprise Finland and Norway; PIGS comprises Portugal, Italy, Greece and Spain. Due to lack of data, the average for the final time period in France is based on data for 2012 to 2014.
financial crisis in 2007–2009, i.e., the PIGS-countries. We will return to the possible explanations of this development below. The high level of entrepreneur-ship in the US is noteworthy, almost on par with China despite its much higher level of development, and up to three times larger than in most other European countries and country groups.
Turning to nascent entrepreneurship – the earliest stage of actually getting involved in entrepreneurial activities – the US dominates, with a share of nine per-cent of the adult population that were involved in set-ting up a business 2015 (Figure 2.2). With the excep-tion of China, Sweden, being a tradiexcep-tional welfare state that is organised quite differently compared to the US, ranks second. Together with the US, UK and other small EU-countries, Sweden experienced a marked increase in nascent entrepreneurship between 2008–2011 and 2012–2015.
Nascent entrepreneurship is important because it captures the extent to which countries are engaged
in market experiments which may generate new and growing firms. However, the underlying reasons may differ between countries as may the societal impact, depending on whether entrepreneurial endeavours are undertaken due to institutions being favoura-ble to start-ups or because various types of support structures subsidises entrepreneurial activities. These two need not be in conflict with each other, but it is important to identify the drivers of entrepreneurial activity to comprehend the underlying dynamics.
After surviving the first three months the nascent firms are classified as new business ownerships (young firms between 3 and 42 months old). According to Figure 2.3, the picture is much more cramped when looking at new businesses. Disregarding China, the US and the UK, together with small EU-countries, report the highest shares of the adult population running a new firm.6 The latter group has experienced a clear positive trend since 2004–2007 and are almost on par with the US for 2012–2015. A weaker but similar 6. The large share for China is likely to reflect the opening up of a formally closed economy and the (overoptimistic) attempt to exploit conceived
business opportunities. Still, the share decreased considerably between 2008–2011 and 2012–2015. 2004-2007 2008-2011 2012-2015 PER CENT 20 18 16 14 12 10 8 6 4 2 0
China France Germany UK US PIGS Small
21
Chapter 2. A cross-country analysis of entrepreneurial activity, ambition and attitudes
Figure 2.2: Nascent entrepreneurship rate
Percent of the 18–64 year old population who are currently nascent entrepreneurs, i.e. actively involved in setting up businesses they will own or co-own; such a business has not yet paid salaries or wages or made any other payments to the owners for more than three months
Note Figure 2.2 and 2.3: Small EU-countries comprise Belgium, Ireland and the Netherlands; Nordic countries comprise Finland and Norway; PIGS comprises Portugal, Italy, Greece and Spain. Due to lack of data, the average for the final time period in France is based on data for 2012 to 2014.
Figure 2.3: New business ownership rate
Percentage of 18–64 year old population who are currently owner-managers of new businesses, i.e. run businesses that have paid salaries or wages or made any other payments to owners for more than three months but not more than 42 months
2004-2007 2008-2011 2012-2015 PER CENT 10 9 8 7 6 5 4 3 2 1 0
China France Germany UK US PIGS Small
EU-countries countriesNordic Sweden
2004-2007 2008-2011 2012-2015 PER CENT 14 12 10 8 6 4 2
0 China France Germany UK US PIGS Small
THE ENTREPRENEURIAL CHALLENGE
22
Note: Small EU-countries comprise Belgium, Ireland and the Netherlands; Nordic countries comprise Finland and Norway; PIGS comprises Portugal, Italy, Greece and Spain. Due to lack of data, the average for the final time period in France is based on data for 2012 to 2014.
Figure 2.4: Informal investors rate
Percentage of 18–64 year old population that has personally provided funds for a new business started by someone else in the past three years
pattern is shown for the UK over the time period that we consider. The low levels in remaining large EU-countries is noteworthy, as is the decline in the tra-ditional small business PIGS-countries.
EARLY STAGE CAPITAL
A widely discussed and often prioritised policy area concerns access to capital. Doubtlessly, this is criti-cally important for new and young firms, and market failures are likely to be most pronounced for these categories of firms. The GEM provides data on the share of the adult population involved in funding new businesses, what is often referred to as family, friends and fools, i.e. informal investors or angel capi-tal. Figure 2.4 reveals some interesting findings. First, Sweden is shown to be one of the countries with the largest share of informal investors; it has, in fact, a higher share than any of the other innovation-driven countries or country groups in 2008-2011, closely fol-lowed by the US. Furthermore, China seem to host a large share early-stage funding individuals.
This may explain Sweden’s high and increasing share of nascent entrepreneurs. Second, the crisis that started in 2008 does not seem to have deprived countries of their informal investors. Instead, it increased in a num-ber of countries between 2008 and 2011 compared to 2004-2007, and in some cases, it continued to increase in 2012–2015.
ENTREPRENEURIAL MOTIVE – NECESSITY OR OPP-ORTUNITY
A key difference in the character of entrepreneurship can be observed by comparing the primary motiva-tions of the entrepreneurs. On the one hand, they may be pushed into starting a business out of necessity because they have no other work options and need a source of income, i.e., necessity entrepreneurship. On the other hand, they may be pulled into starting businesses because they recognise lucrative business opportunities and choose to pursue them.
GEM refers to opportunity-based entrepreneurship when people start businesses to improve their incomes 2004-2007 2008-2011 2012-2015 PER CENT 9 8 7 6 5 4 3 2 1 0
China France Germany UK US PIGS Small
23
Chapter 2. A cross-country analysis of entrepreneurial activity, ambition and attitudes
Note Figure 2.5a and b: Small EU-countries comprise Belgium, Ireland and the Netherlands; Nordic countries comprise Finland and Norway; PIGS comprises Portugal, Italy, Greece and Spain. Due to lack of data, the average for the final time period in France is based on data for 2012 to 2014.
Figure 2.5a: Necessity-driven entrepreneurial activity: relative prevalence Percentage of those involved in TEA because they have no other work options
7. Lamballais Tessensohn and Thurik (2013).
2004-2007 2008-2011 2012-2015 PER CENT 50 45 40 35 30 25 20 15 10 5 0
China France Germany UK US PIGS Small
EU-countries countriesNordic Sweden
Figure 2.5b: Opportunity-driven entrepreneurial activity: relative prevalence Percentage of those involved in TEA because they identified business opportunities
2004-2007 2008-2011 2012-2015 PER CENT 90 80 70 60 50 40 30 20 10 0
China France Germany UK US PIGS Small
THE ENTREPRENEURIAL CHALLENGE
24
or gain independence in their work. Entrepreneurs in innovation-driven economies tend to be primarily dri-ven by opportunity-motivated entrepreneurship.
Figures 2.5a and 2.5b clearly illustrate this dis-tinction. Most countries are predominantly cha-racterised by opportunity-driven entrepreneurship, the exception being China. As economies become richer and more developed the share of necessity driven entrepreneurship normally falls. In 2012– 2015, between 70–90 percent of all entrepreneur-ship is related to business opportunity for the five innovation-driven economies and three country groups. Also in China necessity-driven entrepre-neurship has decreased – from approximately 45 percent in 2004–2007 to 35 percent in 2012–2015. Among innovation-driven economies, necessity-dri-ven entrepreneurship has increased not only in the PIGS countries, which were particularly hard hit by the economic crisis, but also, and somewhat more surprisingly, in the UK and small EU-countries. The Nordic countries together with Sweden have the lowest shares. France and Germany reveal consi-derable reductions in necessity-based entrepreneur-ship, albeit from relatively high levels.
Each of these types of entrepreneurship is important for the economic development but we expect oppor-tunity based entrepreneurship to be more associated with productivity and growth effects.7
THE GENDER GAP
Figures 2.6a and 2.6b present the TEA rate for the male and female adult population. The rankings in Figure 2.6a basically mimic the overall TEA rate shown in Figure 2.1, but the shares are higher when we restrict the analysis to men. When the corresponding graph for women is depicted, it is obvious that countries having a strong entrepreneurial performance in gene-ral also have that for women (Figure 2.6b). Among developed economies, the US and the UK are far ahead of the remaining countries but trail China’s rate. Small EU-countries, Sweden and the UK display a pronoun-ced positive trend throughout the studied period.
The female TEA prevalence rate further reveals that most countries do have quite a gender gap in entre-preneurship (Figure 2.7), where the share of women entrepreneurs is approximately 50 percent compared to males in most of the countries. The UK is the only country that is shown to have a trend-wise increase over the period.
ESTABLISHED BUSINESSES
With respect to established business ownership in innovation-driven countries, we can see from Figure 2.8 that the share ranges from about 3.5 percent to almost eight percent (the US) and that a surprisingly large num-ber of countries seems to have a share in the range of 6.5–7.5 percent of the adult population running a firm older than 3.5 years. China is again an outlier, with a rate close to 10 percent, which corroborates previous finding regarding the relationship between the stage of econo-mic development and the number of firms.
Again, smaller EU countries had a positive develop-ment over the period, as did France, though from a considerably lower level. Sweden performed worse compared to the other countries and country groups when we look at established businesses, which may reflect the dominance of large firms in the Swedish economy.
INDUSTRY AND AGE COMPOSITION OF ENTREPRE-NEURSHIP
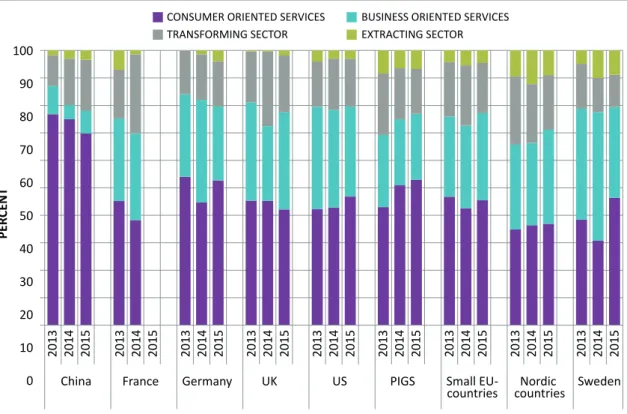
The distribution of early-stage entrepreneurs (TEA) by industry is shown in Figure 2.9. Basically, the dist-ribution of TEA in industries reflect these countries’ and country groups’ overall specialisation. Hence, the Nordic countries and Sweden have a relatively large share of entrepreneurship in the extractive sectors compared to the other countries, whereas entrepre-neurial activities are more concentrated in the busi-ness service sector in the UK and the US. China, in contrast, is shown to be dominated by entrepreneurs in the consumer service sector, as expected. Sweden reports relatively large changes regarding entrepre-neurship in the consumer service and business service sectors between 2014 and 2015, which is probably related to a heated political discussion in the elec-tion year 2014 regarding the continuaelec-tion of subsidies to particularly consumer services but also the future terms for private welfare services. The sectoral diffe-rences are quite small between countries, with China again deviating from the general pattern.
The last figure related to entrepreneurial activity focuses on the age distribution of entrepreneurs. As shown in Figure 2.10, approximately 35–40 percent of early-stage entrepreneurship takes place in the age cohorts 18–24 and 25–35. For all countries, however, entrepreneurship is most common in individuals’ mid-career ages, i.e., the age cohort 35–54. There are signs of entrepreneurship becoming more prevalent for the
25
Chapter 2. A cross-country analysis of entrepreneurial activity, ambition and attitudes
Figure 2.6b: Total early-stage entrepreneurial activity for female working age population Percentage of female 18–64 year old population who are either nascent entrepreneurs or owner-managers of new businesses Figure 2.6a: Total early-stage entrepreneurial activity for male working age population Percentage of male 18–64 year old population who are either nascent entrepreneurs or owner-managers of new businesses
Note Figure 2.6a and 2.6b: Small EU-countries comprise Belgium, Ireland and the Netherlands; Nordic countries comprise Finland and Norway; PIGS comprises Portugal, Italy, Greece and Spain. Due to lack of data, the average for the final time period in France is based on data for 2012 to 2014. 2004-2007 2008-2011 2012-2015 PER CENT 25 20 15 10 5 0
China France Germany UK US PIGS Small
EU-countries countriesNordic Sweden
2004-2007 2008-2011 2012-2015 PER CENT 18 16 14 12 10 8 6 4 2 0
China France Germany UK US PIGS Small
THE ENTREPRENEURIAL CHALLENGE
26
Note Figure 2.7 and 2.8: Small EU-countries comprise Belgium, Ireland and the Netherlands; Nordic countries comprise Finland and Norway; PIGS comprises Portugal, Italy, Greece and Spain. Due to lack of data, the average for the final time period in France is based on data for 2012 to 2014.
Figure 2.8: Established business ownership rate
Percentage of 18–64 year old population who are currently owner-managers of established businesses, i.e. run businesses that have paid salaries or wages or made any other payments to owners for more than 42 months
Figure 2.7: Total early-stage entrepreneurial activity; number of females per male 2004-2007 2008-2011 2012-2015 RA TIO 0.8 0.7 0.6 0.5 0.4 0.3 0.2 0.1 0
China France Germany UK US PIGS Small
EU-countries countriesNordic Sweden
2004-2007 2008-2011 2012-2015 PER CENT 16 14 12 10 8 6 4 2 0
China France Germany UK US PIGS Small
27
Chapter 2. A cross-country analysis of entrepreneurial activity, ambition and attitudes
Note: Small EU-countries comprise Belgium, Ireland and the Netherlands; Nordic countries comprise Finland and Norway; PIGS comprises Portugal, Italy, Greece and Spain.
Figure 2.9: TEA distributed on sectors 2013–2015
more elderly (55–64), particularly in France, the Nordic countries and Sweden. However, the share is quite low, somewhere between 13–18 percent in 2014.
2.2 ENTREPRENEURIAL AMBITIONS – GROWTH, INNOVATION AND INTERNATIONALISATION
The way in which new firms and businesses impact the national economy depends on the institutional framework that surrounds the activity of incumbents and entrepreneurs. This section profiles the potential impact of entrepreneurship by looking at the percei-ved i) job-creation potential of their businesses, ii) market position, iii) innovativeness, and iv) internatio-nalisation measured as the share of foreign customers. In this section, we will present data for all countries defined as innovation-driven, based on data for the last available year (2015) and on averages for the last three years.
JOB GROWTH EXPECTATIONS
Growth expectations measure how many employees the entrepreneurs expect to employ in the coming
five years. Previous research has shown that growth expectations are a workable indicator of later growth performance by firms.8 In Figure 2.11, the average growth expectations are presented for new and young firms expecting to hire more than 20 employees in the coming five-year period (high growth expectations). High-growth firms, or gazelles, have been shown to account for a disproportionate share of new employees and are consequently important for future growth.9
The most growth oriented nations report shares of TEA around 15 percent, whereas the share of those at the other end of the spectrum is approximately 3–5 percent. Compared to the numbers reported last year, there are fewer countries in 2015 where over 15 per-cent of the entrepreneurs expect to hire more than 20 employees in the coming five-year period, whereas the number of countries where the share is below five percent has increased. It signals that optimism among entrepreneurs has decreased. Again, countries with the lowest growth expectations have either been severely hurt by the economic crisis (e.g., PIGS group) or can be found among smaller countries, often belonging to the group of welfare countries (Finland, Norway, CONSUMER ORIENTED SERVICES BUSINESS ORIENTED SERVICES
TRANSFORMING SECTOR PER CENT 100 90 80 70 60 50 40 30 20 10 0 China 2013 2014 2015 2013 2014 2015 2013 2014 2015 2013 2014 2015 2013 2014 2015 2013 2014 2015 2013 2014 2015 2013 2014 2015 2013 2014 2015
France Germany UK US PIGS Small
EU-countries countriesNordic Sweden
EXTRACTING SECTOR
8. Davidsson et al. (2012). 9. Henrekson and Johansson (2010).
THE ENTREPRENEURIAL CHALLENGE
28
Figure 2.10: TEA distributed on age groups 2013–2015
Note: Small EU-countries comprise Belgium, Ireland and the Netherlands; Nordic countries comprise Finland and Norway; PIGS comprises Portugal, Italy, Greece and Spain.
Netherlands and Sweden). Furthermore, in the small EU country group, the share claiming that they will expand their working force is relatively low, despite improving in other dimensions of entrepreneurship.
Anglo-Saxon countries, together with a few from Eastern Europe and Taiwan, dominate the top per-formers. Interestingly, Germany is ranked as the sixth most growth-oriented economy and has improved its position in recent years. Similarly, several of the Nordic countries, including Sweden, have moved up in the ran-king of high-growth expecting entrepreneurs among entrepreneurs. These countries, not least Germany, have also undertaken important reforms to enhance flexibility in their respective labour markets.
MARKET CONDITIONS AND INNOVATIVENESS
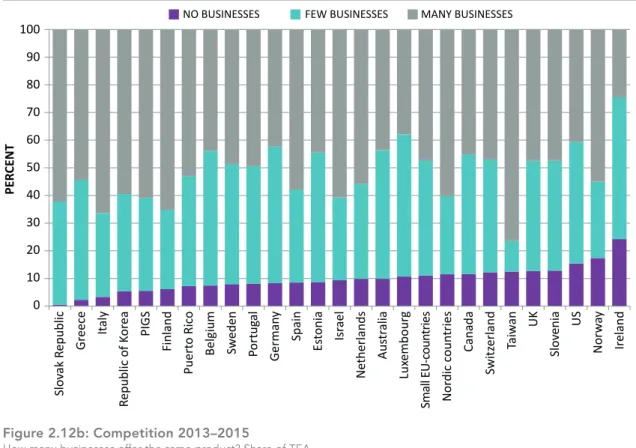
When asked about the market conditions facing entrepreneurs, all countries (except Ireland) report that more than 80 percent of the entrepreneurs have at least a few competitors, whereas 13 of the 24 countries are dominated by entrepreneurs who face
competition from no or few other businesses (Figure 2.12a). That finding signals a strong market position for those countries that is likely to be based on speciali-sed and unique products and services. Germany, other small EU countries, Sweden, the UK and the US fall into this group. Note also that one of the PIGS countries – Portugal – reports a share above 50 percent, whereas Greece, Italy and Spain fall below that level. Overall, the emerging picture is somewhat mixed; approx-imately half of the innovation-driven countries seem to have entrepreneurship that is more of an imitative character, and the remaining half seems more oriented towards innovative entrepreneurship. When adopting a three-year average measure to avoid annual swings, the shares remains more or less intact, but the position of the respective country may change (Figure 2.12b).
Having few competitors does not necessarily trans-late into a high level of innovativeness because com-petition is highly contingent upon institutions and the extent to which competition works and is prioritised by policy makers. Introducing new products or services AGE 18-24 AGE 25-34 AGE 35-54 PER CENT 100 90 80 70 60 50 40 30 20 10 0 China 2013 2014 2015 2013 2014 2015 2013 2014 2015 2013 2014 2015 2013 2014 2015 2013 2014 2015 2013 2014 2015 2013 2014 2015 2013 2014 2015
France Germany UK US PIGS Small
EU-countries countriesNordic Sweden
29
Chapter 2. A cross-country analysis of entrepreneurial activity, ambition and attitudes
Figure 2.11: Job growth expectations for early-stage entrepreneurs, 2013–2015 Share of TEA where entrepreneurs expect to hire 20 or more employees within five years
Note: Small EU-countries comprise Belgium, Ireland and the Netherlands; Nordic countries comprise Finland and Norway; PIGS comprises Portugal, Italy, Greece and Spain. Due to lack of data, the average for France is based on data for 2013 and 2014.
into the market and thereby fostering product variety for customers and contributing to national competiti-veness is a vital ingredient in growth that is often attri-buted to entrepreneurs, as the agents of change who contribute with radical and disruptive innovations.
To capture novelty, GEM also asks entrepreneurs whether their product or service is new to some or all customers to complement the above information about competitors. Figure 2.13a reveals that a somewhat lar-ger number of countries claim that their entrepreneurs have come up with innovative products that are new to all customers in 2015. For eleven countries, more than 50 percent of the entrepreneurs report that their pro-duct or service is new to either all or some customers. Hence, the numbers of countries are approximately the same, but the ordering between countries reve-als some dramatic changes. The PIGS-countries move up the ladder primarily because a very large share of Italian entrepreneurs claim themselves to have unique products. Small EU-countries are again highly ranked, as are the UK and Ireland. In general, Germany and the
US are less well off when looking at innovation, as are the Nordic countries. A similar picture emerges when we look at three-year averages (Figure 2.13b).
INTERNATIONALISATION
Internationalisation measures the extent to which early-stage entrepreneurs sell to customers outside their domestic market. In general, serving interna-tional markets signals both high ambitions and inter-national competitiveness of a country’s early stage entrepreneurs. As shown in Figure 2.14a, in 6 of the 24 countries, about 50 percent of new and young firms have no sales at all outside their domestic markets, and in 15 countries, more than 30 percent of entrepre-neurs lack customers abroad. Still, this is an improve-ment in comparison with 2014. Only in three countries does the share of entrepreneurs having more than 25 percent of their customers abroad exceed 30 percent. Hence, there are signs of improvement, but the degree of internationalisation is still quite low in the group of new and young firms (TEA).
PER CENT 25 20 15 10 5 0 Puert o Ric o Gr
eece Spain Italy PIGS
Lux embour g Switz erland Belgium Portug al N or w ay Ne therlands Small EU-c oun trie s Es tonia Nor dic c oun tries Sw eden France Finland UK Slo venia German y Ireland Canada Slo vak R epublic US Taiw an
THE ENTREPRENEURIAL CHALLENGE
30
Figure 2.12a: Competition 2015
How many businesses offer the same product? Share of TEA
Figure 2.12b: Competition 2013–2015
How many businesses offer the same product? Share of TEA
Note Figure 2.12a: Small EU-countries comprise Belgium, Ireland and the Netherlands; Nordic countries comprise Finland and Norway; PIGS comprises Portugal, Italy, Greece and Spain.
Note 2.12b: Small EU-countries comprise Belgium, Ireland and the Netherlands; Nordic countries comprise Finland and Norway; PIGS comprises Portugal, Italy, Greece and Spain. Due to lack of data, the average for France is based on data for 2013 and 2014.
PER CENT 100 90 80 70 60 50 40 30 20 10 0 Slo vak R
epublic Greece Italy
Republic of K or ea PIGS Finland Puert o Ric o
Belgium Sweden Portug
al
German
y
Spain
Es
tonia Israel
Ne therlands Aus tr alia Lux embour g Small EU-c oun trie s Nor dic c oun tries Canada Switz erland Taiw an UK Slo venia US N or w ay Ireland
NO BUSINESSES FEW BUSINESSES MANY BUSINESSES
PER CENT 70 60 50 40 30 20 10 0 Taiw an Italy Finland Slo vak R epublic Nor dic c oun
tries PIGS Spain
N or w ay Gr eece Ne therlands Puert o Ric o Switz erland UK Portug al Small EU-c oun trie s German y
Belgium Slovenia Sweden Estonia Canada France
US
Ireland
Lux
embour
g
31
Chapter 2. A cross-country analysis of entrepreneurial activity, ambition and attitudes
Figure 2.13a: Innovative products for early-stage entrepreneurs 2015 Share of TEA whose products are new to …
Figure 2.13b: Innovative products for early-stage entrepreneurs 2013–2015 Share of TEA whose products are new to …
Note Figure 2.13a: Small EU-countries comprise Belgium, Ireland and the Netherlands; Nordic countries comprise Finland and Norway; PIGS comprises Portugal, Italy, Greece and Spain.
Note 2.13b: Small EU-countries comprise Belgium, Ireland and the Netherlands; Nordic countries comprise Finland and Norway; PIGS comprises Portugal, Italy, Greece and Spain. Due to lack of data, the average for France is based on data for 2013 and 2014.
PER CENT 100 90 80 70 60 50 40 30 20 10 0 N or w ay Portug al Sw eden Nor dic c oun tries Aus tr alia
Spain Israel
Puert o Ric o Lux embour g German y Es tonia Slo vak R epublic Greece US Republic of K or ea Finland Ireland Switz
erland Canada PIGS
UK Slo venia Ne therlands Small EU-c oun trie s Belgium Italy Taiw an
... ALL CUSTOMERS ... SOME CUSTOMERS ... NO CUSTOMERS
PER CENT 80 70 60 50 40 30 20 10 0 N or w ay Nor dic c oun tries Spain Portug al Puert o Ric o Gr eece Ne therlands German y UK Finland France Small EU-c oun trie s Sw eden US Switz
erland Belgium Estonia PIGS Ireland
Slo venia Canada Slo vak R epublic Italy Lux embour g Taiw an
THE ENTREPRENEURIAL CHALLENGE
32
Figure 2.14a: International orientation for early-stage entrepreneurs 2015 TEA distributed on share of customers abroad
Note: Small EU-countries comprise Belgium, Ireland and the Netherlands; Nordic countries comprise Finland and Norway; PIGS comprises Portugal, Italy, Greece and Spain.
One would expect smaller countries to have a larger share of their customers abroad, given the limited size of their domestic markets. However, the picture is quite mixed, although a fairly large number of small countries are among those most internationalised, as shown in Figure 2.14b. However, small PIGS-countries have a low degree of internationalisation, as do the Nordic countries, whereas the US is among countries with the most internationalised entrepreneurs. The dif-ference among smaller countries’ internationalisation is likely to mirror differences in industrial structure, firm size distribution and traditions in the respective country. However, it may also reflect a low awareness of the importance to enter markets beyond domestic borders. In a process of increased globalisation where domestic market shares can be expected to shrink due to intensified competition, it is of vital importance to also have skills in new and young firms to penetrate foreign markets.
2.3 ENTREPRENEURIAL ATTITUDES
Every individual has the potential to become an entre-preneur. Some will venture into entrepreneurship, while others – for various reasons – will not. Thus, it
is important to understand how individuals perceive their abilities and whether societal attitudes toward entrepreneurship are likely to influence the occupa-tional choice between becoming an entrepreneur or a wage earner.
INTENTIONS, OPPORTUNITIES AND CAPABILITIES
Entrepreneurial intentions are an important measure of potential entrepreneurship in a society; in the GEM study, these are represented by the percentage of individuals who expect to start a business within the next three years. In innovation-driven economies, there seems to be an increase in entrepreneurial intentions between 2004 and 2015 for most countries, with Sweden being the exception (Figure 2.15). The levels and magnitude of change differ: France and the US are shown to have the highest levels, followed by PIGS-countries, small EU-countries, Sweden and the UK, whereas Germany and the Nordic countries trail behind. China has a distinct negative trend, likely reflecting that much of the previous entrepreneur-ship was necessity-based and has been declining since 2004 (see Figure 2.5a), and probably also a business cycle effect. PER CENT 100 90 80 70 60 50 40 30 20 10 0 Slo vak R epublic US Canada Lux embour g Portug al Belgium Ireland Switz erland Aus tr alia Small EU-c oun trie s Gr eece Slo venia UK Sw eden Es tonia Finland German y Ne therlands Isr ael Italy Taiw an PIGS Nor dic c oun tries Puert o Ric o Republic of K or ea Spain N or w ay