i
Master’s Thesis
Computer Science
September 2012
School of Computing
Blekinge Institute of Technology
SE – 371 79 Karlskrona
Sweden
Open Data for Anomaly Detection in
Maritime Surveillance
Shahrooz Abghari
Samira Kazemi
This thesis is submitted to the School of Computing at Blekinge Institute of Technology in
partial fulfillment of the requirements for the degree of Master of Science in Computer Science.
The thesis is equivalent to 20 weeks of full time studies.
Contact Information:
Authors:
Shahrooz Abghari E-mail: shahroozabghari@gmail.com Samira Kazemi E-mail: kazemi.samira@gmail.comUniversity advisors:
Dr. Henric Johnson, School of ComputingBlekinge Institute of Technology Dr. Niklas Lavesson,
School of Computing
Blekinge Institute of Technology
School of Computing
Blekinge Institute of Technology
SE – 371 79 Karlskrona Sweden
Internet : www.bth.se/com
Phone
: +46 455 38 50 00
Fax
: +46 455 38 50 57
i
Abstract
Context Maritime Surveillance (MS) has received increased attention from a civilian perspective in recent years. Anomaly detection (AD) is one of the many techniques available for improving the safety and security in the MS domain. Maritime authorities utilize various confidential data sources for monitoring the maritime activities; however, a paradigm shift on the Internet has created new sources of data for MS. These newly identified data sources, which provide publicly accessible data, are the open data sources. Taking advantage of the open data sources in addition to the traditional sources of data in the AD process will increase the accuracy of the MS systems.
Objectives The goal is to investigate the potential open data as a complementary resource for AD in the MS domain. To achieve this goal, the first step is to identify the applicable open data sources for AD. Then, a framework for AD based on the integration of open and closed data sources is proposed. Finally, according to the proposed framework, an AD system with the ability of using open data sources is developed and the accuracy of the system and the validity of its results are evaluated.
Methods In order to measure the system accuracy, an experiment is performed by means of a two stage random sampling on the vessel traffic data and the number of true/false positive and negative alarms in the system is verified. To evaluate the validity of the system results, the system is used for a period of time by the subject matter experts from the Swedish Coastguard. The experts check the detected anomalies against the available data at the Coastguard in order to obtain the number of true and false alarms.
Results The experimental outcomes indicate that the accuracy of the system is 99%. In addition, the Coastguard validation results show that among the evaluated anomalies, 64.47% are true alarms, 26.32% are false and 9.21% belong to the vessels that remain unchecked due to the lack of corresponding data in the Coastguard data sources.
Conclusions This thesis concludes that using open data as a complementary resource for detecting anomalous behavior in the MS domain is not only feasible but also will improve the efficiency of the surveillance systems by increasing the accuracy and covering some unseen aspects of maritime activities.
Keywords: open data, anomaly detection, maritime security, maritime domain awareness
ii
Acknowledgment
First and foremost, we would like to thank our supervisors Dr. Niklas Lavesson and Dr. Henric Johnson for their patient guidance, encouragement and advice throughout this thesis. We would also like to acknowledge the invaluable support of the Swedish Coastguard in this thesis. In particular, we are grateful to Peter Ryman, the law enforcement officer at the Coastguard, without whose knowledge and kind support this study would not have been successful.
Special thanks are due to Martin Boldt for all his help and support during the tough time of system installation.
Last but not least, we would like to express our heartfelt thanks to our beloved families, for their understanding and endless love through the duration of our studies.
iii
TABLE OF CONTENTS
1. INTRODUCTION ... 1
1.1 PROBLEM STATEMENT ... 2
1.2 RESEARCH QUESTIONS ... 2
1.3 AIMS AND OBJECTIVES ... 2
1.4 CONTRIBUTION ... 3
1.5 OUTLINE ... 3
2. BACKGROUND ... 3
2.1 TERMINOLOGY ... 4
2.2 JDLDATA FUSION MODEL ... 4
2.3 RELATED WORK ... 5
3. RESEARCH METHODOLOGY ... 7
3.1 OPEN DATA IN THE MSDOMAIN ... 7
3.2 IDENTIFICATION OF MARITIME ANOMALIES ... 8
3.3 FRAMEWORK DESIGN ... 10
3.4 IMPLEMENTATION ... 11
3.4.1 Data Description ... 11
3.4.2 Data Collector Module ... 12
3.4.3 Database ... 13
3.4.4 Anomaly Detector Module ... 13
3.4.5 Display Client ... 16 3.5 EXPERIMENTAL DESIGN ... 17 3.6 VALIDATION DESIGN ... 17 4. VALIDITY THREATS ... 18 5. VERIFICATION ... 19 6. EXPERIMENTAL RESULTS ... 19 7. VALIDATION RESULTS ... 22 8. DISCUSSION ... 25
9. CONCLUSION AND FUTURE WORK ... 26
APPENDIX A: OPEN AND CLOSED DATA SOURCES ... 28
APPENDIX B: PORTS REGIONS ... 35
APPENDIX C: ALGORITHMS ... 39
APPENDIX D: USER INTERFACE ... 48
APPENDIX E: ACRONYMS ... 49
1
1. I
NTRODUCTION
MS is the effective understanding of all maritime activities that could impact the security, safety, economy or environment1
In addition to having a complete RMP, the way that the MS systems are used by human operators plays an important role in the efficiency of the surveillance operations. Monitoring vast sea areas and trying to establish Maritime Domain Awareness (MDA) for human operators is a difficult and time-consuming task (Riveiro, Falkman, & Ziemke, 2008a). This is due in part to the large amounts of heterogeneous data from multiple sources but also to the difficulties in detecting anomalous behavior from normal maritime activities. Therefore, having an automatic detector of unusual activities would help decision makers to efficiently monitor the ongoing activities in the surveillance area.
. In recent years, the MS domain has received increased attention because of terrorism, smuggling activities and illegal immigration. An efficient MS system requires a complete Recognized Maritime Picture (RMP), which can be defined as a composite picture of maritime activities over an area of interest (Lefebvre & Helleur, 2001). For national maritime sovereignty, the RMP should include all activities within the 200 nautical miles Exclusive Economic Zone (EEZ). However, for some purposes such as the detection of illegal vessel transits, the RMP could extend beyond this region (Ponsford, D’Souza, & Kirubarajan, 2009). Using today’s technology, continuous tracking of all maritime activities by a single sensor data is not sufficient since it cannot monitor everything that happens in the surveillance area. On the other hand, there are large amounts of data in the MS domain that are gathered from a variety of sensors, databases and information systems. Therefore, by taking advantage of all the available data sources it would be possible to obtain a complete RMP.
According to the Department of Homeland Security2
As well as the AD techniques, the use of different data sources will highly influence the detection of suspicious activities. Usually, only the data received from sensors are used for AD but there are a number of additional data sources regarding maritime activities that can be useful for this purpose. These sources of data consist of open and closed data about vessels, cargos, crew, etc. The closed data are only accessible to the maritime authorities, such as the Coastguard, but, by contrast, the open data are available online and freely accessible and reusable to the public. For instance, there are different organizations such as ports that publish their vessel traffic data or their facilities information online. In addition to the organizations, there are different online communities such as blogs, forums and social , AD is one of the enabling techniques for MDA. However, there are various AD techniques available and it is essential to choose the appropriate techniques that accomplish the MS goals. Data-driven AD approaches find the anomalous behavior by constructing a model from normal data and calculating the deviation from that model. However, relying only on data-driven approaches for surveillance systems is not sufficient due to the lack of user involvement in the detection process (Riveiro & Falkman, 2010). Furthermore, because of the diverse and complicated nature of the activities in the surveillance area, some of the suspicious behaviors are not directly observable. Therefore, finding all types of anomalies by using data-driven approaches seems to be impossible. On the other hand, maritime domain experts have the required knowledge and experience for finding maritime anomalies. Including the expert’s knowledge about suspicious activities in the detection process can result in improved AD.
1
Integrating Maritime Surveillance, common information sharing environment (cise). Retrieved from
http://ec.europa.eu/maritimeaffairs/policy/integrated_maritime_surveillance/documents/integrating_maritime_su rveillance_en.pdf
2 National plan to achieve maritime domain awareness for the national strategy for maritime security. Retrieved
2
networks which provide the possibility of sharing information about maritime events. Some of the advantages of open data in addition to the availability for the public and free accessibility are: first, open data can reveal some facts that are not reported to the maritime authorities or available in their databases and second, open data can be used in the global context and are not suffered from legitimate limitations of exchanging data between different countries. By applying the open data to the detection process, the AD can be done more wisely and the results can have more facts of interests for the maritime experts.
1.1
Problem Statement
In the maritime domain, there are different kinds of data sources that provide heterogeneous data regarding maritime activities. The majority of data, which are used by the MS systems, belong to the surveillance area of each country and are obtained from a variety of sensors and databases that are only accessible by the countries authorities. For detecting some of the anomalous activities such as smuggling, the maritime data beyond the surveillance area of each country are required. In order to assure security, maritime organizations in different countries need to exchange their privileged data and for this purpose they should deal with the diverse regulation of the data protection in each land. Exchanging data among countries is difficult, time-consuming and in some cases impossible because of the legislative issues. Moreover, there are activities that are neither reported to the maritime organizations, nor recorded in their data sources but they can be useful for the surveillance purpose. The publicly accessible and reusable data that are free from the legislative issues and revealing the unseen aspects of maritime activities are referred as open data. Consequently, employing the open data along with other confidential data sources would be beneficial for the MS systems to achieve their goals.
1.2
Research Questions
Given the context of available data sources and MS systems at the Swedish Coastguard and the types of anomalies that the subject matter experts at the Coastguard are interested in, the first research question is:
1. How accurate and valid are the results of an AD system that exploits open data as a complement to the available closed data?
In addition, by considering the accuracy as the degree to which the aforementioned AD system is able to distinguish between the normal and anomalous activities, and the validity as the degree to which the system results are true in real life, the next question is:
2. What is the performance difference between the system accuracy and the validity of results?
1.3
Aims and Objectives
The aim is to investigate the potential open data as a complementary resource for AD in the MS domain.
Objectives:
• Identify existing open data sources in the maritime domain.
• Identify those open data sources that are suitable for being used for AD in the MS domain.
• Propose a framework for AD in the MS domain based on using the open data. • Develop an AD system based on the proposed framework and evaluate the accuracy
of the system.
3
1.4
Contribution
This thesis contributes with a deeper understanding of open data as a complementary resource for effectively establishing the MS operations. It provides a framework for using the open data sources together with other sources of data for AD in the MS domain. According to the framework, an AD system is developed which employs a number of algorithms to implement the expert rules for detecting anomalies. The final contribution is the evaluation of the implemented AD system via the Coastguard validation in real life and also an experiment.
1.5
Outline
The remainder of this work is organized as follows: Section 2 reviews the background and related work regarding the open data, AD and data fusion in the MS domain. Section 3 presents the research methodology. Validity threats and verification are described in sections 4 and 5, respectively. Section 6 presents the experiment results and the validation results are shown in section 7. Section 8 features a detailed discussion about the obtained results. Finally, section 9 concludes the research with a discussion on the possible directions for future work.
2.
B
ACKGROUND
The idea behind open data has been established for a long time. Open data can be used in a variety of domains and can be obtained from any resource. The two major sources of open data are the open data in science and the open data in government1
According to the estimation by Dedijer and Jéquier (1987), 90% of all information is open source, 9% is grey information (preprints of scientific articles, rumors in business circles, project proposals submitted to a research-funding agency, discussions with well-informed specialists, etc.), 0.9% is secret and 0.1% is non-existent information (i.e. the information you have, but you are not aware of it). Considering the large ratio of the open data sources, there should be a great value in using them in different domains. In the MS systems, the majority of the exploited data are obtained from the confidential sources. However, in recent years the new concept of the Web, which takes the network as a platform for information sharing, interoperability and collaboration, has created new sources of data for MS. There are organizations and communities that provide their maritime related data online and make them accessible for the public. Therefore, it would be beneficial for the MS . The longstanding concept of open data in science tries to overcome the difficulties in the current system of scientific publishing such as the inability to access data or usage limitation that is applied by the publishers or data providers (Molloy, 2011). Different groups, individuals and organizations are gathered to participate in a movement toward reforming the process of scientific publication (Molloy, 2011). One of the outcomes of the open data movement in science is the online availability of large number of scientific datasets for the public by different organizations. As well as the open data movement in science, governments for over a decade attempt to publish government data online and make it publicly accessible, readily available, understandable and usable (Alonso et al., 2009). Sharing the government data with the public provides openness and transparency with citizens. It can also improve the degree of participation in the society activities and the efficiency and effectiveness of the government services and the operations within and between the governments (Dietrich et al., 2009).
1
4
systems if they can take advantage of the open data to increase the safety and security in their surveillance area.
2.1
Terminology
According to the Department of Homeland Security1
Data fusion involves the process of combining data from multiple sources or sensors and making inferences that may not be possible from a single source or sensor (Hall & McMullen, 2004).
, MDA would be achieved by monitoring the maritime activities, fusing and analyzing the data in a way that normal activities can be identified and anomalies differentiated. Therefore, AD and data fusion techniques are important technologies for MDA.
AD is widely used in the areas such as video surveillance, network security and military surveillance. Chandola, Banerjee and Kumar (2009) define AD as:
The problem of finding patterns in data that do not conform to expected behavior.
Depending on the domain of study, the non-conforming patterns are called by different names such as anomalies, outliers, exceptions, etc. In the MS domain, these non-conforming patterns are referred as anomalies. Defense R&D Canada (Roy, 2008) provides the following definition for the term anomaly in the context of the MS domain:
Something peculiar (odd, curious, weird, bizarre, atypical) because it is inconsistent with or deviating from what is usual, normal, or expected, or because it is not conforming to rules, laws or customs.
The term Open Data refers to the idea of making data freely available to use, reuse or redistribute without any restriction. The open data movement follows the other open movements such as Open Access and Open Source. According to the Open Knowledge Foundation2
2.2
JDL Data Fusion Model
, a community based organization that promote open knowledge (whether it is content, data or information-based), an open work should be available as a whole, with a reasonable reproduction cost, preferably downloading via the Internet without any charge and in a convenient and modifiable form. Furthermore, it should be possible to modify and distribute the work without any discrimination against persons, groups, fields or endeavor. In the scope of this thesis, the open data term refers to the publicly available data that may or may not require free registration.
One of the most widely used data fusion models in the literature is the JDL data fusion model. It was developed by the US Joint Directors of Laboratories (JDL) data fusion sub-panel in 1985. A current version of the model consists of six different levels. Table 1 shows the description of these six levels (Hall & McMullen, 2004).
In this work the main focus is on AD which is done in the Level 2 (situation assessment) of the JDL model. The input of this level is the identified entities and their related information regarding each other or the environment and the output would be the assessment of a situation as normal or anomalous (Brax, Niklasson, & Smedberg, 2008).
1
National plan to achieve maritime domain awareness for the national strategy for maritime security. Retrieved from www.dhs.gov/xlibrary/assets/HSPD_MDAPlan.pdf
2
5 Table 1
Summary of the JDL Data Fusion Model Components
JDL model component Description
Level 0 processing (Source preprocessing)
At this level, preprocessing of data from sensors and databases would be done by means of image processing, signal processing and conditioning, unit conversions, bias corrections or feature extractions, etc.
Level 1 processing (Object refinement)
This level focuses on combining data from sensors and databases in order to obtain the most accurate and reliable estimates of an entity’s position, movement, attributes, characteristics and identity. Level 2 processing
(Situation assessment)
According to the obtained result of previous level, a description of current relationships among entities and their relationship to the environment would be developed in order to determine the interpretation of the situation.
Level 3 processing (Impact assessment)
This level focuses on the estimation and prediction of alternative futures and hypotheses concerning the current situation to determine the potential impacts or threats.
Level 4 processing (Process refinement)
This level is a meta-process that monitors the whole data fusion process to optimize the utilization of data sources and algorithms and improve the performance of the ongoing data fusion.
Level 5 processing (Cognitive refinement)
Level 5 focuses on transforming the result of data fusion in to the displays and understandable information for the user and improvement of human/computer effectiveness.
2.3
Related Work
Data fusion techniques have been used for a long time in the MS domain. The majority of studies focused on target tracking, tactical situation awareness and threat assessment (Akselrod, Tharmarasa, Kirubarajan, Zhen Ding, & Ponsford, 2009; Bick & Barock, 2005; Danu, Sinha, Kirubarajan, Farooq, & Brookes, 2007; Di Lallo et al., 2006; Gad, 2009; Giompapa, Farina, Gini, Graziano, & Di Stefano, 2007; Giompapa et al., 2008; Hatch, Kaina, Mahler, & Myre, 1998; Henrich, Kausch, & Opitz, 2004; Jouan, Valin, Gagnon, & Bosse, 1999; Lefebvre & Helleur, 2001; Maresca et al., 2010; Vespe, Sciotti, & Battistello, 2008). Typically, in these works the combination of two or more sensors such as: Automatic Identification System (AIS), Infrared (IR), video camera, Synthetic Aperture Radar (SAR), Vessel Traffic Service (VTS) radar, Over The Horizon (OTH) radar, High Frequency Surface Wave Radar (HFSWR) and microwave radar is used and the surveillance area is limited to the coastal regions.
In recent years, the number of studies that address the use of AD in the MS domain is increasingly growing. AD techniques are divided into two groups, namely data-driven and knowledge-driven approaches. There are a couple of works that proposed knowledge-based systems with different representation techniques and reasoning paradigms such as rule-based, description logic and case-based reasoning (Guyard, Roy, & Defence R&D Canada-Valcartier, 2009; Nilsson, van Laere, Ziemke, & Edlund, 2008; Roy & Davenport, 2010). A prototype for a rule-based expert system based on the maritime domain ontologies was developed (Edlund, Gronkvist, Lingvall, & Sviestins, 2006) that could detect some of the anomalies regarding the spatial and kinematic relation between objects such as simple scenarios for hijacking, piloting and smuggling. Another rule-based prototype was developed
6
by Defense R&D Canada (Roy, 2008, 2010). The aforementioned prototype employed various maritime situational facts about both the kinematic and static data in the domain to make a rule-based automated reasoning engine for finding anomalies. One of the popular data-driven AD approaches is the Bayesian network (Fooladvandi, Brax, Gustavsson, & Fredin, 2009; Johansson & Falkman, 2007; Lane, Nevell, Hayward, & Beaney, 2010). Johansson and Falkman (2007) used the kinematic data for creating the network; however, in the work that was done by Fooladvandi et al. (2009) expert’s knowledge as well as the kinematic data was utilized in the detection process. Moreover, Lane et al. (2010) presented five unusual vessel behaviors and the way of formulating them in an AD system that the estimation of the overall threat was performed by using a Bayesian network. Unsupervised learning techniques have been widely used for data-driven AD such as Trajectory Clustering (Dahlbom & Niklasson, 2007), Self Organizing Map (Riveiro, Johansson, Falkman, & Ziemke, 2008) and fuzzy ARTMAP neural network (Rhodes, Bomberger, Seibert, & Waxmamn, 2005). Some statistical approaches, such as Gaussian mixture model (Laxhammar, 2008), hidden Markov model (Andersson & Johansson, 2010), adaptive kernel density estimator (Ristic, La Scala, Morelande, & Gordon, 2008) and precise/imprecise state-based anomaly detection (Dahlbom & Niklasson, 2007) have been used in this context. The majority of the works that have been done in the context of AD only used the AIS data.
There are a number of studies that employed data fusion techniques to fuse data from different sensors in AD systems (Carthel et al., 2007; Guerriero, Willett, Coraluppi, & Carthel, 2008; Rhodes, Bomberger, Seibert, & Waxman, 2006; Vespe, Sciotti, Burro, Battistello, & Sorge, 2008). In these studies, the surveillance area was restricted to the coastal regions and the combination of data from AIS, SAR, IR, video and radar was used in the fusion process to obtain the vessel tracks. Furthermore, there are some other works that focused on the fusion of both sensor and non-sensor data (Andler et al., 2009; Ding, Kannappan, Benameur, Kirubarajan, & Farooq, 2003; Fooladvandi et al., 2009; Lefebvre & Helleur, 2004; Mano, Georgé, & Gleizes, 2010; Riveiro & Falkman, 2009). For example, Lefebvre and Helleur (2004) and Riveiro and Falkman (2009) treated the expert’s knowledge as the non-sensor data. Riveiro and Falkman (2009) introduced a normal model of vessel behavior based on AIS data by using self organizing map and a Gaussian mixture model. According to the model, the expert’s knowledge about the common characteristic of the maritime traffic was captured as IF-THEN rules and the AD procedure was supposed to find the deviation from the expected value in the data. Lefebvre and Helleur (2004) fused radar data with user’s knowledge about the vessels of interests. The sensor data were modeled as track and the non-sensor data were modeled as templates. The track-template association was done by defining mathematical models for tracks and using fuzzy membership functions for association possibilities. Mano et al. (2010) proposed a prototype for the MS system that could collect data from different types of sensors and databases and regroup them for each vessel. Sensors like AIS, HFSWR and classical radars and databases such as environmental database, Lloyd’s Insurance and TF2000 Vessel DB were included in this prototype. By using multi-agent technology an agent was assigned to each vessel and anomalies could be detected by employing a rule-based inference engine. When the combination of anomalies exceeded a threshold, vessel status was informed to the user as an anomaly. The work presented by Ding, Kannappan, Benameur, Kirubarajan and Farooq (2003), proposed the architecture of a centralized integrated maritime surveillance system for the Canadian coasts. Sensors and databases included in this architecture were: HFSWR, ADS (Automatic Dependant Surveillance) reports, visual reports, information sources, microwave radar and radar sat. A common data structure was defined for storing data that were collected from different sensors. Andler et al. (2009) also described a conceptual MS system that integrated all available information such as databases and sensor systems (AIS, LRIT, intelligence reports, registers/databases of vessels, harbors, and crews) to help user to detect and visualize anomalies in the vessel traffic data in a worldwide scale. Furthermore, the authors suggested using open data in addition to other resources in the fusion process.
7
In conclusion, the main focus of the projects that have been done in the context of AD in the MS domain was related to using sensors data and mainly the AIS data to find the anomalies in the coastal region. Detection of some suspicious activities such as smuggling requires vessel traffic data beyond the coastal region. Maritime authorities in each country have overall information of maritime activities in their surveillance area. But exchanging information among different countries is a complicated procedure because of the diverse regulation of data protection in each land. Therefore, using data sources that are free from legislative procedures can be a good solution for providing information that belongs to the regions outside the land territory. Furthermore, all the information about maritime activities is not recorded in the authorities’ databases or reported to them. On the other hand, there are numerous open data sources consists of different websites, blogs and social networks that can be useful for observing the hidden aspects of maritime activities. Hence, this thesis will investigate the potential open data sources for maritime activities and exploit them to build an AD system.
3.
R
ESEARCH METHODOLOGY
This thesis starts by investigating the applicable open data sources for AD in the MS domain. Then, potential maritime anomalies that can be detected by the obtained open data sources and the way that the open data can be applied to the AD process are identified. The next step is to design and implement an anomaly detector system that can use open data in the detection process. For this purpose, a general framework for AD based on using both open and closed data sources in the MS domain is proposed. Then, an anomaly detector system is developed according to the proposed framework. In order to understand to what extent the system results are valid, the system is evaluated in real life by the subject matter experts from the Swedish Coastguard. However, the system accuracy should be evaluated before using the system in real life. Therefore, an experiment is conducted to measure the system accuracy. The following sections describe these steps in detail.
3.1
Open Data in the MS Domain
Applicable data sources for AD in the MS domain can be divided into three categories. The first and main category consists of sensors. Sensors provide kinematic data for each object in their coverage area and can be categorized as passive and active. Active sensors do not require cooperation from objects and collect the data by active probing the environment such as radar and sonar (A. M. Ponsford et al., 2009). However, passive sensors rely on the data that are broadcasted by objects intentionally such as AIS or unintentionally such as Electronic Intelligence (ELINT) and SIGnal INTelligence (SIGINT) systems (A. M. Ponsford et al., 2009). More information about the main maritime sensors can be found in (İnce, Topuz, & Panayirci, 1999; Vespe, Sciotti, & Battistello, 2008). The second category of data sources includes the authorized databases which contain information about vessels, cargos, crew, etc1
1 Integrated maritime policy for the EU : Working document III on maritime surveillance systems. Retrieved from
. The first and second categories are only accessible to the maritime authorities such as the Coastguard and can be referred as closed data sources. The third category belongs to the open data sources which are publicly available via the Internet and are free to access or reuse. These data sources consists of vessels traffic data and reports or news that are related to the maritime domain and can be found in different blogs, websites or social networks.
8
To obtain the applicable open data for AD, the first step is started by looking through the information resources document1
3.2
Identification of Maritime Anomalies
provided by the International Maritime Organization (IMO). IMO is the United Nations specialized agency with responsibility for the safety and security of shipping and the prevention of marine pollution by vessels. The document introduces 29 governmental and intergovernmental organizations that work in different fields related to the MS domain such as maritime safety, prevention of pollution from vessels, liability and insurance issues, shipping information, etc. All these 29 organizations’ websites and the links provided by each of them are investigated and a list of online data sources is prepared. The prepared list contains data sources that have information that can be qualified for the MS purpose such as information related to AIS, vessel characteristics, ports, maritime companies, suppliers’ information, weather, etc. Table A.1 of Appendix A, presents the obtained data sources. These sources of data are available online but having access to some of them needs non-free registration. Moreover, in the process of finding open data sources, it is attempted to obtain sources of data that are related to the Baltic region and mostly Sweden by use of the previously observed data sources and also Google search engine.
An important aspect of the literature review is to find out more about the potential maritime anomalies. The main sources of information about maritime anomalies are reports of the two workshops that were held in Canada (Roy, 2008) and Sweden (Andler et al., 2009; van Laere & Nilsson, 2009). In these two workshops attendees were experts in the maritime domain and a variety of maritime anomalies were identified. The outcome of the Swedish workshop was the identification of the 31 most desired anomalous behaviors for the Swedish stakeholders. The identified anomalies belong to the following categories: tampering, owner/crew, history, rendezvous (object, location), movement and cargo. The outcome of the Canadian workshop was a taxonomy of maritime anomalies that categorized anomalies as static and dynamic. Static anomalies were related to the vessel characteristics such as name, IMO number, etc. Dynamic anomalies were divided into two groups, kinematic and non-kinematic anomalies. The non-kinematic anomalies included anomalies related to location, course, speed, reporting and maneuver of vessels. The non-kinematic anomalies were related to passengers, crew list, cargo list, last port of call and next port of call.
According to the identified anomalies by the two workshops, a list of some potential maritime anomalies that can be detected by use of the available open data sources is prepared. Then, in a meeting with representatives of the Swedish Coastguard the types of anomalies that are interesting for them and the possibility of using open data for AD are discussed. During the meeting the prepared list of anomalies is presented and they are asked about the possibility of occurrence and their degree of interest for each anomaly. As an outcome of the meeting a number of scenarios are created and based on them 11 rules are defined. The first scenario refers to the anomalies related to the vessel static information such as name, owner, IMO number, dimensions, type and the status (in service or laid up). For example, sailing a vessel with a draught of 22 meters over an area with a 9 meters depth or observing a vessel that should be laid up or changing the name or the owner of a vessel during its voyage indicate the existence of suspicious activities. The second scenario is related to the prior arrival notification for vessels. Vessels should inform their arrival time to the ports at least 24 hours in advance. Each port also provides an online timetable for the incoming vessels. Therefore, any mismatch between the reported AIS data regarding the destination or the arrival time of a vessel and the destination port timetable needs to be checked by coastguards. The third scenario is related to ordering pilots. Usually, large vessels because of their size and weight need to be guided by pilots through dangerous and congested waters. Therefore, vessels need to submit their request for a pilot and also inform
1
Information resources on maritime security and ISPS code. Retrieved from
www.imo.org/knowledgecentre/informationresourcesoncurrenttopics/maritimesecurityandispscode/documents/inf ormation%20resources%20on%20maritime%20security%20and%20isps%20code.pdf
9
the destination port. However, in some cases vessels order a pilot without informing the port. Such situations should be investigated.
In the next meeting, the scenarios and the rules are presented to the representatives of the Swedish Coastguard and they are asked to comment or suggest new scenarios or rules. By getting the final approval from the Coastguard experts, one new rule (rule number 5) is added to the list. Table 2 shows the admitted rules by the experts. These identified maritime anomalies can be detected by use of AIS data, vessel traffic timetables in ports and pilots websites and the vessel characteristic data that are available in data sources such as Lloyd’s. A name is given to each anomaly that can be detected by the rules, and for the rest of this thesis anomalies will be referred by their names.
Table 2
The identified anomalies that can be detected by open data (confirmed by the Swedish Coastguard)
No. Expert rules Anomaly
1 If a vessel destination does not exist in the port schedule then anomaly.
VESSEL_NOT_INFORMED_PORT (A1)
2 If a vessel ETA does not match with the port ETA for the vessel then anomaly.
ARRIVAL_TIME_MISMATCHED (A2)
3 If a vessel entered a port without informing the port then anomaly.
VESSEL_ENTERED_PORT_WITHOUT_ NOTICE (A3)
4 If a vessel has requested a pilot but has not used the service then anomaly.
VESSEL_NOT_USED_PILOT (A4)
5 If vessel A which normally travels between ports X and Y, suddenly goes to port Z then anomaly.
UNUSUAL_TRIP_PATTERN (A5)
6 If a vessel has not left a port according to the port schedule then anomaly.
VESSEL_NOT_LEFT_PORT (A6)
7 If a vessel exists in a port schedule but it has not entered the port then anomaly.
VESSEL_NOT_ENTERED_PORT (A7)
8 If a vessel does not exist in the port schedule and the vessel has requested a pilot then anomaly.
VESSEL_ORDERED_PILOT_AND_ NOT_INFORMED_PORT (A8)
9 If a vessel has moored in a port and has been observed somewhere else then anomaly.
VESSEL_MOORED_IN_PORT (A9)
10 If vessel A has not entered a port according to the port schedule instead vessel B enters the port at the same time slot then anomaly.
WRONG_VESSEL_ENTERED (A10)
11 If a vessel with the laid up status has been observed somewhere else then anomaly.
VESSEL_LAID_UP (A11) Note. ETA = estimated time of arrival
10
3.3
Framework Design
The Open Data Anomaly Detection System (ODADS) is designed for traffic monitoring and detecting anomalies in the MS domain by using open and closed data sources. Figure 1 depicts the ODADS architecture. ODADS consists of three modules: 1) Data Collector, 2)
Anomaly Detector and 3) Display Client. The Data Collector module is responsible for
collecting open data from the Internet, preprocessing and storing the data in a database. The data can be related to vessel traffic (such as AIS reports, ports and pilots timetables), vessel characteristics, ports equipments and facilities, companies that are involved in maritime activities, news or reports about maritime events and activities available in different social media platforms (such as blogs and social networks), etc. The Data Store comprises a set of databases that contain data belong to different types of sensors, authorized databases and open data sources. The data in the Data Store can be fused or integrated before being used in the detection process. When the Data Collector completes its task, Anomaly Detector starts to work. The Anomaly Detector module analyzes the available data (open and closed data) and detects possible anomalies by utilizing both knowledge-driven and data-driven techniques. Different AD techniques are employed due to the distinct nature of anomalies and the complexity of the environment in the MS domain. Previously known anomalies can be detected by knowledge based techniques such as rule-based, but in real life an AD system must be able to detect the unseen anomalies, too. This is one of the benefits of using data-driven methods such as machine learning techniques. Therefore, detecting different types of anomalies seems to be possible by exploiting different techniques. The Display Client module is the user interface of the system. This module represents the cognitive refinement level (Level 5) of the JDL model. M. J. Hall, Hall and Tate (2000), argued that the effectiveness of a system can be affected by the way that the system produced information is comprehended by the human user. The cognitive refinement process involves traditional Human-Computer Interaction (HCI) utilities such as geographical display or advanced methods that support functionalities such as cognitive aids, negative reasoning enhancement, focus/defocus of attention and representing uncertainty. Section 3.4 describes the implementation details for each module.
Figure 1. The Open Data Anomaly Detection System (ODADS) architecture. The Data
Collector module collects data from the Internet and stores them in the database. The Anomaly Detector module detects anomalies by taking advantage of different techniques. The Display Client module displays the detected anomalies to the user and enables system-user interaction. Display Client Data Collector Anomaly Detector Knowledge-Driven Approaches Data-Driven Approaches Internet .... Weather Information Vessel Traffic
Vessels, ports and companies information
Social Networks
Data Store
Open data
11
3.4
Implementation
ODADS is implemented by taking advantage of the identified maritime anomalies and the obtained open data sources that were discussed in the previous sections. To limit the scope, first of all only four types of vessels: passenger, ferry, cargo and tanker are considered and other types of vessels such as fishing and sailing vessels, which ports usually do not provide any information about them, are omitted. Secondly, the rule related to the vessel static information is ignored. Furthermore, the WRONG_VESSEL_ENTERED anomaly is excluded due to its complexity. As well as the A1-A9 anomalies, in further collaboration with the Coastguard representatives during the implementation phase, a new type of anomaly is proposed. This anomaly is called UNDER_SURVEILLANCE_VESSEL and occurs when a vessel of interest has any of the A1-A9 anomalies and the vessel exists in the vessels blacklist.
3.4.1 Data Description
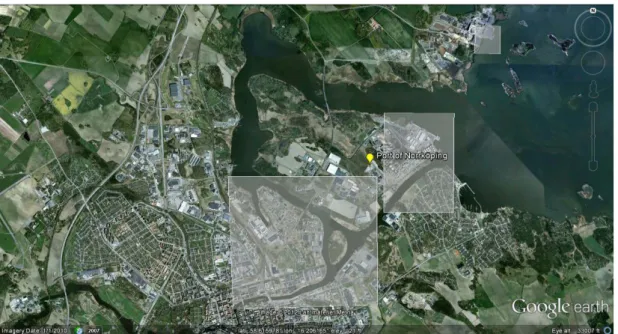
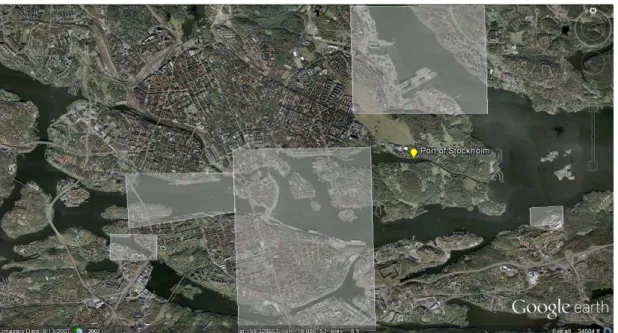
The required vessel traffic data can be obtained from AIS reports and ports and pilots timetables. The surveillance area is restricted to the north of the Baltic Sea and a part of the Gulf of Finland, the regional area between three European countries Sweden, Finland and Estonia. Figure 2 shows the surveillance area where the geographic coordinates lie between latitudes 58.49º - 60.24º N and longitudes16.19º – 25.00º E. This region is one of the high-traffic regions in the Baltic Sea and is surrounded by the four highly used ports. More information regarding each port can be found in Appendix B.
Figure 2. The area of interest is restricted to the north of the Baltic Sea and a part of the Gulf
of Finland. Ports from left to right are Norrköping, Stockholm group (Nynäshamn, Stockholm and Kapellskär), Helsinki and Tallinn (The image is adapted from Google Earth). 3.4.1.1 AIS data
Due to inaccessibility to the raw AIS data in this thesis, the AIS reports that are provided by the MarineTraffic.com website1
1
are exploited. These reports consist of both static and dynamic types of data for each vessel during its voyage. Vessel static data include name, type, built year, size, draught, flag, call sign, Maritime Mobile Service Identity (MMSI), IMO identification number, origin (last known port), destination, Estimated Time of Arrival (ETA) and dynamic data are related to speed (max and average), position (longitude and latitude), Course Over Ground (COG), heading.
12
Data Collector AIS Logger
Web Scraper
Database
AIS Reports Table
Port and Pilot Schedule Table
3.4.1.2 Ports and Pilots data
Ports timetables are obtained from the websites of the high-traffic ports in the area of interest: Stockholm group (Stockholm, Kapellskär and Nynäshamn) and Norrkoping ports in Sweden, Helsinki port in Finland and Tallinn port in Estonia. The pilots timetables belong to the vessel traffic in Stockholm pilotage area in Sweden. Table A.2 of Appendix A, presents each data source in detail.
3.4.2 Data Collector Module
The Data Collector module is responsible for extracting data from different open data sources via the Internet, data preprocessing and data storage. This module consists of two parts. The first part is the AIS Logger, a shell script program, which downloads and extracts the processed vessel AIS reports and tracks1
Figure 3. The Data collector module consists of two parts, AIS Logger that provides a list of
vessels in the area of interest and the Web Scraper, a program which gathers vessels details information and ports and pilots timetables from the Internet.
data from MarineTraffic.com website. Since the
MarineTraffic.com website updates the data at 10-minute intervals, data extraction is done
every 10 minutes and the collected data are stored in a file. When the file is prepared, the second part of the module, the Web Scraper, starts to work. It is a Java program that harvests data from different websites and stores them into the database. These data include ports and pilots timetables from their websites and the vessels details information from the Marinetraffic.com. Figure 3 illustrates the different parts of the Data Collector module.
3.4.2.1 Preprocessing
Data preprocessing can be performed by a number of techniques such as data cleaning to remove noise, data integration to merge multiple data sources into an understandable data, data transformation such as normalization to improve the accuracy and data reduction to eliminate the redundant features (Han et al., 2011).
In the first step of preprocessing, text values such as vessel name, origin, destination and company name are transformed to the same format (lowercase characters) and all special characters and whitespaces are removed. Since the data are collected from different sources in different countries, time values are converted to Central European Time (CET). Every data source has its own format of data representation. For instance, vessel arrival time in ports can be stored as two separated parts of date and time, a combination of date and time values or just as date. Moreover, some of the ports provide additional vessel information such as weight and length as well as the timetables. This diversity makes some parts of the provided data remain unused. Therefore, a common data representation format for ports and pilots data is defined that contains vessel name, vessel type, origin, destination, company name, vessel status and arrival/departure time.
1
13
Database
AIS Reports Table
Port and Pilot Schedule Table
History Anomaly Table
Anomaly Detector Data-Driven Approaches Statistical Techniques Knowledge-Driven Approaches Expert Rules
3.4.3 Database
The Database contains four tables to store the extracted open data: 1) AIS Reports table, 2) Ports and Pilots Schedule table, 3) Vessel Trip History table and 4) Detected Anomaly
table. There is also a table for storing vessels that are kept under surveillance because of
their previous involvement in the criminal activities. The under surveillance vessels data are provided by the Coastguard officer via the Display Client module and stored in the Blacklist
Table. The AIS Reports table contains the processed AIS data such as vessel name, type,
flag, origin, destination, etc. The Ports and Pilots Schedule table is used for storing the vessel data including arrival and departure time gathered from ports and pilots data sources. In the Vessel Trip History table, data related to the frequency of vessels trips between different ports are stored and the Detected Anomaly table contains the history of all types of detected anomalies.
3.4.4 Anomaly Detector Module
The Anomaly Detector module is the main part of the system which employs different techniques to detect anomalies. After investigating the nature of the anomalies and the potential techniques, it is determined that except for the UNUSUAL_TRIP_PATTERN anomaly, the other types can be detected by exploiting search techniques. Detection of the UNUSUAL_TRIP_PATTERN anomaly requires data-driven approaches such as machine learning or statistical techniques and also a history of the vessel traffic data for training the system. In case of using machine learning techniques, the system will detect the anomaly by learning the normal vessel trip pattern and highlighting the unusual trip and by using statistical approaches the system will make decision based on the frequency or the possibility of a vessel trip between two different ports. The next section describes the detection algorithm for each anomaly in detail. This module is depicted in Figure 4.
Figure 4. The Anomaly Detector module
3.4.4.1 Algorithms
To define the appropriate detection algorithms, the first step is to specify what types of data are required for detecting each anomaly (Table A.3 of Appendix A). Detection of each individual anomaly (except the UNUSUAL_TRIP_PATTERN anomaly) can be done by performing a search in the specified data for finding the desired match. If the match is not found then the vessel would be marked as an anomaly. Appendix C gives a detailed description about each algorithm. Algorithm 1 shows the main procedure of the Anomaly Detector module. Algorithms 2-4 and 6-8 present the described search process in detail. For the UNUSUAL_TRIP_PATTERN anomaly, data related to six months (September 15, 2011- March 15, 2012) of vessel traffic in the surveillance area are gathered. By monitoring the
14
activities during this period, the system will be able to find the normal pattern of vessels trips in the area of interest. For detecting this anomaly a simple statistical approach is used. A look up table is created and for each vessel the number of times that the vessel travels between two different ports is stored. For each vessel, if the frequency of travelling between its origin and destination is less than a predefined threshold then the vessel will be reported as an anomaly. Algorithms 5 and 16 describe the process in detail.
After executing all the algorithms, the final type of anomaly for each vessel should be determined. There are some situations that multiple anomalies can occur in the same time for a specific vessel. These situations are presented in Table 5. For the combination of anomalies that do not have any feature in common new types of anomalies are defined.
Table 5
The combined anomalies
Anomaly Condition Anomaly Type
A1,A5 Vessel did not inform its arrival to the destination port and its trip to the port is not common.
UNUSUAL_TRIP_PATTERN_AND_ VESSEL_NOT_INFORMED_PORT
A1,A8 Vessel did not inform its arrival to the
destination port and it ordered a pilot. VESSEL_ORDERED_PILOT_AND_ NOT_INFORMED_PORT A1,A5,A8 Vessel did not inform its arrival to the
destination port, it ordered a pilot and its trip to the port is not common.
UNUSUAL_TRIP_PATTERN_AND_ VESSEL_ORDERED_PILOT_AND_ NOT_INFORMED_PORT_
INFORMED_PORT A2,A4 Vessel has delay and it ordered a pilot but
did not use it.
VESSEL_ARRIVAL_TIME_
MISMATCHED_AND_VESSEL_NOT_ USED_PILOT
A2,A5 Vessel has delay and its trip to the port is not common.
UNUSUAL_TRIP_PATTERN_AND_ VESSEL_ARRIVAL_TIME_
MISMATCHED A2,A4,A5 Vessel has delay and it ordered a pilot but
did not use it and its trip to the port is not common.
UNUSUAL_TRIP_PATTERN_AND_ VESSEL_NOT_USED_PILOT_AND_ VESSEL_ARRIVAL_TIME_
MISMATCHED A3,A6 Vessel entered a port without prior
notification and has not left the port according to the plan.
VESSEL_ENTERED_PORT_ WITHOUT_NOTICE_AND_NOT_ LEFT_PORT_ON_TIME
A4,A5 Vessel ordered a pilot and informed to the port however it did not used the pilot and its trip to the port is not common.
UNUSUAL_TRIP_PATTERN_AND_ VESSEL_NOT_USED_PILOT A4,A7 Vessel ordered a pilot but did not use it
and it has not entered the port. VESSEL_NOT_ENTERED_PORT_ AND_NOT_USED_PILOT A4,A8 Vessel ordered a pilot but did not inform
the port and it did not use the pilot.
VESSEL_ORDERED_PILOT_AND_ NOT_INFORMED_PORT_AND_ VESSEL_NOT_USED_PILOT
15
Anomaly Condition Anomaly Type
A5,A7 Vessel trip to the destination port is not
common and it has not entered the port. UNUSUAL_TRIP_PATTERN_AND_ VESSEL_NOT_ENTERED_PORT A7,A4,A5 Vessel ordered a pilot but did not use it
and has an unusual trip and it has not entered the port.
UNUSUAL_TRIP_PATTERN_AND_ VESSEL_NOT_ENTERED_PORT_ AND_VESSEL_NOT_USED_PILOT A8,A5 Vessel ordered a pilot but did not inform
the port and the trip to the destination port is not common.
UNUSUAL_TRIP_PATTERN_AND_ VESSEL_ORDERED_PILOT_AND_ NOT_INFORMED_PORT
A9,[A1-A8] Vessel uses the information that belongs to a moored vessel in a port; since the vessel provides unreal information, it is normal that other anomalies are set for this vessel.
VESSEL_MOORED_IN_PORT
A8,A4,A5 Vessel ordered a pilot but did not inform the port and the trip to the destination port is not common and the vessel also did not use the pilot.
UNUSUAL_TRIP_PATTERN_AND_ VESSEL_ORDERED_PILOT_AND_ NOT_INFORMED_PORT_AND_ VESSEL_NOT_USED_PILOT
3.4.4.2 String matching techniques
Using exact string matching techniques for comparing vessel information from different data sources is inapplicable due to the potential errors that might occur because of different notations or even human operator mistakes during data entry. Therefore, a metric should be used for measuring the degree of similarity between two vessels from different sources. For this purpose, some string comparison methods are evaluated such as Damerau-Levenshtein (D-L) also known as edit distance (Damerau, 1964; Levenshtein, 1966), the n-gram technique (P. A. V. Hall & Dowling, 1980), Jaro (Jaro, 1972, 1989) and JaroWinkler (Winkler, 1990). D-L or edit distance is equal to the minimum number of edits (substitution, delete, insert and transposition) required to change one string to the other. The use of n-gram for string matching is performed by first constructing the n-grams (contiguous sequences of n items) for each string and then comparing the n-grams of both strings in order to find the number of common n-grams. Jaro and JaroWinkler (a variant of Jaro) measure the number and order of common characters in two strings and also the number of transposition that is needed to change one of the strings to the other. Jaro metrics are more similar to the human decision making compared to the D-L distance (Denk & Hackl, 2003).
To evaluate these metrics, the D-L distance is implemented and for the other metrics
SimMetrics1
The collected data related to one day of vessel traffic in the area of interest are taken with distinct vessels names, origins and destinations and stored in separate groups. Then, the string matching methods are applied to each group by considering all pair wise combination of the elements in each group. To evaluate the results, the obtained similarities are sorted in ascending order and it is verified whether or not the values in each pair can be considered similar by a human operator. Two values are considered equal if they are exactly the same or a bit different because of misspellings or shortening. Finally, based on the results it is
, an open source library that contains a set of similarity metrics, is used.
Regarding the n-gram technique, choosing the length of n-grams is an important factor since it can affect the processing time and accuracy of the method. According to Salton and McGill (1986) and Zamora, Pollock, and Zamora (1981), trigram is one of the n-gram methods (when n=3) that can achieve the best results in retrieving similar words.
1
16
concluded that for the available data, JaroWinkler has the best performance among all the other metrics and its results are closer to reality. Jaro and D-L are the second and the third best respectively and trigram is the worst.
According to the degrees of similarity that are obtained from the result of JaroWinkler and the data characteristics, two similarity thresholds, one for the vessel name and the other for the origin/destination are defined. The vessel name similarity threshold is considered as 0.03 and value for the trip threshold is 0.06 (Given p as the similarity value, 0 ≤ p ≤ 1, p= 0 shows the exact match and p=1 indicates that the two strings are dissimilar). These thresholds are referred as VESSEL_NAME_SIMILARITY_THRESHOLD and TRIP_ SIMILARITY_THRESHOLD in Appendix C.
3.4.5 Display Client
The Display Client module is the graphical user interface of ODADS. It is a web-based application and supports the functionalities of the JDL Level 5 processing such as HCI utilities, cognitive aids and focus/defocus attention. While designing the user interface, the six principles of the user interface design that are based on the usage-centered design approach are considered. According to Constantine and Lockwood (1999), these principles are: structure, simplicity, visibility, feedback, tolerance, and reuse.
Figure D.1 of Appendix D presents a snapshot of the user interface. When a user logs in to the system, the main view of the ODADS user interface is displayed. It consists of a geographical display and four tabs, namely Anomaly, Dataset, Reports and Setting. The geographical display utilizes the Google maps API features to enable the vessel traffic monitoring in the area of interest. Vessels are represented on the map by different colors according to their types. Ferries and passenger vessels are green, cargo vessels are cyan and
tankers are yellow. In order to give a better perspective of the surveillance area, tug and pilot
vessels are also displayed on the map. The tug and pilot vessels are presented in gray and dark blue, respectively. By clicking on each vessel, an information window appears which contains the vessel information such as name, MMSI number, IMO number, flag, heading, origin, destination, EAT and anomaly type. The AD process is performed every 10 minutes and consequently, the map is updated and if any new anomaly is detected, the Anomaly tab becomes red in order to inform the user about the incoming suspicious activities. The newly detected anomalous vessels are displayed in red and the previously detected anomalies are shown in light red. The Anomaly tab presents the overall information about the number of detected anomalies, total number of vessels and the last data collection time. Moreover, anomalous vessels are shown in a table which has the search, pagination and zoom to map utilities. The Dataset tab shows the ports and pilots timetables within a time interval and in a common representation format. This common data representation format contains vessel information such as name, type, company name, origin, destination, time, status and the name of the data source. The Reports tab consists of two sections. The first section provides reports regarding the total number of each anomaly and detailed information about anomalous vessels in a time interval in the HTML or EXCEL formats. The second section presents graphical reports about daily statistics of the detected anomalies in a stacked chart and overall statistics of all detected anomalies in a pie chart. The Setting tab is designed for getting any kind of information or system settings from the user. In the current implementation this tab is responsible for presenting the information about vessels that should be kept under surveillance and providing the features to add, remove, edit or disable/enable a vessel. Any changes in this tab would be considered in the next period of the AD process.
The technologies that are used for implementing this module are Java, Spring Framework, JSP, JavaScript, jQuery and Google maps API.
17
3.5
Experimental Design
Before using ODADS in real life, it is important to figure out to what extent the results of the system are accurate. Accuracy is the degree to which the estimates or measurements of a quantity correctly describe the exact value of that quantity. In other words, accuracy is the proportion of true results in the population. To evaluate the system accuracy, the number of True Positives (TP), False Positives (FP), True Negatives (TN) and False Negatives (FN) are needed. Accuracy is calculated by the following formula (Han, Kamber, & Pei, 2011):
𝑎𝑐𝑐𝑢𝑟𝑎𝑐𝑦 = 𝑇𝑃 + 𝑇𝑁 𝑇𝑃 + 𝑇𝑁 + 𝐹𝑃 + 𝐹𝑁
The first step in designing the experiment is to identify the population. The population consists of the vessel traffic data in the surveillance area. Since the population is too large and it is impossible to look into all members manually to count the number of TP, FP, TN and FN, a sample should be taken from the population. The second step is to identify the sampling procedure. The important factors in sampling are the sampling frame, method and the sample size. The sampling frame consists of all members of the population that have the chance to be included in a sample and must be representative of the population. In this thesis the sampling frame is the vessel traffic data related to AIS, ports and pilots in the surveillance area, which are provided by ODADS. Due to the high volume of traffic through the surveillance area, it is expected that the majority of anomalies can be observed in one week execution of the system. Therefore, one week of vessel traffic data in April 2012 is used as the sample frame. For choosing a sampling method, it is important to decide whether or not to use probability sampling. In probability sampling, all members of the population have the chance of being selected in the sample. If the members have an equal probability of selection, the sample can be unbiased. In this thesis it is possible to perform a random sampling with equal probabilities. However, because of the ODADS periodic data collection (every 10 minutes), the data regarding to a specific vessel can be selected multiple times. To omit the effects of repeated data in a sample, a multistage sampling is performed. In the first stage, a simple random sampling without replacement is done for selecting the time slots that ODADS attempts to collect and analyze the data. After selecting the time slots, the corresponding data for each time slot will be selected by a stratified sampling. Three strata are defined according to the type of vessels: ferry and passenger, cargo and tanker vessels. Selection of vessels is also limited to the vessels that are originated from or targeted to the four particular ports.
The total number of time slots in the sample frame is 835. This means that on average, ODADS collects data 139 times a day. In the first stage of sampling a random timeslot is selected for each day, which results in 7 time slots for one week. Then, by considering the described limitation in the selection process, the average number of entire data in a selected time slot is about 100 records. Among these records, 30 records are selected by stratification. Almost 73 % of the vessels in each time slot are moored. Since the majority of the anomalies are related to the vessels trips, a limitation on the number of moored vessels in the samples is defined. In this way, it can be possible to check more anomalies in the evaluation process. The second stage of sampling is repeated by taking into consideration that the number of moored vessel in the sample cannot exceed from the half of the sample size (in this case 15).
3.6
Validation Design
After completing the implementation of ODADS, a meeting is held with the Coastguard representatives. During the meeting the system is presented and it is determined that ODADS will be used by the Coastguard officers for a period of time to verify the validity of the detected anomalies and evaluate the usefulness of such system for the Coastguard. Therefore, ODADS is installed on an Internet server and another meeting is arranged with
18
the Coastguard to define the validation process. As the outcome of the meeting, it is decided the validation will take place at the Coastguard headquarters office in Karlskrona, Sweden for four weeks (April 23, 2012 to May 18, 2012), at any time during working hours (08:00 to 17:00). The officers are supposed to evaluate the detected anomalies by checking them against the available data in the systems and data sources that are used during the normal operational activities at the Coastguard. They are asked to provide weekly report about their evaluation results in order to decrease the possible malfunctioning of the system and the validation process. An Excel form is provided to the officers in order to receive the reports in a common format. While investigating the validity of an alarm for a specific vessel, the following information should be reported: detection time, vessel information (such as name, MMSI and IMO), trip information, type of the alarm (true/false), systems or data sources that are used to investigate the detected anomaly. The Coastguard officers are also asked for providing any information about vessels that are marked as anomaly according to the available systems at the Coastguard, but ODADS is unable to recognize them. Although having such information is useful for analyzing the validation results, it is impossible for the Coastguard to provide this information. A detected anomaly for a vessel is true if it can be confirmed by the available data sources at the Coastguard and consequently it is false if the authorized data sources provide any information that declines the detected anomaly. No further assessment is done regarding the classification of the detected anomalies to true and false alarms.
4.
V
ALIDITY THREATS
In this thesis there are some issues that can threat the validity of the results and they should be considered before developing the system and performing the evaluation and validation. Construct validity refers to the extent to which the results of a study reflect the theory or the concept behind (Shadish, Cook, & Campbell, 2002). The main issue that may threat the construct validity is the design and reliability of implementation. Results can be affected by the potential faults that may happen in the implementation either because of programming faults or lack of tuning. In addition, the inaccurate nature of the open data that are used may have some effect on the results. The open data can have errors due to the human operator mistakes. They do not follow a similar format and can be unavailable for a while or are not updated immediately. To diminish the undesirable effect of the data, creating a common data representation format, filtering of the data and using approximate string matching techniques would be helpful. For decreasing the effect of programming faults, the validity of implemented application should be tested different times with both real and manipulated data that contain anomalies. There are also some parameters in the application that are needed to be selected correctly. For instance, in order to match the vessel information, string matching techniques are required and to determine that two strings are matched with each other, a similarity threshold should be used. Choosing an inappropriate value for such parameters will lead to incorrect results. The other threat of validity, which can occur while performing the evaluation and validation, targets both the internal and external validities. Internal validity ensures that the observed relationship between the treatment and outcome is due to a casual relationship and it is not because of an uncontrolled factor. External validity refers to the ability of generalizing the result of the study to other domains, times or places (Shadish et al., 2002). The threat to internal and consequently the external validity may occur if the data that are used in the evaluation process are biased and not representative of the population. In such situation generalizing the results of the treatments to the whole system is unrealistic. To prevent this issue, the samples, which are taken from the population in the experiment, should be real representative of the population. As well as the experiment, while performing the validation by the subject matter experts the same procedure for selecting and checking the detected anomalies should be followed.
19
5.
V
ERIFICATION
To ensure that ODADS works properly, the system is tested manually with both real and manipulated data. The tests are performed during the implementation and also after completing the system. At first, a number of vessels with different types of anomalies are inserted to the real collected data to check whether all types of anomalies can be detected by ODADS. Then, the system is run for a period of time and the detected anomalies are checked manually against the available data to make sure about their correctness. During the test phase the Anomaly Detector module is updated and some of the detection conditions are narrowed down. The process is repeated until the system can detect all the anomalies correctly.
Before starting the validation process, the system is used by the subject matter experts from the Coastguard and according to their comments some of the algorithms in the Anomaly Detector module are updated. For example, ferries usually provide their schedule monthly or once in a couple of months; therefore, their arrival is not always available in daily schedule of the ports and the VESSEL_NOT_INFORMED_PORT and UNUSUAL_ TRIP_PATTERN anomalies are often set for them. For this reason, these two anomalies will not be checked for ferries.
6.
E
XPERIMENTAL
R
ESULTS
The results of the system execution during the specified week are provided. To provide an overview of the detected anomalies by ODADS, Table 6 illustrates the total number of vessels in the surveillance area. Table 7 shows the number of detected types of anomaly for each day and finally Table 8 provides the total percentage of each anomaly type during that week.
Table 6
Total number of vessels in the surveillance area
Days
Avg
1 2 3 4 5 6 7
Total number of vessels 614 623 663 665 669 695 784 673.29 Cargo, Tanker, Passenger and Ferry vessels 345 349 365 369 370 372 394 366.29 Cargo, Tanker, Passenger and Ferry vessels
that are originated from or targeted to the specified ports
136 142 141 137 145 149 142 141.71
Table 7
Total and the average number of detected anomalies during one week of execution
Anomaly Days Avg 1 2 3 4 5 6 7 ARRIVAL_TIME_MISMATCHED 23 24 27 23 23 26 21 23.86 VESSEL_NOT_INFORMED_PORT 8 22 13 12 16 14 18 14.71 (Continued)