JHEP11(2016)112
Published for SISSA by SpringerReceived: June 8, 2016 Revised: September 28, 2016 Accepted: November 10, 2016 Published: November 21, 2016
Search for the Standard Model Higgs boson produced
by vector-boson fusion and decaying to bottom quarks
in
√
s = 8 TeV pp collisions with the ATLAS detector
The ATLAS collaboration
E-mail:
atlas.publications@cern.ch
Abstract: A search with the ATLAS detector is presented for the Standard Model Higgs
boson produced by vector-boson fusion and decaying to a pair of bottom quarks, using
20.2 fb
−1of LHC proton-proton collision data at
√
s = 8 TeV. The signal is searched for
as a resonance in the invariant mass distribution of a pair of jets containing b-hadrons in
vector-boson-fusion candidate events. The yield is measured to be −0.8 ± 2.3 times the
Standard Model cross-section for a Higgs boson mass of 125 GeV. The upper limit on the
section times the branching ratio is found to be 4.4 times the Standard Model
cross-section at the 95% confidence level, consistent with the expected limit value of 5.4 (5.7) in
the background-only (Standard Model production) hypothesis.
Keywords: Hadron-Hadron scattering (experiments), Higgs physics, proton-proton
scat-tering
JHEP11(2016)112
Contents
1
Introduction
1
2
The ATLAS detector
3
3
Data and simulation samples
3
4
Object reconstruction
4
5
Event pre-selection
5
6
Multivariate analysis
5
7
Invariant mass spectrum of the two b-jets
6
8
Sources of systematic uncertainty
9
8.1
Experimental uncertainties
10
8.2
Modelling uncertainties on the m
bbshape of the non-resonant background
10
8.3
Theoretical uncertainties
10
9
Statistical procedure and results
11
10 Cut-based analysis
13
11 Summary
15
The ATLAS collaboration
20
1
Introduction
Since the ATLAS and CMS collaborations reported the observation [
1
,
2
] of a new
par-ticle with a mass of about 125 GeV and with properties consistent with those expected
for the Higgs boson in the Standard Model (SM) [
3
–
5
], more precise measurements have
strengthened the hypothesis that the new particle is indeed the Higgs boson [
6
–
9
]. These
measurements were performed primarily in the bosonic decay modes of the new particle:
H → γγ, ZZ, W
+W
−. It is essential to study whether it also directly decays into fermions
as predicted by the SM. Recently CMS and ATLAS reported evidence for the H → τ
+τ
−decay mode at a significance level of 3.4 and 4.5 standard deviations, respectively [
10
–
12
],
and the combination of these results qualifies as an observation [
13
]. However, the H → b¯
b
decay mode has not yet been observed [
14
–
19
], and the only direct evidence of its existence
so far has been obtained by the CDF and D0 collaborations [
14
] at the Tevatron collider.
JHEP11(2016)112
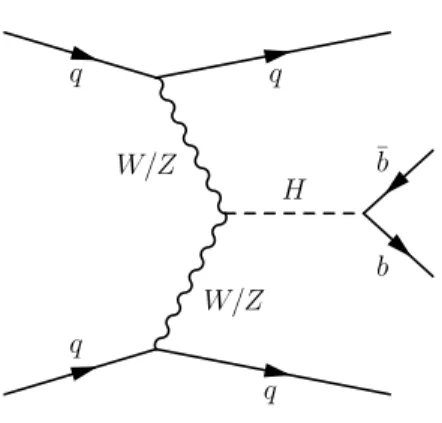
q q ¯b W/Z q H b W/Z qFigure 1. An example Feynman diagram illustrating vector-boson-fusion production of the Higgs boson and its decay to a b¯b pair.
The production processes of Higgs bosons at the LHC include gluon fusion (gg → H,
denoted ggF), vector-boson fusion (qq → qqH, denoted VBF), Higgs-strahlung (q ¯
q
0→
W H, ZH, denoted W H/ZH or jointly V H), and production in association with a
top-quark pair (gg → t¯
tH, denoted t¯
tH). While an inclusive observation of the SM Higgs
boson decaying to a b¯
b pair is difficult in hadron collisions because of the overwhelming
background from multijet production, the V H, VBF, and t¯
tH processes offer viable options
for the observation of the b¯
b decay channel. As reported in refs. [
15
–
19
], the leptonic decays
of vector bosons, the kinematic properties of the production process, and the identification
of top quarks are used to reduce the background for V H, VBF, and t¯
tH, respectively.
This article presents a search for VBF production of the SM Higgs boson in the b¯
b decay
mode (VBF signal or VBF Higgs hereafter) using data recorded with the ATLAS detector
in proton-proton collisions at a centre-of-mass energy
√
s = 8 TeV. The signal is searched
for as a resonance in the invariant mass distribution (m
bb) of a pair of jets containing
b-hadrons (b-jets) in vector-boson-fusion candidates. Events are selected by requiring four
energetic jets generated from the qqH → qqb¯
b process as illustrated in figure
1
: two
light-quark jets (VBF jets) at a small angle with respect to the beam line and two b-jets from the
Higgs boson decay in more central regions. Higgs bosons are colour singlets with no colour
line to the bottom quarks; thus little QCD radiation and hadronic activity is expected
between the two VBF jets, creating a rapidity gap between them. This feature is used
to distinguish signal events from multijet events, which form the dominant background
with a non-resonant contribution to the m
bbdistribution. Another relevant background
source arises from the decay of a Z boson to b¯
b in association with two jets (Z → b¯
b or Z
hereafter). This results in a resonant contribution to the m
bbdistribution.
To improve the sensitivity, a multivariate analysis (MVA) is used to exploit the
topol-ogy of the VBF Higgs final state. An alternative analysis is performed using kinematic cuts
and the m
bbdistribution. The selected sample contains a minor contribution from Higgs
boson events produced via the ggF process in association with two jets. These events
ex-hibit an m
bbdistribution similar to that of VBF Higgs events, and are treated as signal in
this analysis. The possible contribution of V H production to the signal was also studied
but found to be negligible compared to VBF and ggF Higgs production for this analysis.
JHEP11(2016)112
2
The ATLAS detector
The ATLAS experiment uses a multi-purpose particle detector [
20
] with a
forward-backward symmetric cylindrical geometry and a near 4π coverage in solid angle.
1It consists
of an inner tracking detector (ID) surrounded by a thin superconducting solenoid providing
a 2 T magnetic field, electromagnetic and hadronic calorimeters, and a muon
spectrome-ter (MS). The ID consists of silicon pixel and microstrip tracking detectors covering the
pseudorapidity range |η| < 2.5, and a transition radiation detector in the region |η| < 2.0.
Lead/liquid-argon (LAr) sampling calorimeters in the region |η| < 3.2 provide
electro-magnetic energy measurements with high granularity. A hadron (steel/scintillator-tile)
calorimeter covers the range |η| < 1.7. The end-cap and forward regions are instrumented
with LAr calorimeters for both the electromagnetic and hadronic energy measurements up
to |η| = 4.9. The MS surrounds the calorimeters and is based on three large air-core toroid
superconducting magnets with eight coils each. It includes a system of tracking chambers
covering |η| < 2.7 and fast detectors for triggering in the range |η| < 2.4. The ATLAS
trigger system [
21
] consists of three levels: the first (L1) is a hardware-based system, and
the second and third levels are software-based systems which are collectively referred to as
the high-level trigger (HLT).
3
Data and simulation samples
The data used in this analysis were collected by the ATLAS experiment at a
centre-of-mass energy of 8 TeV during 2012, and correspond to an integrated luminosity of 20.2 fb
−1recorded in stable beam conditions and with all relevant sub-detectors providing
high-quality data.
Events are primarily selected by a trigger requiring four jets with transverse momentum
p
T> 15 GeV at L1 and p
T> 35 GeV in the HLT, two of which must be identified as b-jets
by a dedicated HLT b-tagging algorithm (HLT b-jets). This trigger was available during
the entire 2012 data-taking period. Two triggers designed to enhance the acceptance for
VBF H → b¯
b events (VBF Higgs triggers) were added during the 2012 data-taking period.
They require either three L1 jets with p
T> 15 GeV where one jet is in the forward region
(|η| > 3.2), or two L1 jets in the forward region with p
T> 15 GeV. These criteria are
completed by the requirement of at least one HLT b-jet with p
T> 35 GeV. The VBF Higgs
triggers were used for a data sample corresponding to an integrated luminosity of 4.4 fb
−1,
resulting in an approximately 25% increase of the signal acceptance.
VBF and ggF Higgs boson signal events and Z boson background events are modelled
by Monte Carlo (MC) simulations. The signal samples with a Higgs boson mass of 125 GeV
are generated by Powheg [
22
–
24
], which calculates the VBF and ggF Higgs production
processes up to next-to-leading order (NLO) in α
S. Samples of Z boson + jets events
1
ATLAS uses a right-handed coordinate system with its origin at the nominal interaction point (IP) in the centre of the detector and the z-axis along the beam pipe. The x-axis points from the IP to the centre of the LHC ring, and the y-axis points upwards. Cylindrical coordinates (r, φ) are used in the transverse plane, φ being the azimuthal angle around the z-axis. The pseudorapidity is defined in terms of the polar angle θ as η = − ln tan(θ/2). Angular distance is measured in units of ∆R ≡p(∆η)2+ (∆φ)2.
JHEP11(2016)112
are generated using MadGraph5 [
25
], where the associated jets are produced via strong
or electroweak (EW) processes including VBF, and the matrix elements are calculated
for up to and including three partons at leading order. For all simulated samples, the
NLO CT10 parton distribution functions (PDF) [
26
] are used. The parton shower and the
hadronisation are modelled by Pythia8 [
27
], with the AU2 set of tuned parameters [
28
,
29
]
for the underlying event.
The VBF Higgs predictions are normalised to a cross-section calculation that
in-cludes full NLO QCD and EW corrections and approximate next-to-next-to-leading-order
(NNLO) QCD corrections [
30
]. The NLO EW corrections also affect the p
Tshape of the
Higgs boson [
31
]. The p
Tshape is reweighted, based on the shape difference between Hawk
calculations without and with NLO EW corrections included [
32
,
33
].
The overall normalisation of the ggF process is taken from a calculation at NNLO in
QCD that includes soft-gluon resummation up to next-to-next-to-leading logarithmic terms
(NNLL) [
30
]. Corrections to the shape of the generated p
Tdistribution of Higgs bosons are
applied to match the distribution from the NNLO calculation with the NNLL corrections
provided by the Hres program [
34
,
35
]. In this calculation, the effects of finite masses
of the top and bottom quarks are included and dynamic renormalisation and factorisation
scales are used. A reweighting is derived such that the inclusive Higgs p
Tspectrum matches
the Hres prediction, and the Higgs p
Tspectrum of events with at least two jets matches
the the Minlo hjj [
36
] prediction, the most recent calculation in this phase space.
The ATLAS simulation [
37
] of the detector is used for all MC events based on the
Geant4 program [
38
] except for the response of the calorimeters, for which a parameterised
simulation [
39
] is used. All simulated events are generated with a range of minimum-bias
interactions overlaid on the hard-scattering interaction to account for multiple pp
inter-actions that occur in the same or neighbouring bunch crossings (pile-up). The simulated
events are processed with the same reconstruction algorithms as the data. Corrections are
applied to the simulated samples to account for differences between data and simulation
in the trigger and reconstruction efficiencies and in pile-up contributions.
4
Object reconstruction
Charged-particle tracks are reconstructed with a p
Tthreshold of 400 MeV. Event vertices
are formed from these tracks and are required to have at least three tracks. The primary
vertex is chosen as the vertex with the largest Σ p
2Tof the associated tracks.
Jets are reconstructed from topological clusters of energy deposits, after noise
sup-pression, in the calorimeters [
40
] using the anti-k
talgorithm [
41
] with a radius parameter
R = 0.4. Jet energies are corrected for the contribution of pile-up interactions using a
jet-area-based technique [
42
], and calibrated using p
T- and η-dependent correction factors
determined from MC simulations and in-situ data measurements of Z+jet, γ+jet and
mul-tijet events [
43
,
44
]. To suppress jets from pile-up interactions, which are mainly at low
p
T, a jet vertex tagger [
45
], based on tracking and vertexing information, is applied to jets
with p
T< 50 GeV and |η| < 2.4.
JHEP11(2016)112
Process
Cross-section × BR [pb]
Acceptance
VBF H → b¯
b
0.9
6.9 ×10
−3ggF H → b¯
b
11.1
4.2 ×10
−4Z → b¯
b + 1, 2, or 3 partons
5.9 ×10
23.1 ×10
−4Table 1. Cross-sections times branching ratios (BRs) used for the VBF and ggF H → b¯b and Z → b¯b MC generation, and acceptances of the pre-selection criteria for simulated samples.
The b-jets are identified (b-tagged) by exploiting the relatively long lifetime and large
mass of b-hadrons. The b-tagging methods are based on the presence of tracks with a large
impact parameter with respect to the primary vertex, and secondary decay vertices. This
information is combined into a single neural-network discriminant [
46
]. This analysis uses
a b-tagging criterion that, in simulated t¯
t events, provides an average efficiency of 70% for
b-jets and a c-jet (light-jet) mis-tag rate less than 20% (1%).
5
Event pre-selection
Events with exactly four jets, each with p
T> 50 GeV and |η| < 4.5, are retained. The
four jets are ordered in η such that η
1< η
2< η
3< η
4. The jets associated with η
1and
η
4are labelled as VBF jets (or J 1 and J 2). The other two jets associated with η
2and η
3(Higgs jets or b1 and b2) are required to be within the tracker acceptance (|η| < 2.5), and
to be identified as b-jets. The two Higgs jets must be matched to the HLT b-jets for events
satisfying the primary trigger; for events satisfying the VBF Higgs triggers, one of the two
Higgs jets is required to be matched to an HLT b-jet. The 50 GeV cut on jet p
Tshapes
the m
bbdistribution for non-resonant backgrounds, creating a peak near 130 GeV, which
makes the extraction of a signal difficult. This shaping is removed by requiring the p
Tof
the b¯
b system to exceed 100 GeV. Table
1
summarises the acceptances of these pre-selection
criteria, for the VBF and ggF Higgs MC events [
30
,
47
] and the Z MC events.
For the pre-selected events, corrections are applied to improve the b-jet energy
mea-surements. If muons with p
T> 4 GeV and |η| < 2.5 are found within a b-jet, the
four-momentum of the muon closest to the jet axis is added to that of the jet (after correcting
for the expected energy deposited by the muon in the calorimeter material). Such muons
are reconstructed by combining measurements from the ID and MS systems, and are
re-quired to satisfy tight muon identification quality criteria [
48
]. In addition, a p
T-dependent
correction of up to 5% is applied to account for biases in the response due to resolution
effects. This correction is determined from simulated W H/ZH events following ref. [
15
].
6
Multivariate analysis
A Boosted Decision Tree [
49
,
50
] (BDT) method, as implemented in the Toolkit for
Multi-variate Data Analysis package [
51
], is used to exploit the characteristics of VBF production.
The BDT is trained to discriminate between VBF Higgs signal events and non-resonant
JHEP11(2016)112
background events modelled using the data in the sideband regions of the m
bbdistribution
(70 < m
bb< 90 GeV and 150 < m
bb< 190 GeV).
The input variables of the BDT are chosen to exploit the difference in topologies
between signal events and background events while keeping them as uncorrelated as possible
with m
bb, to ensure that the sideband regions provide a good description of the non-resonant
background in the signal region. In order of decreasing discrimination power, which is
determined by removing variables one by one from the analysis, the variables are: the jet
widths of VBF jets having |η| < 2.1 (the jet width is defined as the p
T-weighted angular
distance of the jet constituents from the jet axis, and is set to zero if |η| > 2.1), which
differs on average for quark and gluon jets; the scalar sum of the p
Tof additional jets with
p
T> 20 GeV in the region |η| < 2.5, Σp
jetsT; the invariant mass of the two VBF jets, m
J J;
the η separation between the two VBF jets, ∆η
J J; the maximum |η| of the two VBF jets,
max(|η
J 1|, |η
J 2|); the separation between the |η| average of the VBF jets and that of the
Higgs jets, (|η
J 1| + |η
J 2|)/2 − (|η
b1| + |η
b2|)/2; and the cosine of the polar angle of the cross
product of the VBF jets momenta, cos θ, which is sensitive to the production mechanism.
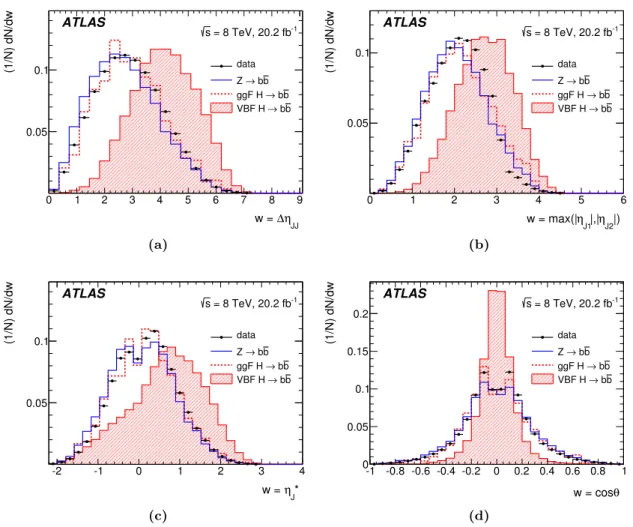
Figures
2
and
3
show the distributions of the BDT input variables in the data and the
simulated samples for the VBF H → b¯
b, ggF H → b¯
b, and Z → b¯
b events that satisfy the
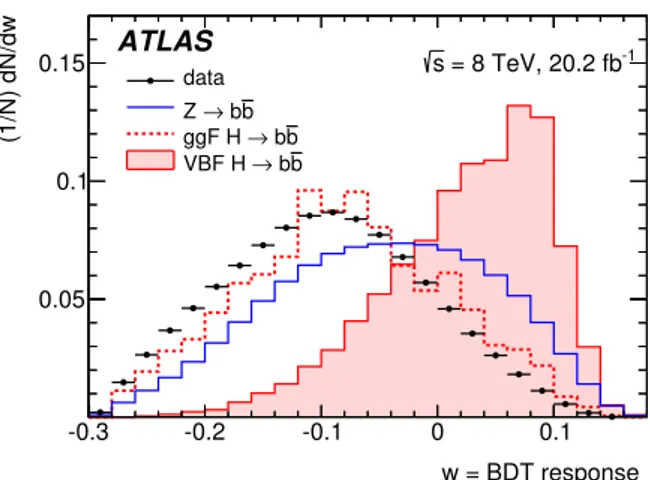
pre-selection criteria. The BDT responses to the pre-selected data and simulated events
are compared in figure
4
. As expected, the BDT response to the VBF Higgs signal sample
is significantly different from its response to the data, which are primarily multijet events,
and also from its response to the Z and ggF Higgs samples.
7
Invariant mass spectrum of the two b-jets
The signal is estimated using a fit to the m
bbdistribution in the range 70 < m
bb< 300 GeV.
The contributions to the distribution include H → b¯
b events, from either VBF or ggF
production; Z → b¯
b events produced in association with jets; and non-resonant processes
such as multijet, t¯
t, single top, and W +jets production. In order to better exploit the
MVA discrimination power, the fit is performed simultaneously in four categories based on
the BDT output. The boundaries of the four categories, shown in table
2
, were optimised
by minimising the relative statistical uncertainties,
pN
sig+ N
bg/N
sig, where N
sigand N
bgare the expected numbers of signal and background events, respectively. Table
2
shows, for
each category, the total number of events observed in the data and the number of Higgs
events expected from the VBF and ggF production processes, along with the number of Z
events expected in the entire mass range. The categories in table
2
are listed in order of
increasing sensitivity.
The shapes of the m
bbdistributions for Higgs and Z boson events are taken from
simu-lation. Their shapes in the four categories are found to be comparable; therefore the
inclu-sive shapes are used. The m
bbshapes for VBF and ggF Higgs boson events are similar, as
expected. In order to minimise the effects of the limited MC sample size, the resulting m
bbhistograms for Higgs and Z events are smoothed using the 353QH algorithm [
52
]. The m
bbdistributions used in the fit are shown in figure
5
. The Higgs yield is left free to vary. The Z
yield is constrained to the SM prediction within its theoretical uncertainty (see section
8.3
).
JHEP11(2016)112
w = Calorimeter width J1, J2 0 0.05 0.1 0.15 0.2 0.25 0.3 (1/N) dN/dw 0.1 0.2 0.3 0.4 ATLAS -1 = 8 TeV, 20.2 fb s data b b → Z b b → ggF H b b → VBF H (a) [GeV] jets T p Σ w = 0 20 40 60 80 100 120 140 (1/N) dN/dw -2 10 -1 10 1 ATLAS -1 = 8 TeV, 20.2 fb s data b b → Z b b → ggF H b b → VBF H (b) [GeV] JJ w = m 0 500 1000 1500 2000 2500 3000 3500 (1/N) dN/dw 0.05 0.1 0.15 0.2 ATLAS -1 = 8 TeV, 20.2 fb s data b b → Z b b → ggF H b b → VBF H (c)Figure 2. Distributions of the BDT input variables from the data (points) and the simulated samples for VBF H → b¯b events (shaded histograms), ggF H → b¯b events (open dashed histograms) and Z → b¯b events (open solid histograms). The pre-selection criteria are applied to these samples. The variables are: (a) the jet widths for the VBF jets having |η| < 2.1 (the jet width is set at zero if |η| > 2.1); (b) the scalar sum of the pTof additional jets with pT> 20 GeV in the region |η| < 2.5,
ΣpjetsT (the peak at zero represents events without additional jets); and (c) the invariant mass of the two VBF jets, mJ J.
Process Pre-selection Category I Category II Category III Category IV (−0.08 to 0.01) (0.01 to 0.06) (0.06 to 0.09) (> 0.09)
VBF H → b¯b 130 39 33 23 19
ggF H → b¯b 94 31 8.5 3.8 1.6
Z → b¯b 3700 1100 350 97 49
Data 554302 176073 46912 15015 6493
Table 2. Expected numbers of events for VBF and ggF H → b¯b and Z → b¯b processes, and the observed numbers of events in data with 70 < mbb< 300 GeV, after the pre-selection criteria are
applied, in the four categories of the BDT response. The categories are listed in order of increasing sensitivity. The values in the parentheses represent the boundaries of each BDT category.
JHEP11(2016)112
JJ η ∆ w = 0 1 2 3 4 5 6 7 8 9 (1/N) dN/dw 0.05 0.1 ATLAS -1 = 8 TeV, 20.2 fb s data b b → Z b b → ggF H b b → VBF H (a) |) J2 η |,| J1 η w = max(| 0 1 2 3 4 5 6 (1/N) dN/dw 0.05 0.1 ATLAS -1 = 8 TeV, 20.2 fb s data b b → Z b b → ggF H b b → VBF H (b) * J η w = -2 -1 0 1 2 3 4 (1/N) dN/dw 0.05 0.1 ATLAS -1 = 8 TeV, 20.2 fb s data b b → Z b b → ggF H b b → VBF H (c) θ w = cos -1 -0.8 -0.6 -0.4 -0.2 0 0.2 0.4 0.6 0.8 1 (1/N) dN/dw 0 0.05 0.1 0.15 0.2 ATLAS -1 = 8 TeV, 20.2 fb s data b b → Z b b → ggF H b b → VBF H (d)Figure 3. Distributions of the BDT input variables from the data (points) and the simulated samples for VBF H → b¯b events (shaded histograms), ggF H → b¯b events (open dashed histograms) and Z → b¯b events (open solid histograms). The pre-selection criteria are applied to these samples. The variables are: (a) the η separation between the two VBF jets, ∆ηJ J; (b) the maximum |η| of
the two VBF jets, max(|ηJ 1|, |ηJ 2|); (c) the separation between the |η| average of the VBF jets and
that of the Higgs jets, ηJ∗ = (|ηJ 1| + |ηJ 2|)/2 − (|ηb1| + |ηb2|)/2; and (d) the cosine of the polar angle
of the cross product of the VBF jets momenta, cos θ.
A data-driven method is used to model the m
bbdistribution of the non-resonant
back-ground. Data in the sidebands of the m
bbdistribution are fit simultaneously to a function
which is then interpolated to the signal region. The analytic forms considered are Bernstein
polynomials [
53
], combinations of exponential functions, and combinations of Bernstein
polynomials and exponential functions with various numbers of coefficients, and functions
with a χ
2probability greater than 0.05, that do not introduce a bias, are selected. For
each form, the minimum number of coefficients is determined by performing an F-test, and
the corresponding function is chosen as a candidate function. The fitted signal strength is
measured for each candidate function using toy samples. The function giving the smallest
bias is used as the nominal distribution. The function giving the second smallest bias is
JHEP11(2016)112
w = BDT response -0.3 -0.2 -0.1 0 0.1 (1/N) dN/dw 0.05 0.1 0.15 s = 8 TeV, 20.2 fb-1 data b b → Z b b → ggF H b b → VBF H ATLASFigure 4. Distributions of the BDT response to the data (points) and to the simulated samples for VBF H → b¯b events (shaded histogram), ggF H → b¯b events (open dashed histogram) and Z → b¯b events (open solid histogram). The pre-selection criteria are applied to these samples.
[GeV] bb m 40 60 80 100 120 140 160 180 Entries / 5 GeV 2 4 6 8 10 ATLAS Simulation Category IV b b → Z b b → ggF H b b → VBF H
Figure 5. Simulated invariant mass distributions of two b-jets from decays of Higgs bosons, summed for VBF (shaded histogram) and ggF (open dashed histogram) production, as well as from decays of Z bosons (open solid histogram), normalised to the expected contributions in category IV, which gives the highest sensitivity.
taken as an alternative distribution, and is used to estimate the systematic uncertainty due
to the choice of analytic function. The shapes of the m
bbdistributions are observed to be
different in the four categories. Bernstein polynomials of different degrees, fourth-order in
category I and third-order in the higher-sensitivity categories, are found to best describe
the m
bbshape of the non-resonant background. The nominal and alternative functions are
summarised in table
3
.
8
Sources of systematic uncertainty
This section discusses sources of systematic uncertainty: experimental uncertainties,
un-certainties on the modelling of the non-resonant background, and theoretical unun-certainties
JHEP11(2016)112
category I
category II
category III
category IV
Nominal
4
thPol.
3
rdPol.
3
rdPol.
3
rdPol.
Alternative
2
ndPol. × exponential
3 exponentials
2 exponentials
exponential
Table 3. Nominal and alternative functions describing the non-resonant background in the four BDT categories. The fourth-, third-, and second-order Bernstein polynomials are referred to as 4th
Pol., 3rd Pol., and 2nd Pol.
on the Higgs and Z processes. The uncertainties can affect the normalisation and the
kinematic distributions individually or both together.
8.1
Experimental uncertainties
The dominant experimental uncertainties on the Higgs signal yield arise from the statistical
uncertainty due to the finite size of the MC samples, the jet energy scale uncertainty, and
the b-jet triggering and tagging, contributing 15%, 10–20%, and 10% respectively, to the
total uncertainty on the Higgs yield. Limited MC sizes affect the normalisation via the
acceptance of the signal events and the shape of the signal m
bbdistribution.
Several
sources contribute to the uncertainty on the jet energy scale [
44
]. They include the in
situ jet calibration, pile-up-dependent corrections and the flavour composition of jets in
different event classes. The shape of the m
bbdistribution for the Higgs signal and the Z
background is affected by the jet energy scale uncertainty. Moreover, the change in the jet
energy modifies the value of the BDT output and can cause migration of events between
BDT categories. The b-jet trigger and tagging efficiencies are another source of systematic
uncertainty, contributing 10% to the total uncertainty. They are calibrated using multijet
events containing a muon and t¯
t events, respectively [
54
]. The uncertainty on the jet energy
resolution contributes about 4%. The uncertainty on the integrated luminosity, 1.9% [
55
],
is included, but is negligible compared to the other uncertainties mentioned above.
8.2
Modelling uncertainties on the m
bbshape of the non-resonant background
The uncertainties on the shape of the m
bbdistribution for the non-resonant background
is the largest source of systematic uncertainty, contributing about 80% to the total
uncer-tainty on the Higgs yield. The dominant contributions to this source come from the limited
number of events in the m
bbsidebands of the data used for the fit to the nominal function,
and from the choice of the function. For the latter, an alternative function is chosen for
each BDT region, as described in section
7
and listed in table
3
. Pseudo-data are generated
using the nominal functions and are fit simultaneously in the four BDT categories with
nominal and alternative functions. The bin-by-bin differences in the background yield
pre-dicted by the two alternative descriptions are used to estimate, by means of an eigenvector
decomposition, the corresponding systematic uncertainties.
8.3
Theoretical uncertainties
The uncertainties on the MC modelling of the Higgs signal events contribute about 10% to
the total uncertainty on the Higgs yield. The sources for these uncertainties are higher order
JHEP11(2016)112
QCD corrections, the modelling of the underlying event and the parton shower, the PDFs,
and the H → b¯
b branching ratio. An uncertainty on higher order QCD corrections for the
cross-sections and acceptances is estimated by varying the factorisation and renormalisation
scales, µ
Fand µ
R, independently by a factor of two around the nominal values [
31
] with
the constraint 0.5 ≤ µ
F/µ
R≤ 2. Higher order corrections to the p
Tspectrum of the Higgs
boson (described in section
3
) are an additional source of the modelling uncertainties.
This uncertainty is estimated by comparing the results between LO and NLO calculations
for VBF production and by varying the factorisation and renormalisation scales for ggF
production. Uncertainties related to the simulation of the underlying event and the parton
shower are estimated by comparing distributions obtained using Powheg+Pythia8 and
Powheg+Herwig [
56
]. The uncertainties on the acceptance due to uncertainties in the
PDFs are estimated by studying the change in the acceptance when different PDF sets such
as MSTW2008NLO [
57
] and NNPDF2.3 [
58
] are used or the CT10 PDF set parameters
are varied within their uncertainties. The largest variation in acceptance is taken as a
systematic uncertainty. The uncertainty on the H → b¯
b branching ratio, 3.2% [
47
], is also
accounted for.
The uncertainty on higher order QCD corrections to the Z → b¯
b yield is estimated
by varying the factorisation and renormalisation scales around the nominal value in the
manner described above. It is found to be about 40-50%, depending on the BDT category,
out of which about 25% is correlated. These correlated and uncorrelated uncertainties are
used to constrain the Z yield in the fit. This process results in about 20-25% to the total
uncertainty on the Higgs yield.
9
Statistical procedure and results
A statistical fitting procedure based on the RooStats framework [
59
,
60
] is used to estimate
the Higgs signal strength, µ, from the data, where µ is the ratio of the measured signal
yield to the SM prediction. A binned likelihood function is constructed as the product
of Poisson-probability terms of the bins in the m
bbdistributions, and of the four different
BDT categories.
The impact of systematic uncertainties on the signal and background expectations,
presented in section
8
, is described by a vector of nuisance parameters (NPs), ~
θ. The
expected numbers of signal and background events in each bin and category are
func-tions of ~
θ. For each NP with an a priori constraint, the prior is taken into account as a
Gaussian constraint in the likelihood. The NPs associated with uncertainties in the shape
and normalisation of the non-resonant background events, which do not have priors, are
determined from the data.
The test statistic q
µis constructed according to the profile-likelihood ratio:
q
µ= 2 ln(L(µ, ~
θ
µ)/L(ˆ
µ,
~ˆθ)),
(9.1)
where ˆ
µ and
θ are the parameters that maximise the likelihood, and ~
~ˆ
θ
µare the nuisance
parameter values that maximise the likelihood for a given µ. This test statistic is used
JHEP11(2016)112
Source of uncertainty
Uncertainty on µ
MVA
Cut-based
Experimental uncertainties
Detector-related
+0.2/−0.3
+1.6/−1.2
MC statistics
±0.4
±0.1
Theoretical uncertainties
MC signal modelling
±0.1
±1.3
Z yield
+0.6/−0.5
±1.4
Non-resonant background modelling
Choice of function
±1.0
±1.0
Sideband statistics
±1.7
±3.7
Statistical uncertainties
±1.3
Total
±2.3
+4.6/−4.4
Table 4. Summary of uncertainties on the Higgs signal strength for the MVA analysis, and for the cut-based analysis. They are estimated at the central values of the signal strength, µ = −0.8 and −5.2 for the MVA and cut-based analyses, respectively. The two systematic uncertainties accounting for non-resonant background modelling are strongly correlated. Their combined value for the MVA analysis is 1.8.
both to measure the compatibility of the background-only model with the data, and to
determine exclusion intervals using the CL
Smethod [
61
,
62
].
The robustness of the fit is validated by generating pseudo-data and estimating the
number of signal events for various values of µ. The results of the fit in the four categories
are shown in figure
6
. The Z yield is constrained to the SM prediction within its theoretical
uncertainty, using four independent constraints in the four BDT regions (uncorrelated
terms) and a common constraint (correlated term) as described in section
8.3
. The ratios
of Z yields to the SM predictions (µ
Z) are found to be compatible in all of the four BDT
regions. Combined over the four categories, the fit further constrains µ
Zto 0.7 ± 0.2.
The combined Higgs signal strength is −0.8 ± 2.3, where the uncertainty includes both
the statistical (±1.3) and systematic (+1.8/−1.9) components. The breakdown of the
systematic uncertainty on the estimated signal strength is given in table
4
. The correlation
coefficient between the combined µ and the combined µ
Zis found to be 0.22. In the absence
of a signal, the limit on the Higgs signal strength at 95% confidence level (CL) is expected
to be 5.4. When Standard Model production is assumed, the expected limit is found to be
5.7. The observed limit is 4.4.
The compatibility between the measured Z yield and its SM prediction is alternatively
tested by removing its a priori constraint from the fit. In this case a value of µ
Z= 0.3 ± 0.3
is extracted from the fit, to be compared to the theory prediction of 1.0 ± 0.4. The absence
of the Z constraint modifies the combined Higgs signal strength slightly, to −0.5 ± 2.3.
JHEP11(2016)112
Entries / 4 GeV 1000 2000 3000 4000 5000 6000 7000 8000 data Z component Higgs component non-resonant component (bkg) ATLAS Category I -1 = 8 TeV, 20.2 fb s [GeV] bb m 100 150 200 250 Data - Bkg -100 0 100 200 (a) Entries / 4 GeV 200 400 600 800 1000 1200 1400 1600 1800 2000 data Z component Higgs component non-resonant component (bkg) ATLAS Category II -1 = 8 TeV, 20.2 fb s [GeV] bb m 100 150 200 250 Data - Bkg -50 0 50 100 (b) Entries / 4 GeV 100 200 300 400 500 600 700 data Z component Higgs component non-resonant component (bkg) ATLAS Category III -1 = 8 TeV, 20.2 fb s [GeV] bb m 100 150 200 250 Data - Bkg -50 0 50 100 (c) Entries / 4 GeV 50 100 150 200 250 300 data Z component Higgs component non-resonant component (bkg) ATLAS Category IV -1 = 8 TeV, 20.2 fb s [GeV] bb m 100 150 200 250 Data - Bkg -40 -20 0 20 40 (d)Figure 6. Results of the profile-likelihood fit to the mbbdistributions in the four BDT categories.
The points represent the data, and the histograms represent the non-resonant background, Z, and Higgs contributions. In the lower panels, the data after subtraction of the non-resonant back-ground (points) are compared with the fit to the Z (open histogram) and Higgs (shaded histogram) contributions.
10
Cut-based analysis
An alternative analysis is performed based on kinematic cuts. While the MVA performs
a simultaneous fit to the m
bbdistributions of the four samples categorised by the BDT
response, the cut-based analysis performs a fit to one m
bbdistribution of the entire sample
in the mass range between 70 GeV and 300 GeV. Events are required to satisfy kinematic
criteria featuring the VBF Higgs final state. Events must not have any additional jet with
p
T> 25 GeV and |η| < 2.4, and must satisfy |∆η
J J| > 3.0 and m
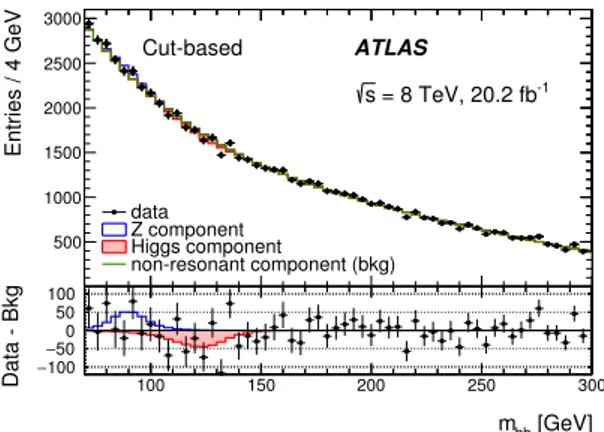
J J> 650 GeV. Figure
7
shows the m
bbdistribution of 32906 events in the data that satisfy the selection criteria.
The number of signal events in the data is expected to be 68.8, with about 15% coming
from ggF production. This can be compared to 158.9 events in the MVA, as obtained by
summing the corresponding numbers in table
2
over the four categories, where about 28%
comes from ggF production.
JHEP11(2016)112
Entries / 4 GeV 500 1000 1500 2000 2500 3000 data Z component Higgs component non-resonant component (bkg) ATLAS -1 = 8 TeV, 20.2 fb s Cut-based [GeV] bb m 100 150 200 250 300 Data - Bkg −100 50 − 0 50 100Figure 7. Distribution of mbbfor events selected in the cut-based analysis. The points represent
the data, and the histograms represent the non-resonant background, Z, and Higgs contributions. In the lower panel, the data after subtraction of the non-resonant background (points) are compared with the fit to the Z (open histogram) and Higgs (shaded histogram) contributions. The Higgs yield extracted from the fit is consistent with zero.
The cut-based analysis uses an unbinned maximum likelihood fit.
The resonance
shapes of the m
bbdistributions for the Higgs and Z events are determined by a fit to
a Bukin function [
63
] using MC events. The analytic functions describing the non-resonant
background are studied by using events that satisfy the pre-selection criteria described in
section
5
. A fourth-order polynomial is chosen as the nominal function and a fifth-order
polynomial is chosen as the alternative function.
The Higgs yield is left free to vary, but the Z yield is fixed to its SM prediction. The
robustness of the fit is validated by generating pseudo-data and constructing pulls of the
estimated number of Higgs events for various values of µ. The fit results are presented
in figure
7
. The Higgs signal strength is measured to be µ = −5.2 ± 3.7(stat.)
+2.7−2.5(syst.),
where the statistical uncertainty includes the statistical uncertainty on the non-resonant
background modelling (see table
4
). The sources of systematic uncertainty are the same as
those for the MVA analysis as described in section
8
and are summarised in table
4
. The
uncertainties on µ are estimated as the changes in µ when the sources are varied within
their uncertainties. Higher-order corrections to the Z samples and to the signal samples,
the choice of function describing the non-resonant background, and the jet energy scale are
the dominant sources of systematic uncertainty, each contributing about 40–50% to the
total systematic uncertainty on the Higgs signal strength. The magnitudes of experimental
and theoretical uncertianties are scaled with the central value of µ, as illustrated in table
4
except for the case of the MC statistical uncertainty. This is due to the fact that the MVA
divides the MC samples into four categories, and uses the signal m
bbdistribution directly
in the fit as a template while the cut-based analysis uses an interpolated function. The
upper limit on the strength is found to be 5.4 at the 95% CL, which can be compared to the
expected limit values of 8.5 in the background-only hypothesis and 9.5 if Standard Model
production is assumed. These results are consistent with those of the MVA. As expected,
the cut-based analysis is less sensitive than the MVA.
JHEP11(2016)112
11
Summary
A search for the Standard Model Higgs boson produced by vector-boson fusion and
de-caying into a pair of bottom quarks is presented. The dataset analysed corresponds to
an integrated luminosity of 20.2 fb
−1from pp collisions at
√
s = 8 TeV, recorded by the
ATLAS experiment during Run 1 of the LHC. Events are selected using the distinct
fi-nal state of the VBF H → b¯
b signal, which is the presence of four energetic jets: two
b-jets from the Higgs boson decay in the central region of the detector and two jets
in the forward/backward region. To improve the sensitivity, a multivariate analysis is
used, exploiting the topology of the VBF Higgs final state and the properties of jets.
The signal yield is estimated by performing a fit to the invariant mass distribution of
the two b-jets in the range 70 < m
bb< 300 GeV and assuming a Higgs boson mass of
125 GeV. The ratio of the Higgs signal yield to the SM prediction is measured to be
µ = −0.8 ± 1.3(stat.)
+1.8−1.9(syst.) = −0.8 ± 2.3. The upper limit on µ is observed to be
µ = 4.4 at the 95% CL, which should be compared to the expected limits of 5.4 in the
background-only hypothesis and 5.7 if Standard Model production is assumed. An
alterna-tive analysis is performed using kinematic selection criteria and provides consistent results:
µ = −5.2
+4.6−4.4and a 95% CL upper limit of 5.4.
Acknowledgments
We thank CERN for the very successful operation of the LHC, as well as the support staff
from our institutions without whom ATLAS could not be operated efficiently.
We acknowledge the support of ANPCyT, Argentina; YerPhI, Armenia; ARC,
Aus-tralia; BMWFW and FWF, Austria; ANAS, Azerbaijan; SSTC, Belarus; CNPq and
FAPESP, Brazil; NSERC, NRC and CFI, Canada; CERN; CONICYT, Chile; CAS, MOST
and NSFC, China; COLCIENCIAS, Colombia; MSMT CR, MPO CR and VSC CR,
Czech Republic; DNRF and DNSRC, Denmark; IN2P3-CNRS, CEA-DSM/IRFU, France;
GNSF, Georgia; BMBF, HGF, and MPG, Germany; GSRT, Greece; RGC, Hong Kong
SAR, China; ISF, I-CORE and Benoziyo Center, Israel; INFN, Italy; MEXT and JSPS,
Japan; CNRST, Morocco; FOM and NWO, Netherlands; RCN, Norway; MNiSW and NCN,
Poland; FCT, Portugal; MNE/IFA, Romania; MES of Russia and NRC KI, Russian
Fed-eration; JINR; MESTD, Serbia; MSSR, Slovakia; ARRS and MIZˇ
S, Slovenia; DST/NRF,
South Africa; MINECO, Spain; SRC and Wallenberg Foundation, Sweden; SERI, SNSF
and Cantons of Bern and Geneva, Switzerland; MOST, Taiwan; TAEK, Turkey; STFC,
United Kingdom; DOE and NSF, United States of America. In addition, individual groups
and members have received support from BCKDF, the Canada Council, CANARIE, CRC,
Compute Canada, FQRNT, and the Ontario Innovation Trust, Canada; EPLANET, ERC,
FP7, Horizon 2020 and Marie Sk lodowska-Curie Actions, European Union; Investissements
d’Avenir Labex and Idex, ANR, R´
egion Auvergne and Fondation Partager le Savoir, France;
DFG and AvH Foundation, Germany; Herakleitos, Thales and Aristeia programmes
co-financed by EU-ESF and the Greek NSRF; BSF, GIF and Minerva, Israel; BRF, Norway;
JHEP11(2016)112
Generalitat de Catalunya, Generalitat Valenciana, Spain; the Royal Society and
Lever-hulme Trust, United Kingdom.
The crucial computing support from all WLCG partners is acknowledged gratefully,
in particular from CERN, the ATLAS Tier-1 facilities at TRIUMF (Canada), NDGF
(Denmark, Norway, Sweden), CC-IN2P3 (France), KIT/GridKA (Germany), INFN-CNAF
(Italy), NL-T1 (Netherlands), PIC (Spain), ASGC (Taiwan), RAL (U.K.) and BNL
(U.S.A.), the Tier-2 facilities worldwide and large non-WLCG resource providers.
Ma-jor contributors of computing resources are listed in ref. [
64
].
Open Access.
This article is distributed under the terms of the Creative Commons
Attribution License (
CC-BY 4.0
), which permits any use, distribution and reproduction in
any medium, provided the original author(s) and source are credited.
References
[1] ATLAS collaboration, Observation of a new particle in the search for the Standard Model Higgs boson with the ATLAS detector at the LHC,Phys. Lett. B 716 (2012) 1
[arXiv:1207.7214] [INSPIRE].
[2] CMS collaboration, Observation of a new boson at a mass of 125 GeV with the CMS experiment at the LHC,Phys. Lett. B 716 (2012) 30[arXiv:1207.7235] [INSPIRE].
[3] F. Englert and R. Brout, Broken symmetry and the mass of gauge vector mesons,Phys. Rev. Lett. 13 (1964) 321[INSPIRE].
[4] P.W. Higgs, Broken symmetries and the masses of gauge bosons,Phys. Rev. Lett. 13 (1964) 508[INSPIRE].
[5] P.W. Higgs, Broken symmetries, massless particles and gauge fields,Phys. Lett. 12 (1964) 132[INSPIRE].
[6] ATLAS collaboration, Measurements of Higgs boson production and couplings in diboson final states with the ATLAS detector at the LHC,Phys. Lett. B 726 (2013) 88[Erratum ibid. B 734 (2014) 406] [arXiv:1307.1427] [INSPIRE].
[7] ATLAS collaboration, Evidence for the spin-0 nature of the Higgs boson using ATLAS data, Phys. Lett. B 726 (2013) 120[arXiv:1307.1432] [INSPIRE].
[8] CMS collaboration, Precise determination of the mass of the Higgs boson and tests of compatibility of its couplings with the Standard Model predictions using proton collisions at 7 and 8 TeV,Eur. Phys. J. C 75 (2015) 212[arXiv:1412.8662] [INSPIRE].
[9] CMS collaboration, Constraints on the spin-parity and anomalous HV V couplings of the Higgs boson in proton collisions at 7 and 8 TeV,Phys. Rev. D 92 (2015) 012004
[arXiv:1411.3441] [INSPIRE].
[10] CMS collaboration, Evidence for the 125 GeV Higgs boson decaying to a pair of τ leptons, JHEP 05 (2014) 104[arXiv:1401.5041] [INSPIRE].
[11] CMS collaboration, Evidence for the direct decay of the 125 GeV Higgs boson to fermions, Nature Phys. 10 (2014) 557[arXiv:1401.6527] [INSPIRE].
[12] ATLAS collaboration, Evidence for the Higgs-boson Yukawa coupling to tau leptons with the ATLAS detector,JHEP 04 (2015) 117[arXiv:1501.04943] [INSPIRE].
JHEP11(2016)112
[13] ATLAS and CMS collaborations, Measurements of the Higgs boson production and decayrates and constraints on its couplings from a combined ATLAS and CMS analysis of the LHC pp collision data at √s = 7 and 8 TeV,ATLAS-CONF-2015-044, CERN, Geneva Switzerland (2015) [CMS-PAS-HIG-15-002] [INSPIRE].
[14] CDF and D0 collaborations, T. Aaltonen et al., Evidence for a particle produced in
association with weak bosons and decaying to a bottom-antibottom quark pair in Higgs boson searches at the Tevatron,Phys. Rev. Lett. 109 (2012) 071804[arXiv:1207.6436] [INSPIRE]. [15] ATLAS collaboration, Search for the b¯b decay of the Standard Model Higgs boson in
associated (W/Z)H production with the ATLAS detector,JHEP 01 (2015) 069 [arXiv:1409.6212] [INSPIRE].
[16] CMS collaboration, Search for the Standard Model Higgs boson produced in association with a W or a Z boson and decaying to bottom quarks,Phys. Rev. D 89 (2014) 012003
[arXiv:1310.3687] [INSPIRE].
[17] CMS collaboration, Search for the Standard Model Higgs boson produced through vector boson fusion and decaying to bb,Phys. Rev. D 92 (2015) 032008[arXiv:1506.01010] [INSPIRE]. [18] CMS collaboration, Search for the associated production of the Higgs boson with a top-quark
pair,JHEP 09 (2014) 087[Erratum ibid. 10 (2014) 106] [arXiv:1408.1682] [INSPIRE]. [19] ATLAS collaboration, Search for the Standard Model Higgs boson produced in association
with top quarks and decaying into b¯b in pp collisions at √s = 8 TeV with the ATLAS detector,Eur. Phys. J. C 75 (2015) 349[arXiv:1503.05066] [INSPIRE].
[20] ATLAS collaboration, The ATLAS experiment at the CERN Large Hadron Collider,2008 JINST 3 S08003[INSPIRE].
[21] ATLAS collaboration, Performance of the ATLAS trigger system in 2010,Eur. Phys. J. C 72 (2012) 1849[arXiv:1110.1530] [INSPIRE].
[22] P. Nason, A new method for combining NLO QCD with shower Monte Carlo algorithms, JHEP 11 (2004) 040[hep-ph/0409146] [INSPIRE].
[23] S. Frixione, P. Nason and C. Oleari, Matching NLO QCD computations with parton shower simulations: the POWHEG method,JHEP 11 (2007) 070[arXiv:0709.2092] [INSPIRE]. [24] S. Alioli, P. Nason, C. Oleari and E. Re, A general framework for implementing NLO
calculations in shower Monte Carlo programs: the POWHEG BOX,JHEP 06 (2010) 043 [arXiv:1002.2581] [INSPIRE].
[25] J. Alwall, R. Frederix, S. Frixione, V. Hirschi, F. Maltoni, O. Mattelaer et al., The automated computation of tree-level and next-to-leading order differential cross sections and their matching to parton shower simulations,JHEP 07 (2014) 079[arXiv:1405.0301] [INSPIRE]. [26] H.-L. Lai, M. Guzzi, J. Huston, Z. Li, P.M. Nadolsky, J. Pumplin et al., New parton
distributions for collider physics,Phys. Rev. D 82 (2010) 074024[arXiv:1007.2241] [INSPIRE].
[27] T. Sj¨ostrand, S. Mrenna and P.Z. Skands, A brief introduction to PYTHIA 8.1, Comput. Phys. Commun. 178 (2008) 852[arXiv:0710.3820] [INSPIRE].
[28] ATLAS collaboration, ATLAS tunes of PYTHIA 6 and PYTHIA 8 for MC11, ATL-PHYS-PUB-2011-009, CERN, Geneva Switzerland (2011).
JHEP11(2016)112
[29] ATLAS collaboration, New ATLAS event generator tunes to 2010 data,ATL-PHYS-PUB-2011-008, CERN, Geneva Switzerland (2011).
[30] LHC Higgs Cross section Working Group collaboration, J.R. Andersen et al., Handbook of LHC Higgs cross sections: 3. Higgs properties,arXiv:1307.1347[INSPIRE]. [31] S. Dittmaier et al., Handbook of LHC Higgs cross sections: 2. Differential distributions,
arXiv:1201.3084[INSPIRE].
[32] M. Ciccolini, A. Denner and S. Dittmaier, Strong and electroweak NLO corrections to Higgs-boson production in vector-boson fusion at the LHC,Nucl. Phys. Proc. Suppl. 183 (2008) 103[arXiv:0806.3624] [INSPIRE].
[33] M. Ciccolini, A. Denner and S. Dittmaier, Electroweak and QCD corrections to Higgs production via vector-boson fusion at the LHC,Phys. Rev. D 77 (2008) 013002 [arXiv:0710.4749] [INSPIRE].
[34] D. de Florian, G. Ferrera, M. Grazzini and D. Tommasini, Higgs boson production at the LHC: transverse momentum resummation effects in the H → γγ, H → W W → `ν`ν and H → ZZ → 4` decay modes,JHEP 06 (2012) 132[arXiv:1203.6321] [INSPIRE].
[35] M. Grazzini and H. Sargsyan, Heavy-quark mass effects in Higgs boson production at the LHC,JHEP 09 (2013) 129[arXiv:1306.4581] [INSPIRE].
[36] J.M. Campbell, R.K. Ellis and G. Zanderighi, Next-to-leading order Higgs + 2 jet production via gluon fusion,JHEP 10 (2006) 028[hep-ph/0608194] [INSPIRE].
[37] ATLAS collaboration, The ATLAS simulation infrastructure,Eur. Phys. J. C 70 (2010) 823 [arXiv:1005.4568] [INSPIRE].
[38] GEANT4 collaboration, S. Agostinelli et al., GEANT4: a simulation toolkit,Nucl. Instrum. Meth. A 506 (2003) 250[INSPIRE].
[39] ATLAS collaboration, The simulation principle and performance of the ATLAS fast
calorimeter simulation FastCaloSim,ATL-PHYS-PUB-2010-013, CERN, Geneva Switzerland (2010).
[40] ATLAS collaboration, Topological cell clustering in the ATLAS calorimeters and its performance in LHC Run 1,arXiv:1603.02934[INSPIRE].
[41] M. Cacciari, G.P. Salam and G. Soyez, The anti-kt jet clustering algorithm,JHEP 04 (2008)
063[arXiv:0802.1189] [INSPIRE].
[42] M. Cacciari and G.P. Salam, Pileup subtraction using jet areas,Phys. Lett. B 659 (2008) 119 [arXiv:0707.1378] [INSPIRE].
[43] ATLAS collaboration, Jet energy measurement with the ATLAS detector in proton-proton collisions at √s = 7 TeV,Eur. Phys. J. C 73 (2013) 2304[arXiv:1112.6426] [INSPIRE]. [44] ATLAS collaboration, Jet energy measurement and its systematic uncertainty in
proton-proton collisions at√s = 7 TeV with the ATLAS detector, Eur. Phys. J. C 75 (2015) 17[arXiv:1406.0076] [INSPIRE].
[45] ATLAS collaboration, Tagging and suppression of pileup jets with the ATLAS detector, ATLAS-CONF-2014-018, CERN, Geneva Switzerland (2014).
[46] ATLAS collaboration, Performance of b-jet identification in the ATLAS experiment,2016 JINST 11 P04008[arXiv:1512.01094] [INSPIRE].
[47] A. Djouadi, J. Kalinowski and M. Spira, HDECAY: a program for Higgs boson decays in the Standard Model and its supersymmetric extension,Comput. Phys. Commun. 108 (1998) 56
JHEP11(2016)112
[48] ATLAS collaboration, Measurement of the muon reconstruction performance of the ATLASdetector using 2011 and 2012 LHC proton-proton collision data,Eur. Phys. J. C 74 (2014) 3130[arXiv:1407.3935] [INSPIRE].
[49] L. Breiman, J. Friedman, R.A. Olshen and C.J. Stone, Classification and regression trees, Chapman and Hall/CRC, U.K. and U.S.A. (1984) [INSPIRE].
[50] Y. Freund and R.E. Schapire, Experiments with a new boosting algorithm, in Machine Learning, Proceedings of the Thirteenth International Conference (ICML), Morgan Kaufmann, U.S.A. (1996).
[51] A. Hocker et al., TMVA — toolkit for multivariate data analysis,PoS(ACAT)040 [physics/0703039] [INSPIRE].
[52] J.H. Friedman, Data analysis techniques for high energy particle physics, SLAC-0176, (1974) [INSPIRE].
[53] B. Bernstein, D´emonstration du th´eor`eme de Weierstrass fond´ee sur le calcul des probabilit´es (in French), Comm. Soc. Math. Kharkov 13 (1912) 1.
[54] ATLAS collaboration, Calibration of b-tagging using dileptonic top pair events in a combinatorial likelihood approach with the ATLAS experiment,ATLAS-CONF-2014-004, CERN, Geneva Switzerland (2014).
[55] ATLAS collaboration, Luminosity determination in pp collisions at √s = 8 TeV using the ATLAS detector at the LHC,arXiv:1608.03953[INSPIRE].
[56] G. Corcella, I.G. Knowles, G. Marchesini, S. Moretti, K. Odagiri, P. Richardson et al., HERWIG 6: an event generator for hadron emission reactions with interfering gluons (including supersymmetric processes),JHEP 01 (2001) 010[hep-ph/0011363] [INSPIRE]. [57] A. Sherstnev and R.S. Thorne, Parton distributions for LO generators, Eur. Phys. J. C 55
(2008) 553[arXiv:0711.2473] [INSPIRE].
[58] R.D. Ball et al., Parton distributions with LHC data, Nucl. Phys. B 867 (2013) 244 [arXiv:1207.1303] [INSPIRE].
[59] L. Moneta, K. Belasco, K.S. Cranmer, S. Kreiss, A. Lazzaro, D. Piparo et al., The RooStats project,PoS(ACAT2010)057[arXiv:1009.1003] [INSPIRE].
[60] W. Verkerke and D.P. Kirkby, The RooFit toolkit for data modeling, in Statistical problems in particle physics, astrophysics and cosmology. Proceedings, Conference, PHYSTAT05, Oxford U.K. September 12–15 2005 [eConf C 0303241 (2003) MOLT007] [physics/0306116] [INSPIRE].
[61] A.L. Read, Presentation of search results: the CLs technique,J. Phys. G 28 (2002) 2693
[INSPIRE].
[62] G. Cowan, K. Cranmer, E. Gross and O. Vitells, Asymptotic formulae for likelihood-based tests of new physics,Eur. Phys. J. C 71 (2011) 1554[Erratum ibid. C 73 (2013) 2501] [arXiv:1007.1727] [INSPIRE].
[63] A.D. Bukin, Fitting function for asymmetric peaks,arXiv:0711.4449. [64] ATLAS collaboration, ATLAS computing acknowledgements 2016–2017,
JHEP11(2016)112
The ATLAS collaboration
M. Aaboud136d, G. Aad87, B. Abbott114, J. Abdallah65, O. Abdinov12, B. Abeloos118,
R. Aben108, O.S. AbouZeid138, N.L. Abraham150, H. Abramowicz154, H. Abreu153, R. Abreu117,
Y. Abulaiti147a,147b, B.S. Acharya164a,164b,a, L. Adamczyk40a, D.L. Adams27, J. Adelman109,
S. Adomeit101, T. Adye132, A.A. Affolder76, T. Agatonovic-Jovin14, J. Agricola56,
J.A. Aguilar-Saavedra127a,127f, S.P. Ahlen24, F. Ahmadov67,b, G. Aielli134a,134b,
H. Akerstedt147a,147b, T.P.A. ˚Akesson83, A.V. Akimov97, G.L. Alberghi22a,22b, J. Albert169,
S. Albrand57, M.J. Alconada Verzini73, M. Aleksa32, I.N. Aleksandrov67, C. Alexa28b,
G. Alexander154, T. Alexopoulos10, M. Alhroob114, M. Aliev75a,75b, G. Alimonti93a, J. Alison33, S.P. Alkire37, B.M.M. Allbrooke150, B.W. Allen117, P.P. Allport19, A. Aloisio105a,105b, A. Alonso38,
F. Alonso73, C. Alpigiani139, M. Alstaty87, B. Alvarez Gonzalez32, D. ´Alvarez Piqueras167,
M.G. Alviggi105a,105b, B.T. Amadio16, K. Amako68, Y. Amaral Coutinho26a, C. Amelung25,
D. Amidei91, S.P. Amor Dos Santos127a,127c, A. Amorim127a,127b, S. Amoroso32, G. Amundsen25, C. Anastopoulos140, L.S. Ancu51, N. Andari109, T. Andeen11, C.F. Anders60b, G. Anders32,
J.K. Anders76, K.J. Anderson33, A. Andreazza93a,93b, V. Andrei60a, S. Angelidakis9,
I. Angelozzi108, P. Anger46, A. Angerami37, F. Anghinolfi32, A.V. Anisenkov110,c, N. Anjos13,
A. Annovi125a,125b, M. Antonelli49, A. Antonov99, F. Anulli133a, M. Aoki68, L. Aperio Bella19, G. Arabidze92, Y. Arai68, J.P. Araque127a, A.T.H. Arce47, F.A. Arduh73, J-F. Arguin96,
S. Argyropoulos65, M. Arik20a, A.J. Armbruster144, L.J. Armitage78, O. Arnaez32, H. Arnold50,
M. Arratia30, O. Arslan23, A. Artamonov98, G. Artoni121, S. Artz85, S. Asai156, N. Asbah44, A. Ashkenazi154, B. ˚Asman147a,147b, L. Asquith150, K. Assamagan27, R. Astalos145a,
M. Atkinson166, N.B. Atlay142, K. Augsten129, G. Avolio32, B. Axen16, M.K. Ayoub118,
G. Azuelos96,d, M.A. Baak32, A.E. Baas60a, M.J. Baca19, H. Bachacou137, K. Bachas75a,75b,
M. Backes32, M. Backhaus32, P. Bagiacchi133a,133b, P. Bagnaia133a,133b, Y. Bai35a, J.T. Baines132, O.K. Baker176, E.M. Baldin110,c, P. Balek130, T. Balestri149, F. Balli137, W.K. Balunas123,
E. Banas41, Sw. Banerjee173,e, A.A.E. Bannoura175, L. Barak32, E.L. Barberio90,
D. Barberis52a,52b, M. Barbero87, T. Barillari102, T. Barklow144, N. Barlow30, S.L. Barnes86, B.M. Barnett132, R.M. Barnett16, Z. Barnovska5, A. Baroncelli135a, G. Barone25, A.J. Barr121, L. Barranco Navarro167, F. Barreiro84, J. Barreiro Guimar˜aes da Costa35a, R. Bartoldus144,
A.E. Barton74, P. Bartos145a, A. Basalaev124, A. Bassalat118, R.L. Bates55, S.J. Batista159,
J.R. Batley30, M. Battaglia138, M. Bauce133a,133b, F. Bauer137, H.S. Bawa144,f, J.B. Beacham112, M.D. Beattie74, T. Beau82, P.H. Beauchemin162, P. Bechtle23, H.P. Beck18,g, K. Becker121,
M. Becker85, M. Beckingham170, C. Becot111, A.J. Beddall20e, A. Beddall20b, V.A. Bednyakov67,
M. Bedognetti108, C.P. Bee149, L.J. Beemster108, T.A. Beermann32, M. Begel27, J.K. Behr44,
C. Belanger-Champagne89, A.S. Bell80, G. Bella154, L. Bellagamba22a, A. Bellerive31, M. Bellomo88, K. Belotskiy99, O. Beltramello32, N.L. Belyaev99, O. Benary154,
D. Benchekroun136a, M. Bender101, K. Bendtz147a,147b, N. Benekos10, Y. Benhammou154,
E. Benhar Noccioli176, J. Benitez65, D.P. Benjamin47, J.R. Bensinger25, S. Bentvelsen108,
L. Beresford121, M. Beretta49, D. Berge108, E. Bergeaas Kuutmann165, N. Berger5, J. Beringer16, S. Berlendis57, N.R. Bernard88, C. Bernius111, F.U. Bernlochner23, T. Berry79, P. Berta130,
C. Bertella85, G. Bertoli147a,147b, F. Bertolucci125a,125b, I.A. Bertram74, C. Bertsche44,
D. Bertsche114, G.J. Besjes38, O. Bessidskaia Bylund147a,147b, M. Bessner44, N. Besson137, C. Betancourt50, S. Bethke102, A.J. Bevan78, W. Bhimji16, R.M. Bianchi126, L. Bianchini25,
M. Bianco32, O. Biebel101, D. Biedermann17, R. Bielski86, N.V. Biesuz125a,125b, M. Biglietti135a,
J. Bilbao De Mendizabal51, H. Bilokon49, M. Bindi56, S. Binet118, A. Bingul20b, C. Bini133a,133b,
S. Biondi22a,22b, D.M. Bjergaard47, C.W. Black151, J.E. Black144, K.M. Black24, D. Blackburn139, R.E. Blair6, J.-B. Blanchard137, J.E. Blanco79, T. Blazek145a, I. Bloch44, C. Blocker25,
JHEP11(2016)112
W. Blum85,∗, U. Blumenschein56, S. Blunier34a, G.J. Bobbink108, V.S. Bobrovnikov110,c,S.S. Bocchetta83, A. Bocci47, C. Bock101, M. Boehler50, D. Boerner175, J.A. Bogaerts32,
D. Bogavac14, A.G. Bogdanchikov110, C. Bohm147a, V. Boisvert79, P. Bokan14, T. Bold40a, A.S. Boldyrev164a,164c, M. Bomben82, M. Bona78, M. Boonekamp137, A. Borisov131, G. Borissov74, J. Bortfeldt101, D. Bortoletto121, V. Bortolotto62a,62b,62c, K. Bos108, D. Boscherini22a,
M. Bosman13, J.D. Bossio Sola29, J. Boudreau126, J. Bouffard2, E.V. Bouhova-Thacker74,
D. Boumediene36, C. Bourdarios118, S.K. Boutle55, A. Boveia32, J. Boyd32, I.R. Boyko67, J. Bracinik19, A. Brandt8, G. Brandt56, O. Brandt60a, U. Bratzler157, B. Brau88, J.E. Brau117,
H.M. Braun175,∗, W.D. Breaden Madden55, K. Brendlinger123, A.J. Brennan90, L. Brenner108,
R. Brenner165, S. Bressler172, T.M. Bristow48, D. Britton55, D. Britzger44, F.M. Brochu30,
I. Brock23, R. Brock92, G. Brooijmans37, T. Brooks79, W.K. Brooks34b, J. Brosamer16,
E. Brost117, J.H Broughton19, P.A. Bruckman de Renstrom41, D. Bruncko145b, R. Bruneliere50,
A. Bruni22a, G. Bruni22a, BH Brunt30, M. Bruschi22a, N. Bruscino23, P. Bryant33,
L. Bryngemark83, T. Buanes15, Q. Buat143, P. Buchholz142, A.G. Buckley55, I.A. Budagov67, F. Buehrer50, M.K. Bugge120, O. Bulekov99, D. Bullock8, H. Burckhart32, S. Burdin76, C.D. Burgard50, B. Burghgrave109, K. Burka41, S. Burke132, I. Burmeister45, E. Busato36,
D. B¨uscher50, V. B¨uscher85, P. Bussey55, J.M. Butler24, C.M. Buttar55, J.M. Butterworth80,
P. Butti108, W. Buttinger27, A. Buzatu55, A.R. Buzykaev110,c, S. Cabrera Urb´an167, D. Caforio129, V.M. Cairo39a,39b, O. Cakir4a, N. Calace51, P. Calafiura16, A. Calandri87,
G. Calderini82, P. Calfayan101, L.P. Caloba26a, D. Calvet36, S. Calvet36, T.P. Calvet87,
R. Camacho Toro33, S. Camarda32, P. Camarri134a,134b, D. Cameron120,
R. Caminal Armadans166, C. Camincher57, S. Campana32, M. Campanelli80, A. Camplani93a,93b, A. Campoverde149, V. Canale105a,105b, A. Canepa160a, M. Cano Bret35e, J. Cantero115,
R. Cantrill127a, T. Cao42, M.D.M. Capeans Garrido32, I. Caprini28b, M. Caprini28b,
M. Capua39a,39b, R. Caputo85, R.M. Carbone37, R. Cardarelli134a, F. Cardillo50, I. Carli130, T. Carli32, G. Carlino105a, L. Carminati93a,93b, S. Caron107, E. Carquin34b,
G.D. Carrillo-Montoya32, J.R. Carter30, J. Carvalho127a,127c, D. Casadei19, M.P. Casado13,h,
M. Casolino13, D.W. Casper163, E. Castaneda-Miranda146a, R. Castelijn108, A. Castelli108,
V. Castillo Gimenez167, N.F. Castro127a,i, A. Catinaccio32, J.R. Catmore120, A. Cattai32, J. Caudron85, V. Cavaliere166, E. Cavallaro13, D. Cavalli93a, M. Cavalli-Sforza13,
V. Cavasinni125a,125b, F. Ceradini135a,135b, L. Cerda Alberich167, B.C. Cerio47, A.S. Cerqueira26b,
A. Cerri150, L. Cerrito78, F. Cerutti16, M. Cerv32, A. Cervelli18, S.A. Cetin20d, A. Chafaq136a,
D. Chakraborty109, S.K. Chan59, Y.L. Chan62a, P. Chang166, J.D. Chapman30, D.G. Charlton19, A. Chatterjee51, C.C. Chau159, C.A. Chavez Barajas150, S. Che112, S. Cheatham74,
A. Chegwidden92, S. Chekanov6, S.V. Chekulaev160a, G.A. Chelkov67,j, M.A. Chelstowska91,
C. Chen66, H. Chen27, K. Chen149, S. Chen35c, S. Chen156, X. Chen35f, Y. Chen69, H.C. Cheng91, H.J Cheng35a, Y. Cheng33, A. Cheplakov67, E. Cheremushkina131, R. Cherkaoui El Moursli136e, V. Chernyatin27,∗, E. Cheu7, L. Chevalier137, V. Chiarella49, G. Chiarelli125a,125b, G. Chiodini75a,
A.S. Chisholm19, A. Chitan28b, M.V. Chizhov67, K. Choi63, A.R. Chomont36, S. Chouridou9,
B.K.B. Chow101, V. Christodoulou80, D. Chromek-Burckhart32, J. Chudoba128, A.J. Chuinard89, J.J. Chwastowski41, L. Chytka116, G. Ciapetti133a,133b, A.K. Ciftci4a, D. Cinca55, V. Cindro77,
I.A. Cioara23, A. Ciocio16, F. Cirotto105a,105b, Z.H. Citron172, M. Citterio93a, M. Ciubancan28b,
A. Clark51, B.L. Clark59, M.R. Clark37, P.J. Clark48, R.N. Clarke16, C. Clement147a,147b,
Y. Coadou87, M. Cobal164a,164c, A. Coccaro51, J. Cochran66, L. Coffey25, L. Colasurdo107,
B. Cole37, A.P. Colijn108, J. Collot57, T. Colombo32, G. Compostella102, P. Conde Mui˜no127a,127b,
E. Coniavitis50, S.H. Connell146b, I.A. Connelly79, V. Consorti50, S. Constantinescu28b,
G. Conti32, F. Conventi105a,k, M. Cooke16, B.D. Cooper80, A.M. Cooper-Sarkar121,