Polyphonic images of the cities. Mapping
new human landscapes through User
Generated Content
Luca Simeone, Giorgia Lupi, Paolo Patelli, Salvatore Iaconesi
me@luca.simeone.name
address: Ö Varvsg. 11 A Malmö University, 205 06 Malmö
Abstract
Is it possible to provide citizens, decision makers and urban planners with dynamic images able to real-time inquire cites and territories they live in? How to determine the relationships between specific public places (physical characteristics, uses and people’s patterns of social activities) in order to promote meaningful innovation in terms of urban planning and management? How to determine the effective perception of the citizens about their actual urban experience? Polyphonic images of the cities is a series of experiments on digital traces on the city of Milan that aim at designing, testing and deploying new methods and
technologies to collect, analyze and represent real-time data at the urban scale, in order to intercept uncovered needs and desires of knowledge about contemporary urban phenomena. The paper presents one of such experiment called "Visualizing the Crisis", which consists in a platform that harvests and integrates real-time data streams coming from geo-localized user generated content and then applies text mining processes in order to extract users' emotional reactions and plot them on a map. The project started analyzing users' emotional
temperature in the two major Italian cities (Rome and Milan) in November 2011, when Silvio Berlusconi lost his parliamentary majority and Mario Monti was nominated Prime Minister.
KEYWORDS: urban phenomena, data visualization, UGC, social mining
Introduction
This research project explores the potential of the application of text mining methods on User Generated Content (UGC) in order to extract and constantly monitor real-time sociopolitical indicators. More specifically, our project aims at analyzing users' narratives, emotions, memories as crystallized into real time information streams coming from social platforms (like Twitter, Facebook, Foursquare, Flickr). The social media streams have been
investigated in the Fall/Winter 2011-2012 during an intense period of economic and political transformations in Italy after Berlusconi’s government collapse. Mario Monti, a former European Commissioner, was asked to lead a new government in Italy in order to implement reforms and austerity measures.
Visualizing the Crisis aims at exploring geo-localized citizens’ reactions in the two major Italian cities (Rome and Milan) mostly focusing on users' feelings and emotions as related to the main political events and the profound Italian crisis.
The investigation has been carried out through a technological platform based on previous experiences, such as ConnectiCity and VersuS [1]. ConnectiCity is a research project started in
2008 by Salvatore Iaconesi and Oriana Persico and focusing on the contemporary
transformation of cities and their citizens. Ubiquitous technologies, real-time systems, sensor networks, collaborative environments, peer to peer strategies, knowledge and information ecosystems: all these things create scenarios in which citizens become more active and aware, and can collaborate to substantially reinvent the ways in which we learn, communicate and relate in our cities, introducing radical innovations which will shape the ways in which we create our reality. VersuS, one specific instance of ConnectiCity, is a web-based platform that uses real-time information coming from social networks to analyze the digital lives of cities and display them using infoaesthetic information visualizations.
Visualizing the crisis is another instance of these engines, with a specific focus on text mining
strategies to extract users' emotions as expressed into the wider sociopolitical Italian context. The theoretical assumption behind Visualizing the crisis is that by conducting an analysis of data sets based on text extracted from UGC we can recognize multiple stories, as they emerge, overlap and influence each other, unfolding from city users’ mental representations and spatial experiences of city spaces. In fact, by providing tangible, visible referents, the spaces of actual buildings and cities participate in constructing the meaning of the speech that articulates itself within them and as conversations unfold within particular architectural settings; they build up increasingly dense webs of shared understanding grounded -at least in part- on the points of reference that these settings afford (Mitchell, 2005).
Contested, transnational, embodied, gendered spaces: buildings, regions, and urban
environments are continually renegotiated and reconfigured by individuals and social groups, each with their own identity, needs, and world views. It is within these metropolitan
interstices, modulated according to the overlap and occurrence of differences, that intersubjective and collective experiences are negotiated (Low & Lawrence-Zunigais 2003; Bhabha 1994). Physical spaces become places as they are experienced, lived, shared and communally interpreted. Contemporary urban analyses are increasingly focused on micrological and interstitial investigations to investigate the temporary, precarious, and conflicting meanings attributed by specific groups to places with which we often maintain a familiar relationship: a neighborhood in our city, a park, an event, a series of paths. These places become ‘practiced places’, to quote de Certeau, or in other words spaces interpreted and lived through the experiences of situated subjects (de Certeau, 1984).
Visualizing the crisis is the attempt to locate these situated experiences, as both embodied in social media streams and connected to physical spaces, and to transform dataset into meaningful urban stories through an appropriate analysis and visual restitution of them. This paper describes both the first results of this analysis, the data visualizations that allowed unveiling patterns and the technological platform behind our research activities.
Theoretical framework
Our research project stems from a fertile research agenda and an abundant scientific literature.
Emerging critical practices have proposed new models to describe the city (Schein, 1997; Cosgrove, 1999; Duncan & Duncan, 2003) that stress the collaborative, constructionist dynamics of the mapping processes. The underlying idea of this approach considers the geographic, urban experience through a network of multiple, fragmented and temporary data and information generated by human-place interactions and collaborative dynamics. Based on these theoretical premises, several experimental GIS focusing on cartography emerging from users’ perceptions and activities have been produced.
As Zook & Graham noticed, traditional methods used to register users’ perceptions and activities about the cities and its fruition - like surveys and ethnographic reports - seem to be inadequate to meet the need of information of contemporary society (Zook & Graham, 2007a, 2007b, 2007c) both because they require a considerable amount of resources (in terms of time and money) and because they do not consider the temporal dimension.
Mapping projects based on UGC have been therefore conducted both by research institutions (e.g. CASA at the University College London, SIDL Lab at the Columbia
University, Senseable City Lab at the Massachusetts Institute of Technology, Urban Age at the
London School of Economics) and independent scholars and design firms (e.g. Christian Nold, Stamen Design) with the aim of creating new ways to observe and depict specific
subjective and objective processes taking place in cities. Senseable City Lab explored mapping systems based on UGC on several projects like World’s Eyes and Obama One People
[2] Current City [3], a European foundation committed to address long-standing city
management problems in unconventional ways, explored the potential of urban mapping based on real-time data streams on users’ location coming from telco providers. Christian Nold’s work focused on in-depth research of technological tools in order to unravel their social and political layers, and on building socially constructive, bottom-up devices, that take the form of practical tools such as in the Bio Mapping project [4]. Bio Mapping is a research
project based on biometric sensors that can be worn by users provided with a GPS device able to trace their paths through the city, and that register some parameters (e.g. emotional status in to specific places and situations) and publish them as user generated content on specific emotional maps. This project explores tools that allow people to selectively share and interpret their own bio data. Within this framework, Nold thus investigates how the perceptions of a community in an environment change when they become aware of their own intimate emotional status.
In the past decades the research on emotions has progressively grown in scale and
importance, involving fields such as psychology, anthropology, biology, philosophy, history and sociology. And powerful debates arose between confronting parties, establishing oppositions among universalists/relativists, biology/culture, nature/nurture,
materialism/idealism, positivism/interpretivism, individual/social, body/mind, reason/passion, rationalism/romanticism, in a dualistic approach that is deeply
interconnected with the Cartesian Dualism typical of the Western intellectual tradition (Lutz, Schwartz, & Miles, 1992).
For the scope of our project, emotions have been categorized according to a simplified version of Plutchik's scheme (Plutchik, 1991). We built a collaborative emotional profile by means of textual interactions: these were analyzed using a lexicon database that was created by extending Plutchik's classification in an "emotional thesaurus": words were structured in graphs showing weighted relationships, with the arcs marked with the definition of the
lexical constructs describing the syntactical contexts in which specific words could be considered as relevant in terms of the identification of emotional states.
Based on these theoretical premises, we decided to instantiate Visualizing the crisis as a platform to actively evaluate some of the strategic and technological findings that emerged from the scientific literature and to test them in a specifically contextualized research setting.
Design considerations
The basic technological idea behind our project was to set up a platform that automatically harvests real-time data from UGC streams, applies text mining functionalities, extracts key elements and plots them on a map. The platform is composed of several components and each of them allows several parameters to be set and tuned according to ambient indicators and linguistic components of explicit interest.
The main components of the system are:
- A harvesting engine that collects real-time data streams from geo-localized UGC; - A text mining engine and a data clustering layer;
- A prototypical web interface that should allow users to perform specific searches within pre-defined domains;
- A visualizing engine
The plugin architecture has been designed in order to allow the connection to multiple social networks.
Multiple languages are supported as the system allows to choose from several idioms for which approximate automatic translation is possible, or to manually provide translations. Keyword based analysis have been enhanced by both configuring syntactical templates to capture only the more relevant content and by adding a semantic layer to first expand the terms to which the system is sensible and, then, to use formal ontologies to cluster all the collected text into themes and topics. An important component of the linguistic engine was the connection to Wordnet, a lexical database developed by Princeton University [5], which allows expanding the range of the linguistic queries through its multilingual thesaurus and ontology.
A machine learning engine constitutes a median stage in which both automatic and human-powered procedures train the system to more intelligent content recognition schemes: positive and negative examples are provided to a series of evaluation functions and procedures which progressively provide deeper insights about the relevance of selected content to the overall filtering schemes, and contextually evolve the evaluation systems leveraging the added knowledge acquired through the use of the provided examples.
The platform in use
The platform Visualizing the crisis was completed at the end of October 2011. We started our observations the first days of November 2011 analyzing users' emotional temperature in the two major Italian cities (Rome and Milan) when Silvio Berlusconi lost his parliamentary majority and Mario Monti was nominated Prime Minister.
We analyzed information crossing both temporal and spatial dimensions.
In fact, bringing a temporal dimension into those data systems gives us the possibility to compare emotional peaks and recognized patterns to specific events. Moreover, visualizing the spatial location of such data gives us the possibility to discover unknown aspects of the relation between citizens’ profile and specific areas. For instance, within our early exploration during the peak of the political crisis (10th, 11th, 12th November) we could unexpectedly discover meaningful cluster of “constructive reactions”.
In order to construct a tool able to focus on the operational level of the city and its everyday aspects, the project has then been developed analyzing a larger dataset during the whole month of January, when the new established Prime Minister unveiled a radical and ambitious package of spending cuts and tax increases, including deeply unpopular moves like raising the country’s retirement age. The measures are meant to slash the cost of government, combat tax evasion and step up economic growth, to eliminate its budget deficit by 2013. Thus, during our January full-month extraction, we could relate patterns of emotions to both specific areas within the two cities and also to specific political events.
In order to define the linguistic keywords associated to key political events, we carried out a daily study of the news agenda of the most important Italian newspapers (Corriere della Sera, La Stampa, La Repubblica). This study allowed us to extract a list of meaningful keywords related to main sociopolitical events (such as ‘crisi economica’, ‘articolo 18’, ‘sciopero sindacati’, ‘manifestazione’).
When the original content contained geographic coordinates we could also plot the final emotional output on a map.
Below there are two specific examples of queries performed during the research project through the Visualizing the crisis platform.
January 18, 2012 - Event:
Mario Monti visits David Cameron in London and discusses his goals: labour market reform, flexsecurity and the Danish model along with the fight against tax evasion.
- Sociopolitical keywords related to the event:
Monti, Cameron, Lavoro, Occupazione, Licenziamenti, Legge, Evasione, Danimarca, Flexsecurity, Articolo 18, Riforme.
- Geographical outcomes emerging from the platform Visualizing the crisis:
Milan: We noticed a high concentration of positive feelings around the very center of the city of Milan (where banks and financial companies are located) along with other more sporadic spikes around other business and media hubs (Porta Garibaldi, Cologno Monzese, Corso Sempione/Certosa, Rogoredo...). We could then notice a progressive shifting towards more negative feelings in the industrial clusters around the city (Sesto San Giovanni, Rho/Pero, San Donato...). Even more interestingly though, we could identify an averagely positive reaction around lower and middle class residential neighborhoods probably suggesting evidence of the unexpected hope the government change brought even to the groups of people more affected by the hardness of the economical measures.
January 23, 2012 - Event:
Nation wide strike of taxi drivers causes many traffic problems in major Italian cities. The drivers protest against a liberalization of the market proposed by the government as one of the key reforms in order to contain the effects of the economical crisis.
- Sociopolitical keywords related to the event:
Monti, Governo, Riforme, Liberalizzazioni, Decreto, Categorie, Licenze, Tassisti, Taxi, Sciopero, Traffico, Servizio Pubblico.
- Geographical outcomes emerging from the platform Visualizing the crisis:
Rome: We noticed an average negative reaction, evenly spread across the city, slowly fading to more neutral feelings from the center towards the outskirts.
Higher concentrations along tourist routes and city landmarks suggest disappointment especially among visitors and taxi users, as if the negative feelings were directed towards the strike itself other than the government and the reforms. Furthermore, the research
highlighted the usage of specific ironic hashtags (e.g. #menotaxipertutti) related to negative UGCs and addressing the strike as a source of disaffection.
In these two examples, Visualizing the crisis helped us to understand how cities react to political and economic events, relating citizens’ emotions to specific sociopolitical circumstances and to specific spatial and temporal coordinates.
An important component of the platform is the visualization engine. When the appropriate data are presented together in the right context, they can help the reader to understand the situation they are depicting or even discover new relationships that have been previously hidden in the data.
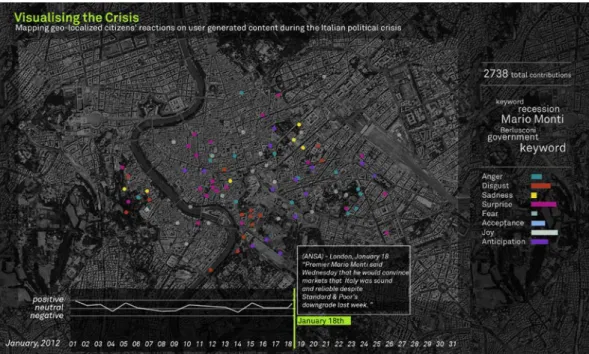
Fig. 1 Visualizing the crisis. Geo-located UGC and related emotions shared within the city of Rome on January 18th, 2012 - Visual experiment 1
Fig. 2 Visualizing the crisis. Geo-located UGC and related emotions shared within the city of Rome on January 18th, 2012 - Visual experiment 2
These visualizations are screenshots coming from a map-based interface that can be dynamically explored through a timeline (in this case, the month of January). The timeline points out relevant political events and the basic emotional temperature of the city measured and returned in terms of positive, neutral and negative. Moreover, the visualizations show the geographic distribution of sentimental patterns (spots or concentrations); a color legend is presented on the right part of the screen and the legend also dynamically communicates the number of UGC related to each emotion mapped.
- Across space, using the same navigational functionalities as in Google Maps; - Across time, offering the opportunity to navigate, save and compare different
moments and periods;
- Through specific content filters (offering the opportunity to select the kind of emotions to display).
The video log of the extractions and sentiment analysis we are using for the city of Milan can be found here: http://polyphonicities.tumblr.com/#17885584103. The video represents a first attempt to develop a real-time visualizing engine that plots the different geo-localized UGC contribution with the relative emotion.
Technology
The first instance of the platform developed was based on the following components: - A harvesting engine that collects real-time data streams from geo-localized UGC
streams (Twitter, Facebook, Foursquare, Flickr);
- A text mining engine which combines Wordnet semantic graphs with the definition of relevant syntactical structures to filter significant data from general streams; - A data clustering layer using Wordnet ontologies to reassemble data across themes
and topics;
- A machine learning system based on networks of evaluation functions and procedures that allow the system to learn how to improve lexical relations and the evaluation functions themselves, based on users’ feedback;
- A conversational analysis engine that traces real-time interactions among users (through their interactions on the UGC);
- A web interface that allows users to perform specific searches within pre-defined domains (e.g. show all the content related to ‘prayer’ within the domain of ‘religion’); - A visualizing engine that generates dynamic infoaesthetic representations on top of
multiple types of geographic visualizations (such as Google Maps, OpenStreetMap, and custom mapping solutions based on multiple open source platforms) relating data to a timeline of events.
The information harvesting engine is composed by an abstraction layer in which several plugins can be connected to implement harvesting functionalities built to integrate the specific features of different social networks. For example: the harvesting plugin built for the Twitter social network is created around the Streaming API; the Facebook harvesting plugin is built combining the Open Graph API with specific applicative function calls to the wider set of APIs offered by the social network provider to access the content and metadata exchanged by users, in compliance with existing Terms of Service Agreements and national laws on privacy and copyright.
These two examples show how each connected social network needs specific actions to be performed and strategies to be enacted, both at a technical level and from the points of view of law, ethics and the respect of the terms and conditions which rule the ways in which we
can access data publicly posted on social networks, including the use and processing of such information.
As an example, on the theme of privacy, the system was created to avoid storing sensible, private information: each identification string (such as the ID strings provided by Facebook and Twitter) is processed before being saved in the system using an anonymization policy which uses a one-way, irreversible algorithm (Naor & Yung, 1989) which allows the system to maintain the possibility to correctly analyze and cluster individual data, but avoids being able to map the information back to social network users (thanks to the unidirectionality of the algorithm and, thus, the impossibility of transforming a system ID back into a Social Network ID), to eliminate the possibility of privacy infringement.
A data model is handled at the level of the abstraction layer to store all captured data: each plugin processes the specific data formats provided by each of the social networks to adapt them to the abstraction layer, and maintaining other anonymized meta-data which could be made available by some, but not all, of the social networks to be accessible should it be needed if specific elaborations benefit from it.
The data is also processed using a series of procedures whose aim is to raise the quality level of the data itself, and to discard information which can be interpreted as spam, blacklisted or incorrectly formatted. Some specific processes are used as antispam and blacklisting, in which a series of commercial antispam procedures are applied to content to identify and exclude spam, and a series of blacklists available and configurable directly in the system are applied, to eliminate content which is not "desirable" (because of previously identified malicious users, unreliable information sources and specific cases in which a certain source is known to produce low quality content). The system also performs some normalization procedures (Kotov, Zhai & Sproat, 2011; Liu, Jiang, Wei & Zhou, 2011), in which a large database of Named Entities is used to identify and correct the names of places, landmarks, locations, events and other notable entities which might have been incorrectly spelled, abbreviated or quoted. Finally, another crucial component of the system are the geo-parsing (Freire, Borbinha, Calado & Martins, 2011; Shi & Barker, 2011) and geo-referencing
procedures, in which a reference GIS system, including the POIs (Points of Interest) of the geographic Named Entities contained in the database used at the previous step, is used to attribute standard coordinates to contents;
The collected information is then processed to classify it according to the configured goals and strategies.
Goals are described in terms of syntactical constructs which the captured content must comply to. The constructs are described in terms of control strings using regular expression format and including extended tokens which link to the system specific functionalities. These special tokens relate the constructs to the topic domains for which the system's semantic sensibility is configured. Each token is composed of two parts: a series of Wordnet-contained keywords and the instructions to traverse Wordnet semantic graphs.
The first element contains a series of words which describe the keywords which are most relevant to the current construct in defining the topic for which we want the system to be sensible to. These words should be contained in the Wordnet semantic network or in one of its certified translations, as they will be used as starting points for traversal of Wordnet's graphs to verify the adherence of each content to the desired semantic context.
The second element is composed by a list of "graph traversal instructions". Wordnet semantic networks are described as graphs connecting words through arches whose labels describe the relation, consequence or connection from one word to the other from a semantic point of view. Some arches bring to synonyms of words, some other arches
connect to possible usages of words. The second element of the tokens describes which paths (synonyms and word usages) can be considered as compliant to the topic we wish our system to be sensible to. In the processing stage, whenever a word among the ones from the first element of the token is found in the content, each sentence of the content is processed from there onward: if the sequences of relevant terms comply with at least one of the configured traversal paths of Wordnet semantic graphs, then the content is considered as being relevant for the specific topic. In other words, Wordnet acts as both an ontology and a thesaurus that allow the emergence of semantic patterns of interest.
By configuring the system it is, thus, possible to create the basis for a strategy to create clusters information which can highlight which harvested contents are relevant to the topics of interest.
Results of the analysis are sent to a machine learning subsystem which analyzes clusters and overlays them to Wordnet semantic graphs and to previously collected knowledge elements to identify recurring patterns and naturally emerging clusters (for example in the case in which the collected knowledge fits not only the configured clusters but also other Wordnet sub-graphs beyond a certain threshold of network coverage). These identified clusters are highlighted on the system's interfaces to suggest possible additional or alternative
configurations, thus establishing a semantic expert system that can be used to fine tune the overall system performance and the quality of the analyzed data.
All information is sent to the following stages of the system's architecture in which the following processes take place:
- Conversation analysis, in which the interrelation information of contents (message, reply, comment, forward, share) is used to describe the types of relations that occurs between places and clusters;
- Search and data traversal and mining functionalities, in which interfaces allow users to traverse and search all data, meta-data and knowledge elements (relations, grouping, relevance) to gain a better understanding of how the harvested information relates to the configured analysis strategy;
- Information visualization stages, in which data is offered in standard formats (XML-RPC, JSON, CSV, Database tables) which can be used by information visualization components to represent information through real-time or offline indexes,
interactive infoaesthetic representations, interactive maps, graphs, and standard graphs such as histograms, pie charts, line graphs, scatter graphs.
Conclusions
The main objective of the first phase of this research project was to build a prototype of a platform for social media data harvesting, parsing, analysis and visualization and this milestone has been achieved. Now, further and thorough investigation is needed in order to assess the potential of the platform and to refine its core engine.
A more elaborated model to extract emotions from UGC is also needed. Both the classification of emotions we currently use and the process that infers emotions from the user generated texts need to be further developed. A more solid theoretical grounding that combines recent advancements in psychology of emotions and linguistics would give a significant contribution to the text mining engine.
A greater attention to ambient features of city spaces and to their social connotations will provide deeper insights into those environmental aspects that influence localized networks and interactions.
Finally, a specific research path should also be aimed at improving the visualization engine. Nonetheless we consider the early results presented in this paper as a promising starting point and we hope that they will help us in getting in touch with partners working in similar areas or topics and willing to explore the potential of this platform.
Notes
[1] More details on ConnectiCity and VersuS are published on Art is Open Source blog: http://www.artisopensource.net/
[2] MIT Senseable City Lab, http://senseable.mit.edu/ [3] Current City, http://currentcity.org/
[4] Christian Nold, http://www.softhook.com/ [5] Wordnet, http://Wordnet.princeton.edu/
References
Example references.
Bhabha, H. K. (1994). The location of culture. London-New York: Routledge.
Christian Nold's website. (n.d) . Retrieved November 5, 2011, from http://www.softhook.com/
Cosgrove, D. (Ed.). (1999). Mappings. London: Reaktion Books.
Current City's official website. (n.d) . Retrieved November 5, 2011, http://www.currentcity.org
de Certeau, M. (1984). The Practice of Everyday Life. Berkeley, CA: University of California
Press.
Duncan, J., & Duncan, N. (2003). Landscapes of Privilege. The Politics of the Aesthetic in an American Suburb. New York: Routledge.
Freire, N., Borbinha, J., Calado, P., & Martins, B. (2011). A metadata geoparsing system for place name recognition and resolution in metadata records. Proceedings of the 11th annual international ACM/IEEE joint conference on Digital libraries, New York (USA).
Kotov, A., Zhai C., & Sproat, R. (2011). Mining named entities with temporally correlated bursts from multilingual web news streams. Proceeding WSDM '11 of the fourth ACM international conference on Web search and data mining, New York (USA).
Liu, X., Jiang, L., Wei, F., & Zhou, M. (2011). QuickView: advanced search of tweets. SIGIR '11 Proceedings of the 34th international ACM SIGIR conference on Research and development in Information, New York (USA).
Low, S. M., & Lawrence-Zunigais, D. (2003). The Anthropology of Space and Place: Locating Culture. Malden and Oxford: Wiley-Blackwell.
Lutz, C., Schwartz, T., & Miles, G. (1992). White, New directions in psychological anthropology.
Cambridge: Cambridge University Press.
Naor, M., & Yung, M. (1989). Universal one-way hash functions and their cryptographic applications. Presented at the ACM symposium on Theory of computing, New York (USA).
Plutchik, R. (1991). The emotions. New York: University Press of America.
Schein, R. (1997). The Place of Landscape: A Conceptual Framework for Interpreting an American Scene. Annals of the Association of American Geographers, 87, 660–680.
Senseable City Lab's official website. (n.d) . Retrieved November 5, 2011, from http://senseable.mit.edu
Shi G., & Barker, K. (2011). Thematic data extraction from Web for GIS and application. Presented at IEEE International Conference on Spatial Data Mining and Geographical Knowledge Services, Fuzhou (China).
Zook, M., & Graham, M. (2007a). The Creative Reconstruction of the Internet: Google and the Privatisation of Cyberspace and DigiPlace. Geoforum, 38, 1322–1343.
Zook, M., & Graham, M. (2007b). From Cyberspace to DigiPlace: Visibility in an Age of Information and Mobility, in: H. J. Miller, (Ed.), Societies and Cities in the Age of Instant Access. London: Springer.
Zook, M., & Graham, M. (2007c). Mapping DigiPlace: Geocoded Internet Data and the Representation of Place. Environment and Planning B: Planning and Design, 34.