Examensarbete
15 högskolepoäng, grundnivå
The influence of technostress on
perceived academic performance
A study on university students in Sweden
Nicola Fitzgerald
Examen: Kandidatexamen 180 hp Examinator: Maria Engberg Huvudområde: Medieteknik Handledare: Fredrik Rutz Datum för slutseminarium: 2021-01-14
Technostressens påverkan på
upplevda akademiska prestationer
En studie på universitetsstudenter i Sverige
Sammanfattning
Ökad digitalisering inom högre utbildning kräver användning av olika informations- och kommunikationstekniker (IKT). Studier har dock visat att IKT kan framkalla technostress. Syftet med denna forskning är att utforska hur teknikegenskaper påverkar studenternas technostress och i sin tur deras upplevda akademiska prestationer. För att undersöka detta skickades en enkät till studenter vid MAU i Sverige och en bivariat analys genomfördes för att analysera datan. Resultaten visade att vissa teknikegenskaper var associerade med technostress, medan vissa inte var det. Det gick dock inte att fastställa en koppling mellan studenternas technostress och deras upplevda akademiska prestationer. Studien diskuterar möjliga bidragande faktorer till resultaten.
Nyckelord
Abstract
Increased digitisation in higher education requires the usage of various information and communication technologies (ICTs). However, studies have shown that ICTs induce
technostress. The purpose of this research is to explore how technology characteristics influence students’ technostress, and in turn their perceived academic performance. To examine this, a survey was sent out to student’s at MAU in Sweden and a bivariate analysis was conducted to analyse the data. The results showed some technology characteristics were associated with technostress, while some were not. The students’ technostress could, however, not be determined to have an association with their perceived academic performance. The study discusses possible contributing factors to the results.
Keywords
Contents
1. Introduction………1
1.1 Literature review………2
1.2 Purpose and research question………...4
1.3 Delimitations………..4 1.4 Target audience………..5 2. Theoretical framework………..6 2.1 Stress theory………...6 2.2 Academic stress………..7 2.3 Technostress theory………....7 2.3.1 Techno-stressors………...9 2.4 Technology characteristics………....10 2.5 Academic performance………..10
2.6 Cultural and situational contexts………....11
3. Research model and hypotheses………...13
4. Research methodology………...14
4.1 Data collection………...15
4.2 Measures………....15
4.3 Pilot-testing………19
4.4 Sampling………....20
4.5 Data analysis procedure………...23
4.6 Validity and reliability………...…24
4.7 Method discussion………....….24
4.7.1 Ethical considerations……….25
5. Results………..28
5.1 Respondent demographic………...28
5.2 Bivariate analysis of technology characteristics and techno-stressors………...29
5.3 Bivariate analysis of techno-stressors and academic performance………30
6. Discussion………32
7. Limitations and future research………...35
8. Conclusion………..36
References………...37
Appendix 1 – Cover Letter………....46
Appendix 2 – Questionnaire………..47
Acknowledgements
First, I would like to thank my supervisor Fredrik Rutz. I would also like to thank Ingvar Jaxell, study administrative officer for the Studentservice Academic Administration. The sampling would have been difficult to achieve without his help. Additionally, I am thankful for the feedback and rewarding theoretical discussions of my peers. Lastly, I would like to thank my sister Emily Fitzgerald for proof-reading the final draft.
1
Introduction
The transition from an industrialised society to the information age means that many aspects of our lives have been digitised. In contemporary times, the increased use of information and communication technologies (ICTs) has had a significant impact on modern education (Wikramanayake, 2005; Katsipataki, Xiao & Higgins, 2012; Henderson, Selwyn & Aston, 2015). The European Commission’s (2018) Digital Learning Action Plan adopted in 2018 details how the European Union can aid educational institutions and systems in how to adapt to the rapid digital changes in a new age. The benefits of digital technologies are also emphasised in the Communication on improving and modernising education (European Commission, 2016) as a tool for an opportunity in providing high-quality education for the people. As a part of the European Union, Sweden also promotes use of ICT in education. Sweden was one of the first countries to recognise the potential digital technologies had for education (Tallvid, 2015), where trials and tests using computers in schools started as early as in the 1970s. Since then the
implementation and integration of technology in education have been a part of Swedish educational policy. In 1998 the government launched the policy Information Technology in
School (ITiS) that aimed to improve and develop skills for ICT use in teaching. (Torbjörn, 2017)
Although the use of ICTs has become an overall standard, there is a mixed approach for Swedish institutions for higher education. Many universities did not have specific policies for the implementation and management of ICTs (Hansson & Holmberg, 2003). The investments in digital technologies indicate that educational institutions will favour the integration of new technology in the future. Today such integration of digital technologies can already be witnessed, and the use of ICTs is not always optional for students. The use of platforms and systems are usually mandatory, including platforms for information, submission of assignments and acquisition of documents, as well as systems for schedules and booking of lecture halls or other rooms on campus. Professors and lecturers often also expect contact through email, further highlighting the trend towards the use of digital technologies. Students are also expected to possess some degree of competence in application technologies such as word processing and presentation software. Certain subjects may expect a higher degree of competence in digital technology than others. Although the considerable focus has been on the positive aspects of this societal shift of digitisation (Beetham & Sharpe, 2010), many universities struggle with the disruptive and distracting elements of new technologies (Selwyn, 2016). Furthermore, studies have found that stress is linked to the increased use of ICTs in learning (Berg-Beckhoff et al., 2017). Information overload and continuous connection in this way can result in a state of stress called technostress (Chiappetta, 2017), which is a term that is widely used within research to
explain this phenomenon of stress related to technology. There are expectations and
assumptions that university students are able to use digital technologies with ease and that there is an absence of technostress within the demographic. However, university students are most often composed of people from various backgrounds with a wide range of ‘digital competence’, learning abilities, interests and inclinations. While some students might be ‘digital natives’ others might merely be familiar with the basics (Eynon & Malmberg, 2012). Studies on digital usage and competence have been a focus in educational contexts while technostress has been a main focus for studies in an organisational context. However, comparably, studies focusing on technostress in education/among students are scarcer.
1.1
Literature review
Several studies have contributed to the body of technostress research. Most prominently, research has focused on technostress within organisations, such as the prevalence of
technostress and influence of expertise and education on technostress of workers (Ishola, Obasi & Oluwole, 2019), whether individual characteristics influence the type of technostress
experienced by employees (Marchiori, Mainardes & Rodrigues, 2019), how the perception of technostress is influenced by levels of the personality of workers (Maier, Laumer, Wirth & Weitzel, 2019), technostress in an HR-context (Florkowski, 2019), among many more studies on workers’ technostress (Suh & Lee, 2017; Hwang & Cha, 2018; Hauk, Göritz & Krumm, 2019; Khedhaouria & Cucchi, 2019; Ma & Turel, 2019; Pirkkalainen, Salo, Tarafdar & Makkonen, 2019).
Some researchers have further developed operationalisations that can be used to measure technostress to a certain extent. Tarafdar, Tu, Ragu-Nathan and Ragu-Nathan (2007), operationalised five measurable factors of technostress; techno-overload, techno-invasion, techno-insecurity, techno-complexity and techno-uncertainty. These five factors have been used in many studies conducted on technostress since (Chen, 2015; Hsiao, Shu & Huang, 2016: Brivio et al., 2018: Qi, 2019: Zainun, Johari & Adnan, 2019). Similar to Tarafdar et al. (2007), Ayyagari et al. (2011) operationalised the techno-stressors work overload, role ambiguity, invasion of privacy, home-work conflict and job insecurity for an organisational context. Studies that have been conducted in an educational context have similarly utilised these operationalisations as there is a lack of operationalisations specifically developed for an educational context (Qi, 2019: Verkijika, 2019: Hossain, Nurunnabi, Hussain, Saha & Wang: 2019).
There have been some studies made on technostress within education. One of them is a study of technostress among secondary teachers in South Korea (Joo, Lim & Kim 2016). Research on technostress among university personnel has been carried out in China (Wang & Li, 2019), Malaysia (Zainun, Johari & Adnan, 2019) and Finland (Syvänen, Mäkiniemi, Syrjä, Heikkilä-Tammi & Viteli, 2016). In Hong Kong, Qi (2019), developed a framework to examine the negative and positive effects of mobile usage among university students. This study found that the use of mobile devices in education related work and classroom activities does not directly generate technostress, but it aids in improvement of academic performance. Furthermore, Qi (2019) concludes that there is a significant relation between the student’s self-concept and generated technostress. In the USA, Booker, Rebman Jr & Kitchens (2014), examined online students and technostress caused by online education. The researchers developed a
measurement for technostress with online students based on the previous measurement tools available for an organisational and work context. In Bangladesh, Hossain, Nurunnabi, Hussain & Saha (2019), studied the effect of increased use of social networks through mobiles on the academic performance of university students. The study showed that there was a significant effect on increased usage of social networks and academic performance. In Pakistan, Ahmed, Salman, Malik, Streimikiene, Soomro & Pahi (2020), conducted a similar study where they examined the effect smartphones had on the academic performance of university students. This study equally showed that smartphones had a significant influence on academic performance. A study of university teachers in China (Wang, Tan & Li, 2020) examined the relation between ICTs and job performance and found a notable relation between the two. Finally, a study of students in South Africa, examined technostress associated with digital textbooks (Verkijika, 2019). This study also found that technostress had a direct negative effect on the use of digital textbooks. In addition to this, there is also research on the effectiveness of various ICTs as support for students with learning disabilities (Fitchen et. al, 2012: Drigas et. al, 2014: Obradovic et.al, 2015: Adam & Tatnall, 2017).
Despite an assortment of research on technostress within the academic sphere and various studies specifically on university students in different countries and cultures, there is a lack of research on the Swedish context. Sweden is an interesting cultural context to base such a study due to the rapidly developing and technologically advanced society with a large number of digital natives (Findahl & Zimic, 2008; Samuelsson, 2010). Technological advancements and the use of ICTs in education have become a natural part of the Swedish education system (Chaib, Chaib & Ludvigsson, 2004).
However, the established view of young people as digital natives in combination with their high usage of the Internet could result in a “digital divide” between them (Facer & Furlong, 2001; Livingstone & Helsper, 2007; Bennett, Maton & Kervin, 2008; Selwyn, 2009). Such a divide could be problematic in a digital native society as a “non-digital native”. For this reason, it is important to study the cases of such contexts. The present study, therefore, aims to fill this gap and provide an insight into how the phenomenon affects students at Malmö University (MAU) in Sweden. As technology becomes an inevitable part of education in both lower and higher levels, how affected are university students in Sweden by potential technostress?
1.2
Purpose and research question
The purpose of the present study is to give insight into how prevalent technostress is among students at MAU in Sweden and whether technostress affects their perceived academic performance. The research presented is intended to extend the current literature on the use of technology and how it can induce stress in higher education by putting it in a Swedish context. The following question will be examined:
How do different technology characteristics influence students’ technostress and perceived academic performance at MAU?
1.3
Delimitations
This study focuses on university students of five faculties at MAU in Sweden and technostress in relation to their perceived academic performance. To fit the scope of the study, limited to the location of Sweden, MAU, and only include perceived academic performance in relation to technostress and not actual academic results. Inquiring about students’ academic results was deemed too invasive. The technology that is examined is limited to ICTs, not including other types of technology. Statistical analysis techniques that were included in this study is the proportional stratified random sampling strategy, a reliability analysis using Cronbach’s alpha, and a bivariate analysis. However, other statistical treatments of data did not seem to fit into the nature of the study and have thus not been considered.
1.4
Target audience
This study is aimed at academia and scholars as well as researchers on technology and its influence on people. Thus, this study is meant to add to the body of research on technostress in relation to perceived academic performance. The current study falls within the field of media technology due to its focus on ICTs and their possible influence on stress.
2
Theoretical framework
ICTs and digitisation have been found to be a possible contributor to stress development. As education has become more and more digitised, it can be meaningful to look at the environment in which they both exist in.
2.1
Stress theory
The concept of stress has been discussed/studied in various fields, and as such a universal definition has been difficult to establish, as the meaning may differ depending on the scientific context in which it is used. Generally, stress refers to an over-stimulated situation that rises both physically and psychologically when the brain perceives external and/or internal circumstances as dangerous or harmful (Folkman, 1984). Stress can be caused by various factors but are generally divided into traumatic events, continuous troubles, and problems in daily life (Hess & Copeland, 2006). The effect and intensity may differ from person to person and case by case. However, research has shown that exposure to stress for a long time can have severe effects and cause cognitive, emotional and behavioural problems (Schneiderman et. al., 2005).
Additionally, excessive amounts of stress can cause health problems (Sapolsky, 2004). Eustress, distress, hyperstress and hypostress have been determined as four variations of stress that, if balanced well, can lessen negative effects and be healthy (Seyle, 1976). Eustress is positive, often short-term, stress that emerges as a result of any activity involving the need for increased motivation and/or inspiration. In contrast, distress is negative stress induced by changes in a routine that causes unpleasantness and unfamiliarity. Distress itself can be further divided into acute (intense, quick and short-term stress) and chronic (prolonged stress) types. Furthermore, hyperstress is induced as a result of overwork when pushed beyond one's limits which often has the consequence that smaller stressors trigger a bigger emotional response. The opposite is called hypostress which is induced from boredom or the lack of challenges and can have the consequence of restlessness and indifference. Stress is intrinsically neutral and varies in degree and effect depending on context and individual perception. (Seyle, 1983) In other words, the identical stressor can cause eustress or distress, but it is the individual discrepancies that induce either one of them (Hargrove, Nelson & Cooper, 2013).
2.2
Academic stress
Academic stress falls into the “daily life” category of stressors and is a term that specifically refers to the stress-induced in an educational context. It can refer to any type of educational level but studies have most often focused on university students. Due to the challenging nature of education and academia, students often experience high amounts of stress. High amounts of academic stress can, like other stressors, have a negative impact on mental and physical health, as well as academic performance (Campbell et. al. 1992; Hamaideh, 2011). Stressors such as financial problems, time constraints, and pressures on academic achievement are all part of academic stress, which can cause intense stress for university students (Campbell et. al., 1992). The degree of stress the individual experiences is to some extent influenced by the ability to cope with particular stressful events (Zeidner, 1992). The amount of stress can also differ between students and non-student peers, as well as from year to year (Keinan & Perlberg, 1986). Many first-year university students at an undergraduate level struggle to adapt to the academic environment and develop the skills required to navigate it in a short period of time (Campbell et.al., 1992). The struggle to adapt and balance personal life with academic life has also been found to be a cause of stress for undergraduate students (Shirom, 1986). Keinan & Perlberg (1986), demonstrated that there often is a higher amount of stress experienced by first and third-year students compared to the second-year students. They suggest that this might be due to the difficulty of finding a balance and ability to adapt for the first-year students, while the third-year students might perceive an increase in pressure to achieve academically. Some research suggests a difference in the experience of academic stress based on gender. Female students have been found to experience a higher level of stress than their male peers (Calvarese, 2015; Anbumalar, Dorathy Agines, Jaswanti, Priya, Reniangelin, 2017). However, the
difference can be a result of male students feeling less willing to share experiences of stress openly, and thus create this divide (Zeidner, 1992). Studies have shown that there is a difference in academic stress seen in students with different socio-economic backgrounds (Bhat et. al, 2016). Difference in perceived stress depending on academic field (Anitei et. al, 2015; Bowen et. al, 2016).
2.3
Technostress theory
ICTs have become more and more ingrained into personal and work life in modern society. It has resulted in stress stemming from being constantly connected (or the feeling thereof) and available. In 1984 clinical psychologist Craig Brod coined the term ‘Technostress’ to refer to “the inability to cope or deal with ICTs in a healthy manner.” (Brod, 1984). The phenomenon
has mostly been studied in organisational contexts, where the struggle is described as relating to an inability to adapt to changing technology (ICTs) and the requirements of their use, such as physical, social and cognitive. The consequences of technostress take the form of individual workers’ dissatisfaction, fatigue, anxiety and overwork. These in turn will have a negative effect on productivity. (Tarafdar et al., 2007) Ayyagari et al., (2011) operationalised technology characteristics such as usefulness, reliability, complexity, presenteeism, and the pace of change. Different studies suggest that there are differences in the amount of perceived technostress depending on gender, age and digital literacy. Some studies indicate that technostress is experienced less in women compared to men, older people compared to younger, and in people with higher digital literacy compared to people who struggle more with technology (Tarafdar et. al, 2007: Ragu-Nathan et. al, 2008: Tarafdar et. al, 2011: Maier, 2014). However, these factors should not be considered as separate from each other, but rather through a lense of
intersectionality since many of these factors can be interconnected. For example, more positive attitudes towards ICT use in older people tend to be correlated to higher self-efficacy and higher education (Zambianchi et. al, 2019), while negative attitudes tend to be related to lower self-efficacy and lower education (Zambianchi et. al, 2019). With this intersectional reasoning in mind, the results from this study can be seen from the notion the social classifications mentioned above (gender, age etc.) naturally correlate to each other. Therefore, constructing “interdependent systems” of advantages and disadvantages (Cooper, 2016).
A large amount of research on technostress focuses on the negative aspects that are caused by technostress (Salanova, Llorens, & Cifre, 2013: Tarafdar, Pullins, & Ragu-Nathan, 2014). However, some researchers suggest that there are also positive sides to technostress that should be considered (Sethi et. al, 1987: Califf et. al, 2020). Similarly, to previous research on general stress, technostress has been divided into the sub-categories techno-eustress and techno-distress to describe negative and positive effects that the process has (Tarafdar, 2017). Califf et. al (2020) developed the framework surrounding these sub-categories further by constructing a holistic approach that considered both negative and positive effects instead of merely focusing on negative effects. Viewing technostress through this perspective is a slight deviation from previous research which further links the notion that depending on the individual’s judgement, technostress can have negative or positive outcomes (Califf et. al, 2020). Although their research added depth and nuance to the discourse, the study was conducted in the context of healthcare technology, which means that it is developed with an organisational context in mind. Despite this, the holistic approach adds a dimension to the framing of technostress that can be
relevant in other contexts as well and thus will be kept in mind when discussing the results in the current study.
2.3.1
Techno-stressors
Within stress theory, stress is said to be induced by stressors, and similarly, technostress is induced by so-called techno-stressors. Tarafdar et al. (2007) operationalised technostress into five stressors from an organisational context. These are overload, techno-invasion, techno-complexity, techno-insecurity and techno-uncertainty. As this study concerns an educational context rather than an organisational one, only the three techno-stressors that were deemed relevant will be described further. Techno-overload pertains to situations where the stress from ICTs results in longer work hours at a faster pace. Techno-invasion refers to situations in which workers have access to one another and are expected to be reached anytime, meaning constant connectivity that can create an ambiguous line between the work and personal spheres. Techno-complexity pertains to situations where an individual perceives ICTs to be too complex to use and that their skills are inadequate and thus feel the need to spend time learning about different aspects to the ICTs.
Ayyagari et al. (2011) operationalised techno-stressors in an organisational context with stressors such as, work overload, work-home conflict, and role ambiguity. The work overload stressor refers to the increased workload due to the ICTS. The work-home conflict refers to the blurring of boundaries between the workplace and home due to the increased ability through ICTs to work from home. Role ambiguity refers to the difficulty in prioritising work-related responsibilities due to ICTs. The demand to respond to constant incoming e-mails can cause uncertainty as to which tasks should be finished first.
Technostress, like dealing with other types of stress, can be managed with the aid of coping strategies. Methods such as “user-friendly software”, education on new technology, mental and physical relaxation, restrict use of technology in some aspects of life (Chiappetta, 2017). Ragu-Nathan, (2008) suggest that operating general stress management activities such as exercise, meditation, staying healthy, healthy diet, muscle relaxation, etc. lessens the experienced technostress as well.
2.4
Technology characteristics
Ayyagari et al. (2011) have operationalised six different technology characteristics; usefulness, complexity, reliability, presenteeism, anonymity, and pace of change. Five of these technology characteristics were deemed relevant for the study and will be explained further. Usefulness refers to the perception of how useful ICTs are in relation to completing work-related tasks. Complexity refers to the perception of ICTs’ ease of use. Reliability refers to the perception of how reliable ICTs are. Presenteeism is a characteristic that aims to measure the accessibility ICTs enable the user to have to others and vice versa. ICTs may provide different degrees of connectivity, but the ability of being reachable at any time, anywhere, may lead to burnout. The characteristic pace of change refers to the pace of which ICTs change, as well as the consistency in which they behave. (Ayyagari et al., 2011)
2.5
Academic performance
Many different factors affect the academic performance of a student. Individual differences such as intelligence and personality have, for example, been found to be associated with academic performance (von Stumm, 2011). Other factors such as motivation and self-control are also factors that can influence how well a student performs academically. However, students' perception of their own abilities and skills have been shown to have an impact on their performance and willingness to pursue and/or persist in certain activities. Research has previously demonstrated that those who underachieve often have a low self-perception
(Dowdall & Colangelo, 1982; Whitmore, 1983; Hishinuma, 1996; Diaz, 1998). Although some research has reached the conclusion that the contrasting social upbringings of the different genders (Holland, 1998), most seem to agree that there is a correlation between achievement and perceptions (McCoach, 2002). A correlation has also been found between positive self-concept and academic achievement (Marsh et al., 1995).
Correlation between positive self-perceptions and academic achievement has been shown to be significant, but not yet many studies have been conducted on what causes what and if it creates a negative cycle (Reis & McCoach, 2000). McCoach (2002), has operationalised academic self-perceptions into four items; Academic Self-Perceptions, Attitudes Toward School, Peer Issues, as well as Motivation and Self-Regulation. Academic Self-Perception refers to an individual’s view and understanding of their academic achievements and abilities. Equally, Stajkovic (2018), suggests that the Self-efficacy of an individual is one of the best ways to predict academic success. Similar to the notion of Academic perception, Stajkovic discusses the term
Self-efficacy refers to an individual’s belief in their abilities to do something and how it relates to academic performance. His study observed that Self-efficacy was more demonstrative of academic performance than the personality of an individual. This infers that improving one’s self-efficacy is more important than having an innate personality type that is more inclined to perform well academically. Naturally, all factors combined are important in assessing effect on academic performance. However, as mentioned above, since self-efficacy has a higher impact on academic performance- perhaps more vital to study in order to determine the link between technostress and academic performance. The other factors might also be harder to assess as someone’s personality is not necessarily static, nor easy to conceptualise. Intelligence linked to academic performance could be a way to determine the effect technostress has on perceived academic performance. However, since the present study focuses on perception and not actual academic performance, examining intelligence would contradict the purpose of the research. Furthermore, what constitutes academic achievement may vary depending on the person. Generally, though, it is believed that the notion is defined as the achievement of short or long-term educational goals (such as test results, degrees etc.) (Ward, Stoker, & Ward, 1996). Thus, to clarify the notion will be used in the general concept of the term.
2.6
Cultural and situational contexts
Attitudes and usage of ICTs have been found to differ depending on cultural context and country (Agbetuyi, 2012: Chen, 2015: Krishnan, 2017: Zambianchi et al., 2019). Differences in attitudes were identified even within a European context. Zambianchi et al. (2019), for example, identified more positive attitudes towards ICTs among elderly in Sweden compared to Italy. However, there was a positive approach detected among higher educated people regardless of gender, nationality and age in both countries. Despite an overall positive approach among higher educated, there was a higher number of male participants with positive attitudes than female in Italy whereas no discernable difference in attitudes between the genders in Sweden (Zambianchi et al., 2019). However, the researchers of the study also suggest that there is a difference in time perspectives, which is an important factor to account for the variability in attitudes towards and use of ICTs in old age and appears to exert an influence over and beyond other significant predictors, such as cultural context, age, and educational level. In contrast to this Krishnan (2016), maintains that upheld cultural values can illustrate differences in technostress further than merely observing the more conventional factors like gender, age, education and digital literacy. Instead, he suggests that acknowledging linkages of personality and culture to technostress is a better method to predict techno-stressors. Therefore, a holistic
approach to an intersectional understanding of social categorisations enables for a more deep and interconnected analysis.
This study was carried out in the spring of 2020 during the COVID-19 pandemic. During this time universities all over the world switched from in-classroom lectures to online learning through digital technologies. This shift could have had an effect on the results since students were forced to use ICTs in situations where they previously would have been physically present. MAU decided to adopt full online studies and closed all its premises for students. As many students chose to stay at home during this time to diminish the spread of the virus, the main source of communication occurred through ICTs, whether it was school-related or for social purposes. Even though ICTs are already heavily used in this way, the situation during the pandemic may have exacerbated the issue of technostress. Although this study does not
primarily focus on the specific case of the pandemic (as a study before or after has to be done to properly comment on to what degree the current state has affected students), it is essential to note that this study occurred in these circumstances, as well as the cultural context.
Chiappetta (2017) discusses how the lines between when connected to work are blurred more through ICTs and even more so when there is no official agreement as to when this connectivity ceases. Because of this blurring, a worker can consider this constant connection to simply be an integral part of the working environment (Chiappetta, 2017). In an education context, there is usually no specific agreement as one is expected to be constantly updated since deadlines, e-mails, etc. can appear outside of study hours. Due to this, students may simply accept the constant connection and not realise that this is something that causes them stress.
3
Research model and hypotheses
Taking into account the aforementioned theoretical research on stress and stress-induced by technology, this study examines the prevalence of technostress among university students in Sweden. Figure 1 depicts the research model of the study and demonstrates the proposed relationships between technology, which is represented by different technology characteristics, and techno-stressors, as well as the relationship between techno-stressors and students’
perceived academic performance.
H1a: Technology characteristics (presenteeism and pace of change) will be positively associated with techno-stressors (work overload, role ambiguity and school-home conflict).
H1b: Technology characteristics (usefulness, reliability and complexity) will be negatively associated with techno-stressors (work overload and techno-complexity).
H2: Techno-stressors will be inversely associated with perceived academic performance.
Figure 1. The proposed research model for this study.
TECHNOLOGY CHARACTERISTICS TECHNO-STRESSORS PERCEIVED ACADEMIC PERFORMANCE
H1a
H1b
H2
4
Research methodology
When conducting social research, it is inevitable that the research process will be influenced by epistemological positions. A central issue raised is the question of which ethos, principles and procedures the research design should be in accordance with. (Bryman, 2012) Many different research designs can be applied to research, depending on what the purpose of the study is. For this study, in order to be able to draw conclusions of the potential technostress of students at MAU in general terms, a large number of participants are needed, as the results otherwise only can reflect specific individuals and their experience, making it difficult or even impossible to generalise. Thus, a high level of participation is desired. However, many research designs, such as interviews, for instance, become time-consuming to conduct in studies with a large number of participants. The use of survey design, and more specifically self-administered
questionnaires, on the other hand, allows for a large number of respondents, whose answers, in turn, can be generalised. The purpose of survey research is, in other words, to generalise from a sample of a population in order to draw conclusions from trends, attitudes, opinions or
behaviour of this population. (Creswell, 2014) It would not be relevant to the study’s research question and research hypotheses to examine only a few students at MAU, since the results would not indicate the influence of different technology characteristics on students’ technostress overall, but only how a select few experience technostress. What is of relevance is to be able to generalise to the population so that a more accurate conclusion can be drawn about the whole population’s potential technostress. However, the time and scope of this research did not allow for a larger more in-depth study, nor was it reasonable to collect census data. It should also be noted that in survey samples with small fractions of a population there will be no effect on the ability to generalise if small additions are included. The generalisability or how well a
population is described by a sample will neither be affected by the size of the population from which the sample is drawn (Fowler, 2009). An important factor to the ability to generalise is representability, which can be achieved in the sampling process through appropriate methods (Dillman et al., 2014).
In studies where generalisability is desired, a quantitative research strategy may provide that possibility. Such research strategies focus on quantification in the collection and analysis of data and generally tend to have a deductive approach to the relationship between theory and
research, where the objective lies in the testing of existing theories (Bryman, 2012). As the purpose of the present study is to test existing theories of technostress to a specific population, a quantitative research strategy with a deductive approach was deemed fitting/appropriate.
The study is, like most quantitative research strategies within the social sciences, heavily influenced by the natural scientific model, and has incorporated many of its norms and practices. Mainly the influence can be seen in the reduction of people and phenomena into numbers and the attempt in finding a quantifiable explanation. In many ways, it could be said that the study aligns closely with the position of positivism or critical realism in particular. The two epistemological positions share similarities, notably in the view that the same principles and procedures should apply to both the natural and the social sciences. The principles and
procedures in question refer to, including other things, the natural scientific model and the emphasis on quantification in data and explanation. The positions share the view of an external reality of natural phenomena as a posteriori knowledge through empirical observations and logical analysis (Babbie, 2016). However, the two epistemological notions differ in the
perspective of the conceptualisation of reality, where positivists argue that the conceptual reality of scholars is a direct reflection of that reality, whereas critical realism takes the position that the conceptualisation is merely a way of knowing that reality (Bryman, 2012). In this aspect, it could be suggested that the present study aligns closer to critical realism.
4.1
Data collection
Data were collected through an online self-administered questionnaire distributed through e-mails to 375 students enrolled in courses at MAU during the period of April 2020. The survey was designed using the survey tool SunetSurvey with a set of items on a 5-point Likert scale. Each student’s email address was put into the survey tool, and 4 mailings were set to be sent out at 09:00 at specific dates, the first introducing the study for the first time and the next four serving as reminders, sent out a week apart. 56 students responded, resulting in a response rate of 14.9%. Responses with incomplete answers were eliminated. The remaining responses totalled 55 which were utilised as the final data set to be analysed.
4.2
Measures
The instrument used to collect data contained constructs by Ayyagari et al. (2011) for the measures for the technology characteristics and a combination of constructs by Ayyagari et al. (2011) and Tarafdar et al. (2007) for the measures of the techno-stressors. McCoach’s (2002) constructs for academic self-perceptions were also used. Some constructs were slightly
modified to ensure they were fit for purpose, such as “Using ICTs blurs boundaries between my job and my home life” and other similar constructs connected to the workplace. All items were
in the form of statements as can be seen in table 1. The response choices consisted of a Likert scale ranging from 1 (strongly disagree) to 5 (strongly agree). These operationalisations were chosen because other research has utilised them in various studies, including ones about students. It was therefore deemed that these constructs are able to be modified to fit the educational context.
Table 1. Constructs and measures
Constructs and measures Items Source/Theory
Technology Characteristic: Usefulness
Aims to measure the perception of how useful ICTs are in relation to completing school-related tasks.
Use of ICTs enables me to
accomplish tasks more quickly. Ayyagari et al. (2011) Use of ICTs improves the quality of
my schoolwork.
Use of ICTs makes it easier to do my assignments.
Use of ICTs enhances my effectiveness at school. Technology Characteristic:
Reliability
Aims to measure the perception of how reliable ICTs are.
The features provided by ICTs are
dependable. Ayyagari et al. (2011)
The capabilities provided by ICTs are reliable.
ICTs behave in a highly consistent way.
Technology Characteristic: Complexity
Aims to measure the perception of ICTs’ ease of use.
Learning to use ICTs is easy for me. Ayyagari et al. (2011)
ICTs are easy to use.
It is easy to get results that I desire from ICTs.
Technology Characteristic:
Aims to measure the perception of connectivity provided by ICTs.
ICTs make me accessible to others.
The use of ICTs enables me to be in touch with others.
ICTs enable me to access others. Technology Characteristic:
Pace of change
Aims to measure the perception of frequency in changes of ICTs.
I feel that there are frequent changes
in the features of ICTs. Ayyagari et al. (2011) I feel that characteristics of ICTs
change frequently.
I feel that the capabilities of ICTs change often.
I feel that the way ICTs work changes often.
Stressor: Work overload
Aims to measure the perception of higher workload due to ICTs.
ICTs create many more problems, or complaints in my studies than I would otherwise experience.
Ayyagari et al. (2011); Tarafdar et al. (2007)
I feel busy or rushed due to ICTs. I feel pressured due to ICTs.
I am forced by ICTs to do more work than I can handle.
I am forced to change my work habits to adapt to new technologies.
I have a higher workload because of increased technology complexity.
Stressor:
School-Home conflict
Using ICTs blurs boundaries between
Aims to measure the perception of blurred boundaries between school life and home life.
Using ICTs for school-related work responsibilities creates conflicts with my home responsibilities.
I do not get everything done at home because I find myself completing school-related work due to ICTs.
I have to sacrifice my vacation and weekend time to keep current on new technologies.
I feel my personal life is being invaded by ICTs.
Stressor: Role ambiguity
Aims to measure the perception of difficulty in prioritising school-related responsibilities due to ICTs.
I am unsure whether I have to deal with ICT problems or with my schoolwork activities.
Ayyagari et al. (2011)
I am unsure what to prioritize: dealing with ICT problems or my schoolwork activities.
I can NOT allocate time properly for my schoolwork activities because my time spent on ICTs-activities varies.
Time spent resolving ICT problems takes time away from fulfilling my schoolwork responsibilities.
Stressor:
Techno-complexity
Aims to measure the perception of competence regarding ICTs.
I do not know enough about ICTs to
handle my studies satisfactorily. Ayyagari et al. (2011); Tarafdar et al. (2007)
I need a long time to understand and use new technologies.
I do not find enough time to study and upgrade my technology skills.
I find other students at this university know more about computer
technology than I do.
I often find it too complex for me to understand and use new technologies.
Academic self-perceptions
Aims to measure the perception of academic performance.
I am confident in my scholastic
abilities. McCoach (2002)
I do well in school.
I learn new concepts quickly. I am successful.
I am confident in my ability to succeed in school.
4.3
Pilot-testing
The nature of self-administered questionnaires means the intelligibility of the language is crucial, as there is an absence of the interviewer who can clarify any incomprehensible questions. Accordingly, a pilot test is suitable to detect flaws of the survey questions, question order, visual design and navigation issues (Dillman et al., 2014). Fink (2017) emphasises that pilot tests must be carried out when conducting self-administered questionnaires. The pilot test will grant the opportunity to trial the instrument in a simulation of its intended setting before finalising the survey (Fink, 2003), with the purpose of producing well-developed items that obtain the right information needed (Fink, 2017). For this study, the pilot test included 4
students from other universities in Sweden than MAU. The population of the study is students at MAU, but for an effective pilot test it is only important to use similar respondents to the
intended population (Fink, 2003) and for that reason, any university student attending a university in Sweden were accepted as satisfactory participants. The first question asks if the respondent is a student attending MAU, in which choosing the answer “no” will end the survey. The participants of the pilot test were told to choose “yes” to ensure they could complete the questionnaire, as well as choose any alternative of faculties listed in the succeeding question.
The remaining items consisted of statements to which the participants chose to what degree they agreed or disagreed that the statement applied to them. The survey responses were timed from start to finish to gauge roughly how long it takes to complete. Then, using Fink’s (2003) suggested pilot test questions, the participants responded to the series of questions where they could provide feedback about the survey as a whole, as well as individual items. See appendix 3 for Fink’s (2003) pilot test questions.
The feedback from the pilot test brought about a few changes to the questionnaire. The question asking whether the respondent is a student at MAU was removed after it was pointed out by one of the participants that there may be students from other universities who are enrolled in courses at MAU, as this is common regarding elective courses that may not be offered at their
university. Potentially, such students may interpret that they belong to the other university, even though they are enrolled in courses at MAU, and choose the “no” option, thus ending the survey. After some reflection, the risk of non-MAU students responding to a survey sent to a specific list of people was deemed rather low, and so the change was made. Other feedback included the need for a clarification of the terms “features” and “capabilities”, etc.
4.4
Sampling
The population of interest is, as mentioned, students attending MAU in Sweden. There are, during the spring term of 2020, 14 674 students enrolled in courses at MAU. An issue that could potentially affect the study is the potential difference in competence with technology between students. For example, it could be the case that students who are enrolled in more tech-heavy educational programmes may possess greater technological knowledge than their peers. If this is the case, it is important that students from all sorts of educational programmes are given the possibility for inclusion in the study, or the results may be skewed from the beginning if, for instance, there were to be a higher number of students from tech-heavy educational programmes participating in the study or vice versa. For this reason, it was decided that all students from all the university’s faculties would be given an equal possibility to be selected for the
study. However, this study will not examine the technological competence between faculties. To approach this issue, proportional stratified random sampling is a suitable method of
sampling. Stratified sampling makes sure that all desirable characteristics have the ability to be included in the study by dividing the target population into strata. (Fink, 2017) For this study the students were divided into five strata, that is the faculties at the university: the Faculty of Culture and Society (CS), the Faculty of Education and Society (ES), the Faculty of Health and
Society (HS), the Faculty of Technology and Society (TS), and the Faculty of Odontology (OD). This way respondents from each faculty were included in the sampling and any potential differences between the faculties could be observed.
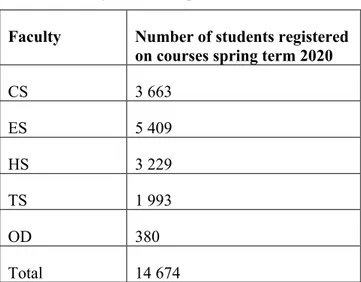
Lists of information regarding faculty membership and e-mail addresses of the students at MAU were retrieved by administrative personnel dealing with Ladok, the student administration system used by Swedish universities and college universities. Table 2 presents the number of registered students at each faculty during the spring term of 2020. Students who were registered at the university, but not registered on any courses are not included in the table.
Table 2. Faculty membership.
Faculty Number of students registered on courses spring term 2020
CS 3 663 ES 5 409 HS 3 229 TS 1 993 OD 380 Total 14 674
The first step to acquire the sample was thus to calculate the size of the sample. There are many ways in which to determine an apt sample size. One way is by using existing sample size tables made by scholars for researchers’ easy use, such as the one presented by Krejcie and Morgan (1970). Their table uses the formula developed 1960 by the research division of the National Education Association (NEA) in the USA as a basis, where
𝑠 = 𝑋$𝑁𝑃(1 − 𝑃) 𝑑$(𝑁 − 1) + 𝑋$𝑃(1 − 𝑃).
The notation from Krejcie and Morgan (1970) for the above formula is the following:
s = required sample size.
X2 = the table value of chi-square for 1 degree of freedom at the desired confidence level
(3.841).
P = the population proportion (assumed to be .50 since this would provide the maximum sample
size).
d = the degree of accuracy expressed as a proportion (.05).
As can be seen in Table 1, the total number of students registered during the spring term of 2020 were 14 674 students. Using Krejcie and Morgan’s (1970) table we arrive at a sample size of 375 for a population of 15 000.
Testing with the formula above of which their table is based upon, our equation will display:
1.96$× 14674 × 0.5(1 − 0.5)
0.05$(14674 − 1) + 1.96$× 0.5(1 − 0.5)= 374.38 …
The population in this research is slightly under 15 000, so it seems reasonable that the equation arrives at a sample size of 374. Using the same formula for a population of 15 000 gives the answer 374.5, which is then rounded to 375 people, which is what their table displays. The table is intended as an approximation, and for that reason, this study’s population was deemed close enough to 15 000.
As mentioned earlier, this overall sample size of 375 students is further divided into five strata. However, the strata differ in sizes, meaning that dividing the overall sample size equally will not give a proportional reality. When the strata sizes differ, proportional allocation can be used to make the samples of each stratum contain individuals in the same proportion as they appear in the entire population of their respective strata (Thompson, 2012; Dillman et al., 2014). Maintaining a steady sampling fraction throughout the population allows for generalisability to the whole population (Thompson, 2012), as is desired for this study. The formula used in this study to ensure a proportional stratified sample is the following presented by Thompson (2012), where N is the total population size, n is the total sample size, and stratum h has Nh units, making the allocated sample size
𝑛9 =𝑛𝑁9 𝑁 .
Using the CS faculty as a demonstrative example, the proportional stratified sample will be the following:
375 × 3663
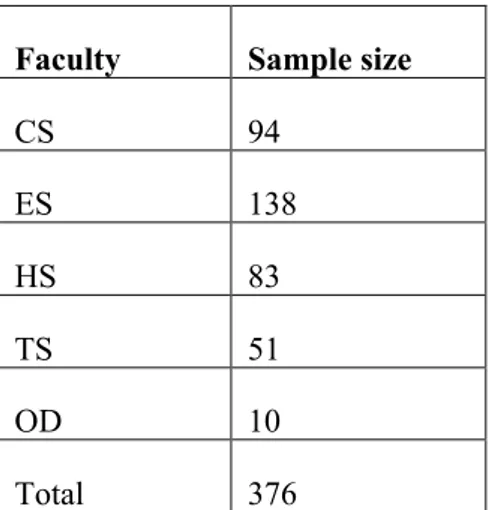
Table 3 shows each allocated sample size for the five strata. Each stratum sample size resulted in decimal digits needing to be rounded to a whole number, as decimals cannot represent numbers of human beings. As such, the total sample size totalled 376, instead of 375 as is suggested by Krejcie and Morgan’s (1970) table. However, this is only a small difference, and as it is important that the total sample size is divided into proportionate stratified samples, and because we cannot have half a person, it was necessary to round the decimals to whole numbers.
Table 3. Sample size allocated to each stratum.
Faculty Sample size
CS 94 ES 138 HS 83 TS 51 OD 10 Total 376
In order to secure representability, the sample should be drawn using a probability sampling method, as such methods allow an equal probability of selection for each individual in the population to take part in the study (Creswell, 2014). The sampled individuals can then be representable for the entire population (Dillman et al., 2014). As representability is vital to be able to generalise to the population (Bryman, 2012), the simple random sampling method was chosen. Potential respondents were drawn by the Ladok administrative personnel.
4.5
Data analysis procedure
The data set from the survey tool SunetSurvey was exported into a Microsoft Excel file and then opened in the software SPSS statistics 26. The analysis procedure was then conducted in SPSS through four steps. First, each respondent was assigned a unique ID and the data was prepared by inspecting the frequency distribution and any missing values. In this step the focus lied in preparing the data for analysis and examining the data for any skewness. This was done through the Frequencies function in SPSS. Missing values were detected for one participant who had only submitted answers for three items leaving the rest blank. This participant’s values were removed and excluded from the analysis. Then, the reliability of the items were checked using Cronbach’s alpha with the Reliability Analysis function. Third, all items that corresponded to
the same variable in the study, for instance, all items pertaining to the variable work overload, were made into an index with a mean value. These indices, from now on variables, were put through a bivariate analysis, a Pearson product-moment correlation coefficient, using simple cross-tabulations to identify any trends and possible associations between the variables. This was done for each pair of variables using the Bivariate function.
4.6
Validity and reliability
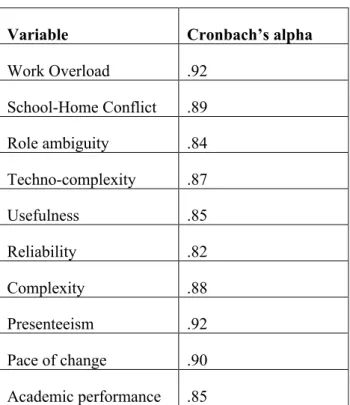
The reliability of the items in the construct were tested through measuring the internal
consistency with Cronbach’s alpha, to see how closely each set of items are related as a group. All items showed acceptable levels of reliability as can be seen in Table 4.
Table 4. Reliability Analysis
Variable Cronbach’s alpha
Work Overload .92 School-Home Conflict .89 Role ambiguity .84 Techno-complexity .87 Usefulness .85 Reliability .82 Complexity .88 Presenteeism .92 Pace of change .90 Academic performance .85
The reliability of the constructs strengthens the measurement validity. These constructs have also been tested by the creators and other researchers in previous studies.
4.7
Method discussion
The purpose of this study is to examine technostress among students at MAU, and if technostress affects their perceived academic performance. To investigate technostress and perceived academic performance, various methods can be adopted. However, in order to be able
to generalise to all MAU students and make broader conclusions a survey can be conducted. Addiotionally, connections can be made to the cultural context of the study through this method. Interviews were therefore a less fitting method as it would not open for the same ability to generalise. The application of a quantitative research strategy can be advantageous when generalisation is the desired outcome. (Bryman, 2012). There are several advantages with this method. For example, a large sample can be obtained for a lower cost and less time-consuming than other methods. Respondents also have time to consider their answers as well as return to the survey at a later time or go back and forth through sections. All questions are the same for all participators. (Creswell, 2014) Another advantage is the rapid turnaround in data collection online surveys provide (Sue & Ritter, 2007). In contrast, there are also disadvantages. For example, when using a survey there is a risk for Non-response. In addition, the respondent is not able to inquire further about sections in the survey that might be unclear or difficult to
understand. Lastly, there is the disadvantage of not being able to include exceptionally complicated or supplementary questions that could benefit in-depth analysis. (Creswell, 2014)
4.7.1
Ethical considerations
The Swedish Research Council (Vetenskapsrådet, 2002) developed ethical principles for
research, among them Criterion of protection of the individual which can be understood through their four main principles. These four principles are called the informationskravet (requirement of information), samtyckeskravet (requirement of consent), konfidentialitetskravet (requirement of confidentiality) and nyttjandekravet (requirement of access and use). Informationskravet refers to the researcher's requirement to clearly inform of the purpose of the research to whoever is involved in the study. It is vital that the people involved are aware of the potential risks and harm, as well as clearly state to participants that the participation in the research is voluntary and that the data that is collected will only be used for the purpose of the study. This should be informed in written documentation or orally, and should be provided together with, for example, a survey, interviews or other data collection methods. In the case of a survey research, it is important that this information is received in advance, before the respondent completes the survey. Samtyckeskravet refers to the right to decide over one's own participation and also the withdrawal of participation. It also refers to the participant’s right to consent of their
information, however, if the participant’s information is a part of existing official records, consent does not necessarily have to be gained. This depends on what kind of information and the laws surrounding the topic. Konfidentialitetskravet refers to the requirement that data and information on participants should be given the utmost confidentiality and that it should be
stored as not to give unauthorized access. Nyttjandekravet refers to the requirement that collected data from individual persons should only be used for the purpose of the research. In other words, data collected for the purpose of the research should only be used for the research. As the online questionnaire of the study was to be sent out to a specific list of students at MAU, selected through a simple random sample, there were ethical considerations to keep in mind regarding privacy and integrity, as well as laws surrounding it. In order for the survey to be sent out, email addresses of the selected students were acquired from MAU Ladok staff. When it comes to the collection of personal data from Ladok, it is formally a request for what is called public documents (swe. allmän handling) and it can be done as long as it does not violate the
General Data Protection Regulation (GDPR). The GDPR states in Article 86 that it should be
possible to access public documents in certain circumstances. Thereafter, a confidentiality examination shall be conducted in accordance with the Public and Privacy Act, and then the form of extradition will be regulated in the so-called Ladok Regulation. In the latter section, 6§, it states that information from Ladok can only be disclosed digitally under certain specific conditions. As such, the email addresses were collected on physical paper. When it comes to consent, it is not needed when retrieving the addresses from Ladok, however, the Personal Data Processor has an obligation to inform those whose information has been collected that it has been done, the purpose of the processing of the personal data, during what period the data will be processed and where the concerned party can turn for information, according to Article 14 of the GDPR.
4.7.2
Source criticism
The sources used for this study include peer-reviewed journal articles, academic books and literature, organisational reports, as well as academic dissertations. In order to ensure reliability in the selection of material, each source has been validated according to its credibility and accuracy. The assessment of sources should be objective in nature and can be evaluated by four requirements: the authenticity of the source, the independence and non-bias of the source, the recency of the source, and the contemporaneity of the source (Ejvegård, 2003). All of these evaluations have been taken into consideration for this study. Sources with differing perspectives have been considered and compared to confirm accuracy and depth in the
discourse. The authors and organisations of the sources are professors, researchers or otherwise experts in their respective areas. Almost all of the journals are peer-reviewed, and if not, they have several editors with specific requirements that have to be met to be published, which strengthens the credibility. The journals used are also leading in their respective fields. The
journal “Gifted Child Quarterly” and “Gifted Child Today”, for example, are two peer-reviewed journals within the field of education and learning that are published by the leading scientific research Sage publishing company. Both are also members of the Committee on Publication Ethics, which can be assumed to mean that the journal follows ethical principles. Other leading journals that are both peer-reviewed and leading in their field are “Higher Education”, “Journal of Business Research” and “MIS Quarterly”. The main aim of the journals is to present, discuss and review research within their respective field. Some of the publishing companies of the journals include Sage publishing, University Press, etc. None seem to have a hidden bias or purpose, only the aforementioned aims.
Most of the academic books and research literature are written by professors or researchers within their field. Arlene Fink, the author of two literary works used for this study is a professor of Medicine and Public Health at the University of California. Her main research has been focused on evaluation and survey research, which makes her a credible source. She has also authored more than 130 peer-reviewed journal articles and published 15 textbooks on research, education and more. Her extensive knowledge and experience make her credible.
The organisations used for this study have also been assessed. The Swedish Research Councils’ (Vetenskapsrådet) policy on research ethics and principles has laid the basis for the ethical framework of this study. The organisation is a government agency whose purpose is to support scientific research and to promote Sweden as a leading nation for research. With this in mind, it is in the Swedish Research Council’s interest to provide researchers with guidelines to ensure good research quality.
The sources vary in publication dates. Depending on the topic, the need for newer or older sources may differ. For example, research on stress and academic stress from the psychology field that often have established theories and notions may be date further back, while research on technology and technostress may quickly become outdated since its rapid development. All materials used have been of great importance and relevance for the study. Due to the interdisciplinary nature of the subject matter, research on topics like stress, technology and education, as well as the correlation between them, is essential.
5
Results
The questionnaire was sent by e-mail to 375 students of different faculties at MAU. The number of responses totalled 55 after the elimination of participants with missing values. Pearson product-moment correlation coefficient was conducted (N = 55) to evaluate the study’s hypotheses, H1a, H2b and H2.
5.1
Respondent demographic
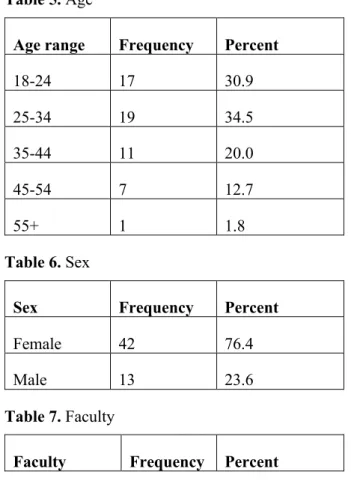
Table 5-7 display the respondent demographic. As seen in table 5, there was a larger number of participants in the age range of 25-34 at 34.6%. All age ranges were represented in the
demographic. However, there was only one respondent from the age range 55+ at 1.8%. As illustrated in table 6, there were 42 (76.4%) female respondents and 13 (23.6%) male
respondents. In other words, there were more females who participated in the study. The highest number of respondents participating were from the Faculty of Culture and Society with 21 (38.2%) respondents. Only 2 (3.6%) respondents were from the Faculty of Odontology. 1 (1.8%) respondent did not know which Faculty they belonged to. See table 7.
Table 5. Age
Age range Frequency Percent
18-24 17 30.9 25-34 19 34.5 35-44 11 20.0 45-54 7 12.7 55+ 1 1.8 Table 6. Sex
Sex Frequency Percent
Female 42 76.4
Male 13 23.6
Table 7. Faculty
Don’t know 1 1.8 Faculty of Culture and Society 21 38.2 Faculty of Education and Society 12 21.8 Faculty of Health and Society 12 21.8 Faculty of Technology and Society 7 12.7 Faculty of Odontology 2 3.6
5.2
Bivariate analysis of technology characteristics
and techno-stressors
Hypothesis H1a predicted that the technology characteristics presenteeism and pace of change will be positively associated with the techno-stressors work overload, role ambiguity and school-home conflict. There was no significant evidence to reject hypothesis H1a and there was a weak negative association between presenteeism (M = 4.05, SD = .69) and school-home conflict (M = 2.89, SD = 1.03), r (53) = -.15, p = .44. There was no significant evidence to support hypothesis H1a and there was no association between presenteeism (M = 4.05, SD = .69) and role ambiguity (M = 2.50, SD = .91), r (53) = -.07, p = .59. There was significant evidence to reject the hypothesis H1a and conclude that there was a weak, negative association between presenteeism (M = 4.05, SD = .69) and work overload (M = 2.63, SD = 1.06), r (53) = -.28, p = .04. There was no significant evidence to support hypothesis H1a and there was no association between pace of change (M = 3.19, SD = .81) and work overload (M = 2.63, SD = 1.06), r (53) = .19, p = .16. There was significant evidence to support hypothesis H1a and conclude that there was a moderate, positive association between pace of change (M = 3.19, SD = .81) and school-home conflict (M = 2.89, SD = 1.03), r (53) = .42, p <.01. There was
association between pace of change (M = 3.19, SD = .81) and role ambiguity (M = 2.50, SD = .91), r (53) = .39, p <.01.
Hypothesis H1b predicted that the technology characteristics usefulness, reliability and complexity will be negatively associated with the stressors work overload and techno-complexity. There was significant evidence to support the hypothesis H1b and conclude that there was a strong, negative association between usefulness (M = 3.69, SD = .80) and work overload (M = 2.63, SD = 1.06), r (53) = -.66, p <.01. Between usefulness and
techno-complexity (N= 55) there was significant evidence to support the hypothesis H1b and conclude that there was a moderate, negative association between usefulness (M = 3.70, SD = .80) and techno-complexity (M = 2.35, SD = .91), r (53) = -.33, p = .015. Between complexity and work overload (N = 55) there was significant evidence to support the hypothesis H1b and conclude that there was a strong, negative association between complexity (M = 3.70, SD = .80) and work overload (M = 2.63, SD = 1.06), r (53) = -.63, p <.01. Between complexity and
techno-complexity (N = 53) there was significant evidence to support the hypothesis H1b and there was a strong, negative association between complexity (M = 3.70, SD = .80) and techno-complexity (M = 2.35, SD = .91) r (53) = -.68, p <.01. As for reliability and work overload (N = 55) there was no significant evidence to support the hypothesis H1b and there was a weak negative association between reliability (M = 3.21, SD = .72) and work overload (M = 2.63, SD = 1.06), r (53) = -.25, p = .06. However, between reliability and techno-complexity there was no
significant evidence to support the hypothesis H1b and there was no association between reliability (M = 3.21, SD = .72) and techno-complexity (M = 2.35, SD = .91), r (53) = 0.7, p = .63.
5.3
Bivariate analysis of techno-stressors and
academic performance
Hypothesis H2 predicted that all techno-stressors will be inversely associated with perceived academic performance. There was significant evidence to support hypothesis H2 and conclude that there was a weak, negative association between work overload (M = 2.63, SD = 1.06) and perceived academic performance (M = 3.75, SD = .59), r (53) = -.28, p = .04. There was no significant evidence to support hypothesis H2 and there was no association between school-home conflict (M = 2.89, SD = 1.03) and perceived academic performance (M = 3.75, SD = .59), r (53) = -.09, p = .53. There was no significant evidence to support hypothesis H2 and there was a weak, negative association between role ambiguity (M = 2.50, SD = .91) and perceived academic performance (M = 3.75, SD = .59), r (53) = -.17, p = .23. There was no
significant evidence to support hypothesis H2 and there was a weak, negative association between techno-complexity (M = 2.35, SD = .91) and perceived academic performance (M = 3.75, SD = .59), r (53) = -.24, p = .08.