Lindsay R. Merte,1,a) P¨ar A. T. Olsson,1, 2 Mikhail Shipilin,3 Johan Gustafson,4 Florian Bertram,5 Chu Zhang,4 Henrik Gr¨onbeck,6
and Edvin Lundgren4
1)Materials Science and Applied Mathematics, Malm¨o University, 20506 Malm¨o,
Sweden
2)Division of Mechanics, Lund University, 22100 Lund, Sweden
3)Department of Physics, Stockholm University, AlbaNova University Center, 10691 Stockholm,
Sweden
4)Division of Synchrotron Radiation Research, Lund University, 22100 Lund,
Sweden
5)DESY Photon Science, Notkestr. 85, 22607 Hamburg, Germany
6)Department of Physics and Competence Centre for Catalysis, Chalmers University of Technology, 41296 G¨oteborg,
Sweden
(Dated: 18 February 2020)
We have investigated the structure of an ultrathin iron oxide phase grown on Ag(100) using surface X-ray diffraction in combination with Hubbard-corrected density functional theory (DFT+U) calculations. The film exhibits a novel structure composed of one close-packed layer of octahedrally-coordinated Fe2+ sandwiched between two close-packed layers of tetrahedrally-coordinated Fe3+, and an overall stoichiometry of Fe
3O4. As the structure is distinct from bulk iron oxide phases and the coupling with the silver substrate is weak, we propose that the phase should be classified as a metastable two-dimensional oxide. The chemical and physical properties are potentially interesting thanks to the predicted charge ordering between atomic layers, and analogy with bulk ferrite spinels suggests the possibility for synthesis of a whole class of two-dimensional ternary oxides with varying electronic, optical, and chemical properties.
I. INTRODUCTION
Due to their abundance, low cost, and relatively low environmental impact, iron oxides are attractive materi-als for implementation in optical, electronic and magnetic applications, which presently rely heavily upon rare, ex-pensive and/or toxic elements1,2. Although among the oldest functional materials known, the production of iron oxides with nanoscale dimensions–and consequent novel properties–creates opportunities for applications in new areas. Nanoscale iron oxides have shown promise for use in supercapacitors3 and lithium-ion batteries4, biomed-ical applications and catalysts5, and magnetic devices6, for example.
The reduction in dimension to the nanoscale gives increasing importance to iron oxide surfaces in deter-mining material properties, and recent studies have be-gun to provide a detailed atomistic picture of these surfaces7. The effects of reduced coordination environ-ment, relaxation, and accommodation of potential non-stoichiometry combine to yield surfaces whose properties may differ substantially from those encountered in the bulk. When thickness is reduced to the atomic scale, the ‘bulk’ of the material is eliminated, and the films must be considered distinct phases with their own properties8–10. Interest in 2D materials has increased recently11, and a wide variety of materials, including many metal oxides12, have been produced in ultra-thin form, usually by exfo-liation of layered bulk materials. Especially where 2D
a)lindsay.merte@mau.se
materials are formed from compounds that are not in-herently layered in the bulk (including the iron oxides, of which a 2D phase produced by exfoliation was recently reported13), it is of considerable importance to under-stand how the drastic change in bonding environments at reduced dimensions affects the structure as well as the chemical and physical properties.
Monolayer FeO films have been studied for decades14–17, and although they show a superficial resemblance to rocksalt-structured FeO(111), it has become clear that the monolayer is a distinct phase whose properties cannot be explained by reference to the bulk-terminated FeO surface. FeO monolayers on plat-inum are stabilized by relatively strong film-substrate interactions, modifying their properties substantially. The most prominent result of this stabilization is the possibility for so-called coordinatively unsaturated fer-rous (CUF) sites occurring at the edges of FeO islands, which have been shown to activate O2 in catalytic oxidation reactions18–21. The reversible intercalation of oxygen to form an FeO2 trilayer phase22,23 is a further manifestation of this. In contrast, FeO grown on silver surfaces, where film-substrate interactions are significantly weaker, shows characteristics different from Pt-supported films and from bulklike FeO(111), instead resembling those of the truly two-dimensional unsupported phase24.
Previous experiments25,26studying the growth of iron oxides on silver surfaces identified an additional ultrathin phase forming under conditions with higher O2pressures which has somewhat puzzling characteristics: although exhibiting a surface structure similar to FeO(111) and to monolayer and multilayer FeO films grown on a variety
hor’s peer reviewed, accepted manuscript. Howe
ver, the online
version of record will be different
from this
version
once it has bee
n copyedited an d typeset. PLEASE CIT E THIS ARTI C LE AS DOI: 10.1063/1.5142558
of metal substrates previously,15,26–30 core level spectro-scopies indicate instead a mixed-valence compound in-corporating both Fe2+and Fe3+. It was proposed26that a thin (111)-oriented section of rocksalt FeO, composed of 3 close-packed Fe layers and 4 close-packed O layers– giving an overall composition of Fe3O4–could explain the observations. The presence of a large proportion of Fe3+ and the (presumed) absence of a net electrostatic dipole in such a structure suggest that its electronic and chem-ical properties should differ substantially from those of bulk-terminated FeO(111), magnetite Fe3O4, or mono-layer FeO.
In this contribution, we report the results of a com-bined surface X-ray diffraction (SXRD) and density func-tional theory (DFT) study aimed at determining the structure of this phase. Our results confirm that the structure is based on close-packed Fe and O layers, and show that it is not derived from rocksalt FeO. Instead of the pure octahedral stacking seen in the rocksalt phase, the Fe3O4nanosheets are composed of one central layer of octahedral Fe and two outer layers of tetrahedral Fe.
II. METHODS A. Experiments
STM measurements were performed in ultra-high vac-uum at room temperature using an Omicron STM-1 mi-croscope at the Dept. of Physics, Lund University. XPS and NEXAFS spectra were acquired at beamline I311 at the MAX-II synchrotron, MAX IV Laboratory, Lund. For details of these experiments, see ref.26.
SXRD measurements were performed at beamline I07 at the Diamond Light Source, using an ultra-high vacuum system installed at Experimental Hutch 231. The Fe
3O4 sheets were grown, following a procedure established previously26, by deposition of iron from an electron-beam evaporator in a background pressure of 1 × 10⁻⁵ mbar O2, followed by vacuum annealing at 400◦C. The struc-ture was checked by LEED and STM prior to XRD mea-surements, which were performed in a directly-attached chamber of the UHV system. In-plane and out-of-plane XRD scans were made using a Pilatus 100K area detec-tor, and a fixed incident angle of 0.2◦. To obtain in-tensities for the diffraction rods, we performed θ scans with the detector fixed for a series of out of plane an-gles. The collected stacks of images represent a 3D map of the reciprocal space, from which 2D slices through the rods at different L values were extracted. Intensi-ties were extracted by 2D peak fitting of these slices, which allowed separation of intensity corresponding to the diffraction rod from the background32. Raw intensi-ties were converted to structure factors after application of the appropriate Lorentz and polarization corrections33. X-ray structure factors for model structures were com-puted directly in the kinematic approximation (after e.g. Vlieg34), taking account of the symmetry of the
sub-strate, which results in mirrored domains with overlap-ping diffraction rods. The slight undulation of the film caused by moir´e coincidence was neglected here, as its main influence is expected to be a somewhat increased Debye-Waller parameter. For fits based on DFT struc-tural data, only the overall intensity and Debye-Waller factor were varied.
B. Density functional theory modelling
The DFT+U modelling was conducted using the Vi-enna ab initio simulation package (VASP)35–38. To de-scribe the electron-ion interaction we adopted the pro-jector augmented wave method39,40 (PAW, electronic valence configurations: 2s22p4, 3p63d74s1, 3p63d74s2, 3p63d84s2, and 4p64d105s1for O, Fe, Co, Ni, and Ag, re-spectively) with the exchange-correlation functional ap-proximated within the Perdew, Burke, and Ernzerhof (PBE) formalism41. For calculations of adhesion ener-gies, the Grimme-D2 method42was used to include an es-timate of van der Waals interactions. To account for the magnetic properties and the strong electronic correlation of the Fe/Co/Ni d-states we utilized a collinear spin mod-elling approach in tandem with the rotationally invariant Hubbard correction approach suggested in43. The effec-tive Hubbard parameters for Fe and Co, Uef f = U − J, were chosen to be 4.2 and 4.0 eV, respectively. With these choices, the gaps between highest occupied and lowest unoccupied 3d states match the experimental bandgaps of the bulk rocksalt phases44,45. For Ni, the effective Hubbard parameter was chosen as 4.6 eV, in accordance with reported data in the literature46.
The electronic Kohn-Sham orbitals were expanded in plane waves and the reciprocal space was discretized by means of a Γ-centered k-point grid generated using the Monkhorst-Pack method47. The cutoff kinetic energy and k-point grid size were converged with respect to the the ground state energy of the stoichiometric bulk FeO rocksalt. Thus, it was represented by a hexagonal super-cell as in46 such that an anti-ferromagnetic type II spin variation along the [111]-direction could be obtained. It was found that a plane wave cutoff of 650 eV and k-point grid of 12 × 12 × 3 resulted in a total energy convergence better than 5 meV/FeO-unit.
For modelling of the free-standing and supported films the same parameters as for the rocksalt bulk phase were used except that a planar k-point mesh commen-surate with that of the hexagonal cell was utilized along with dipole correction to reduce periodic artefacts em-anating from dipole interaction across the periodic cell boundary48. To further ensure that the films were not af-fected by the periodicity, we studied how the ground state energy varied with the out-of-plane vacuum dimension. The results showed that a vacuum of 6 ˚A or larger yielded a convergence accuracy of 1 meV/Fe3O4-unit. Hence, we made sure that it was larger than 8 ˚A in our simula-tions. For the charge segregation studies we performed
hor’s peer reviewed, accepted manuscript. Howe
ver, the online
version of record will be different
from this
version
once it has bee
n copyedited an d typeset. PLEASE CIT E THIS ARTI C LE AS DOI: 10.1063/1.5142558
20 nm 1 1 2 2 2 3 3 3 3 Ag(100) 0 2 4 6 STM Apparent Height (Å) Frequency 50 nm 2 nm (a) (b) (c) 1: FeO 2: Fe2O3 3: Fe3O4 1: 2: 3: 1.3 Å 3.1 Å 4.7 Å (d)
FIG. 1. (a) Large-scale and atomic resolution STM images of multilayer FeOx grown on Ag(100) in 5 × 10⁻⁶ mbar O2.
Hexagonal and centered-rectangular unit cells are marked in the atomic-scale image and correspond to the reciprocal-space cells in Fig. 3. (b) STM image of FeOx islands on Ag(100)
after Fe deposition in 1×10⁻⁶mbar O
2followed by annealing.
(c) Height histogram from image (b), showing the apparent heights of the three types of islands imaged. these are in-terpreted as incorporating 1, 2 or 3 close-packed Fe layers and are assigned to FeO, Fe2O3 and Fe3O4, respectively. (d)
Schematic models of the three structures. Data originally re-ported in26.
Bader charge analyses49 using the open-source software BADER50.
III. RESULTS
A. Experimental characterization
As discussed previously,26 deposition of iron onto Ag(100) in a sufficiently low background pressure of O2 (2 × 10⁻⁷ mbar) followed by UHV annealing results in formation of an FeO monolayer with a hexagonal, boron nitride type structure with a mean Fe-Fe spacing of about 3 ˚A. When higher oxygen pressures are used, or when the FeO monolayer is oxidized and annealed, a new type of structure is formed which exhibits a similar in-plane periodicity, but is thicker than the monolayer. Fig. 1(a) shows islands of this new multilayer phase prepared by deposition in 5 × 10⁻⁶ mbar O2 followed by annealing at 400◦C. The phase consists of hexagonal islands with a wavy height profile due to moir´e-type coincidence of the 3.1 ˚A lattice parameter with the underlying Ag(100) substrate.
Fig. 1(b) shows an STM image of FeOx/Ag(100) pre-pared using an intermediate O2pressure (1 × 10⁻⁶mbar) where monolayer FeO coexists with islands of the new structure, and an extracted height histogram from this image is shown in Fig. 1(c). Aside from the monolayer at 1.3 ˚A, two different apparent heights are observed at 3.1
705 710 715 720
Binding energy (eV)
Intensity Fe 2p3/2 FeO Fe3O4 (c) 2+ 3+ 706 708 710 712 714 Photon energy (eV)
Intensity Fe L3 FeO Fe3O4 2+ 3+ (e) 526 528 530 532 534
Binding energy (eV)
Intensity O 1s FeO Fe3O4 (d) (a) (b)
FIG. 2. LEED patterns of (a) monolayer FeO and (b) the Fe3O4 multilayer phase as characterized by XPS/XAS. Both
indicate a ∼ 3 ˚A hexagonal lattice (large diamonds), as well as characteristic reflections due to the moir´e coindicence struc-tures. (c) Fe 2p XPS, (d) Fe-L3 NEXAFS,and (e) O 1s XPS
spectra for the two surfaces. Data originally reported in26.
and 4.7 ˚A. These are assigned to structures incorporating 2 and 3 Fe layers, respectively, as well as an additional oxygen layer, to give overall compositions of Fe2O3 and Fe3O4, as indicated schematically in Fig. 1(d). Due to embedding of islands in the silver surface, whose steps become quite mobile at the temperatures used for an-nealing, we could not determine directly the distribution of 2-layer and 3-layer islands in the preparation show in Fig. 1(a), but based on the approximate 3-fold reduction in the area fraction of the film relative to the monolayer, the 3-layer Fe3O4 structure appears predominant. As will be discussed below, SXRD measurements are con-sistent with a 3-layer structure, with likely contributions of the 2-layer structure as a minority phase. XPS and XAS measurements of the FeO monolayer and multilayer structures, prepared similarly as those characterized by STM, but subjected to post-annealing at at higher tem-perature of 600◦C, are shown in Fig. 2 together with the corresponding LEED patterns. The spectra (also dis-cussed previously26) indicate a combination of Fe2+ and Fe3+, consistent with the proposed Fe
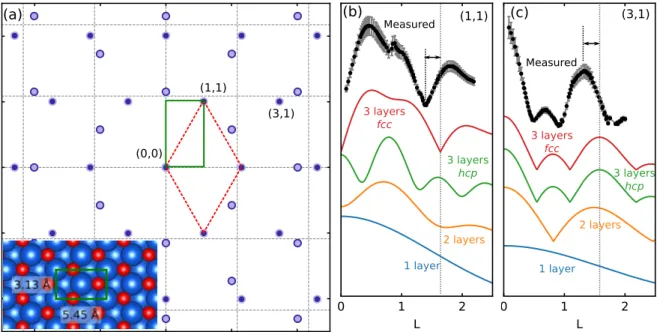
3O4 composition. To gain more insight into the structural details of the multilayer phase, we performed SXRD measurements us-ing a similar Fe3O4film grown in situ in the UHV system installed at the beamline31. A reciprocal space map of the Fe3O4/Ag(100) structure is shown in Fig. 3(a), with an inset showing the corresponding real-space unit cell. Atomic rows of Fe3O4are aligned with those of the sub-strate, breaking the hexagonal symmetry of the struc-ture, and for this reason a centered-rectangular unit cell was chosen for modelling. Measurement of the in-plane diffraction angles for the Fe3O4 rods yields unit cell di-mensions of 3.13 ˚A and 5.45 ˚A, giving a mean in-plane
hor’s peer reviewed, accepted manuscript. Howe
ver, the online
version of record will be different
from this
version
once it has bee
n copyedited an d typeset. PLEASE CIT E THIS ARTI C LE AS DOI: 10.1063/1.5142558
(1,1) (0,0) (3,1) (a) (1,1) (3,1) 1 layer 2 layers 3 layers hcp 3 layers fcc Measured 1 layer 2 layers 3 layers hcp 3 layers fcc Measured (b) (c)
FIG. 3. (a) Reciprocal space map of the hexagonal Fe3O4phase, showing the positions of diffraction rods relative to the Ag(100)
substrate (dashed lines). Alignment of atomic rows of the oxide with those of the substrate results in 4 inequivalent domains which produce two sets of non-overlapping rods. Inset shows the centered-rectangular unit cell corresponding to that in the reciprocal space map. The reciprocal-space unit cells marked here correspond to those indicated in the atomic-scale STM image in Fig. 1(a). (b,c) Measured structure factors for the (1,1) and (3,1) rods, respectively, along with calculated structure factors for simplified models consisting of close-packed sheets of Fe, with layer spacing corresponding to that in FeO(111), 2.48 ˚A. The dashed lines indicate the discrepancy between the measured positions of the primary maxima/minima from those expected for 3 layers of bulklike FeO.
Fe-Fe distance of 3.14 ˚A, consistent with STM and LEED measurements. This lattice constant is contracted rela-tive to monolayer FeO/Ag(100) (∼3.25 ˚A), but expanded by about 3% relative to bulk w¨ustite Fe1−xO (3.04 ˚A)2. The in-plane width of the rods indicates island diameters in the range of 15-20 nm.
Out-of-plane SXRD scans measured along two of the Fe3O4 diffraction rods are plotted in Fig. 3 (b,c). The essential features of the film structure can be deduced by comparison of these curves with the calculated structure factors for simple models composed of close-packed layers of Fe atoms only, plotted together in the same panels. The major features of the XRD patterns are dominated by scattering from Fe, due to its larger atomic number. The patterns of maxima and minima in the measured curves correspond well to those of the 3-layer Fe film with fcc stacking, and rule out structures with hcp stacking.
From this qualitative comparison, the measurements appear to support a rocksalt model based on w¨ustite FeO, which exhibits the same cubic stacking in the Fe sublattice seen here. However, a significant discrepancy is apparent if we consider the layer spacing implied by the diffraction patterns. The simulated structure factors in Fig. 3(b,c) were calculated assuming a layer spacing corresponding to FeO, 2.5 ˚A. The experimental curves are contracted in reciprocal space by about 15%, imply-ing a correspondimply-ing 15% expansion in the layer spacimply-ing, to about 2.9 ˚A (dashed lines and arrows in Fig. 3(b,c)). If
the octahedral stacking of the rock-salt phase were main-tained, this would imply a significant increase in Fe-O bond length, to about 2.3 ˚A average. For reference, bond lengths in bulk iron oxides (FeO, Fe3O4, α-Fe2O3) range from 1.88 ˚A (Otetin Fe3O4) to 2.16 ˚A (Ooctin FeO), with shorter bonds generally observed for the oxides contain-ing Fe3+51–53. The assumption of a rocksalt structure for the film thus implies the presence of anomalously long Fe-O bonds, with no obvious physical cause.
A more reasonable explanation for the large interlayer distance is a change in coordination geometry. A change from octahedral stacking in the dense rocksalt struc-ture to tetrahedral stacking in the more open zincblende structure, for example, would result in an increase in lin-ear dimension of 15.5%, assuming fixed bond lengths. Consistent with this, models of the Fe3O4 film with tetrahedral coordination and the lattice parameters de-termined by SXRD exhibit Fe-O bond lengths in the range of 1.9-2.1 ˚A, consistent with expectations based on other iron oxide phases. Although the zincblende and wurtzite structures are not stable bulk phases for FeO, there is some precedent for formation of tetrahedral Fe in close-packed layers. A study of relatively thick films of FeO(111)54showed that Fe cations at the surface adopt tetrahedral coordination, produced by introduction of a stacking fault. A similar stacking fault and change to tetrahedral coordination was observed for CoO(111)55. Given the very small thickness of the Fe3O4sheets
stud-hor’s peer reviewed, accepted manuscript. Howe
ver, the online
version of record will be different
from this
version
once it has bee
n copyedited an d typeset. PLEASE CIT E THIS ARTI C LE AS DOI: 10.1063/1.5142558
Rocksalt (OOO) Zincblende (TTT) TTO TOT1 (a) (c) (d) (b) 0.27 eV/Fe3O4 RS TOT (1,1) (3,1) TOT2 TOT3
FIG. 4. (a) Structures investigated by DFT+U that are based on fcc iron stacking and close-packed oxygen layers. Depending on the oxygen stacking sequence, various combinations of octahedral (O) and tetrahedral (T) metal coordination are present. The rocksalt and TOT phases were found to be significantly more stable than the others. (b) Calculated energy for various phases as functions of in-plane lattice parameter. (c,d) Structure factors calculated for the three different TOT models and for the rocksalt model, using coordinates from DFT calculations. Curves are fitted to the experimental data by varying only intensity and Debye-Waller parameter. Also plotted is the result of a fit where a minority contribution from a 2-layer Fe2O3
phase is added to that of the TOT1 phase (offset for clarity).
ied here, it appears plausible that tetrahedral iron should also be present.
B. Density functional theory calculations
To confirm that the Fe3O4 sheets incorporate Fe in tetrahedral coordination, and to resolve the details of this structure, we performed a set of density functional theory calculations for different structural models within the DFT+U framework43. The films are shown experi-mentally to exhibit a fully incommensurate interface with the silver substrate, resulting in a large (approximately 16×9) moir´e-type supercell which is too computationally demanding to treat explicitly. Therefore, as a first ap-proximation, we modeled the films as free-standing sheets in slab supercell geometry. The DFT+U approach has been used widely in computational studies of bulk iron oxides and ultrathin films in recent years56–58, and is a reasonable approximation for these systems59. Several structures were chosen for investigation which incorpo-rate 3 close-packed layers of iron in fcc stacking and 4
layers of oxygen, placed in different arrangements to yield phases with different combinations of octahedral (‘O’) and tetrahedral (‘T’) coordination. The most relevant phases are shown in Fig. 4(a). These include the purely octahedral and tetrahedral phases based on rocksalt and zincblende lattices, as well as two hybrid structures incor-porating two tetrahedral layers and one octahedral layer. The stabilities of the most relevant phases, according to DFT+U calculations, are shown in Fig. 4(b), where total energy has been computed as a function of the in-plane lattice parameter. The zincblende structure, in which all Fe atoms are tetrahedrally coordinated (re-sulting in a polar configuration with dangling, singly-coordinated O atoms), is found to be much higher in energy (+2.43 eV/Fe3O4) and is therefore omitted from the plot, as is the TTO phase, which was unstable and converged to a TOO geometry (with a hcp-stacked Fe lattice). The only structures found to be plausible candi-dates were the rocksalt phase and the TOT phase, which is a symmetrical structure incorporating an octahedral layer of Fe at the center and tetrahedral layers at the surfaces. The TOT configuration is found to be the most
hor’s peer reviewed, accepted manuscript. Howe
ver, the online
version of record will be different
from this
version
once it has bee
n copyedited an d typeset. PLEASE CIT E THIS ARTI C LE AS DOI: 10.1063/1.5142558
Side view
Top view
Fe2+
Fe3+
Fe3+
FIG. 5. Ball models of the TOT1 phase found to best repro-duce the diffraction rod data. DFT+U calculations indicate the central octahedral layer consists of Fe2+ while the outer tetrahedral layers are Fe3+. The computational surface cell is
indicated by a blue rectangle.
stable overall, about 0.27 eV/Fe3O4lower than the rock-salt phase. The calculated interlayer distance for the relaxed structure is 2.91 ˚A, which is in good agreement with the dimensions deduced from SXRD. The calculated in-plane lattice parameter for the TOT phase is larger than what is observed experimentally by about 2%. We attribute this discrepancy to the tendency of the PBE functional to overestimate lattice constants by 1-3%.60 The Fe-O bond lengths are between 1.89 and 1.91 ˚A for Fetet and between 2.10 and 2.18 ˚A for Feoct, which is consistent with reference data. The calculation predicts a slight breaking of octahedral symmetry at these sites, such that two Fe-O bonds are elongated with respect to the other four, resulting in approximate D4h symmetry locally. It is not clear whether this is a real effect or an ar-tifact of the unit cell and spin configuration. Depending on the exact placement of the outermost oxygen layers with respect to the inner Fe and O layers, which can resemble coordination in either wurtzite or zincblende, three different TOT structures are possible, but these are found to be very similar in energy. We denote as TOT2 the structure with zincblende-like stacking, TOT3 the structure with wurtzite-like stacking, and TOT1 the structure incorporating both. Models of the 3 structures are shown in Fig. 4(a), with the difference in oxygen layer placement highlighted.
In Fig. 4(c,d), we plot the experimental X-ray rod pro-files with simulated curves for the TOT and rocksalt phases, with structures determined from DFT+U. The simulation for the TOT1 phase is found to be in essen-tially perfect agreement with experiment. The TOT2 and TOT3 phases are slightly worse, with residuals ex-ceeding the 10% of intensity assumed to be the uncer-tainty in the measurement. For the rocksalt structure,
the agreement with experiment is very poor, both in terms of the positions of the minima/maxima, linked to the interlayer spacing, as well as the shape of the (1,1) rod for L< 1.5, the details of which are related to the po-sitions of the oxygen layers. The very good agreement of the calculation for the TOT phases with experiment, as well as their predicted stability, lead us to conclude that this structure is present in the experiments. The largest discrepancy between the measured and fitted rod pro-files is found near the minima of the (3,1) rod at L=0.5 and L=0.9. We attribute this to the presence of the 2-layer Fe2O3 phase discussed above. As seen in Fig. 3(c), a 2-layer structure exhibits a minimum in this rod be-tween those of the corresponding 3-layer phase, so that the magnitude of the oscillation in apparent structure factor is reduced in this range. This was verified by fit-ting the experimental data with the summed contribu-tions of the TOT1 DFT structure and a Fe2O3 struc-ture, with the relative contribution and the Fe-Fe inter-layer spacing of the secondary phase as variable param-eters. The result of this fit, which used a mixed octahe-dral/tetrahedral coordination similar to the TOT phase, is plotted in Fig. 4(c,d). The fit indicates a proportion of the 2-layer phase of about 20%, and an interlayer spacing of 2.75 ± 0.1 ˚A. Due to the relatively small contribution of this phase to the overall diffraction signal, however, we do not believe we can draw clear conclusions about its structure.
Among the three TOT phases, TOT1 clearly shows the best agreement with experiment, but due to the similar-ity in energy and the fairly-close reproduction of exper-imental diffraction intensities by the TOT2 and TOT3 structures, we cannot exclude these with confidence. We note further that a combination of these phases might be formed, given the similarity in energy. In any case, calculations indicate that the effect of the difference in stacking, which does not affect local coordination en-vironments, on properties is small. Ball models of the TOT1 Fe3O4 that best fits the experimental data are shown in Fig. 5.
Fe3O4 is formally a mixed-valence compound with a composition of Fe2+Fe3+
2 O2−4 . In bulk form, it crys-tallizes in the inverse spinel structure, with Fe3+ ions occupying tetrahedral sites and Fe2+ and Fe3+ ions oc-cupying equivalent octahedral sites. Charge dispropor-tionation and ordering are observed at low temperature and are responsible in part for the compound’s complex and distinctive electronic and magnetic properties7. In the case of the Fe3O4 nanosheet considered here, the DFT+U calculations predict clear charge segregation be-tween sites with different coordination. The Fetet ex-hibit more positive Bader charge (+1.66 e− relative to an isolated, neutral Fe atom) and larger magnetic mo-ment (4.06 µB) than the Feoct (+1.41 e− and 3.66 µB), consistent with assignment to high-spin Fe3+ and Fe2+ states, respectively, whose charge and magnetic moments have been estimated from calculations of FeO (+1.35 e−, 3.64-3.69 µB) and Fe2O3 (+1.82 e−, 4.22 µB).
Antifer-hor’s peer reviewed, accepted manuscript. Howe
ver, the online
version of record will be different
from this
version
once it has bee
n copyedited an d typeset. PLEASE CIT E THIS ARTI C LE AS DOI: 10.1063/1.5142558
romagnetic ordering, with equal numbers up and down atoms in each layer, was found to be most stable among those tested in our unit cell. Details of the investiga-tion of charge and spin distribuinvestiga-tions will be described separately61.
Figure 6 shows the total and projected densities of states calculated for the TOT1 Fe3O4 sheet with anti-ferromagnetic spin ordering. The DFT+U calculations predict a small, indirect band gap of 0.3 eV separating filled 3d states on the central Fe2+oct sites from empty 3d states at the outer Fe3+tet sites. The smallest electronic excitations are thus predicted, at this level of theory, to involve charge transfer from the central octahedral layer to the outer tetrahedral layers.
We also performed a set of calculations of Ag-supported Fe3O4 sheets, to test the effect of the oxide-substrate interaction and verify that the unsupported model is a good approximation. Adhesion energies, in-cluding van der Waals contributions, were computed us-ing an Ag(100) slab with an expanded lattice parameter matching that of the Fe3O4sheet. As mentioned above, and discussed in ref.26, the real interface exhibits an inco-herent moir´e structure, with regions where O atom rows are in phase with those of Ag, so that half are in on-top positions, and regions where the O atom rows are out of phase with Ag and where half reside above 4-fold hollow sites. In the rest of the structure, atoms reside above bridge and intermediate sites. Depending on the inter-face geometry, we find adhesion energies ranging from 0.2 eV to 0.4 eV per interface Fe/O atom (0.4-0.8 J/m2), with the strongest bonding found where O atoms are located directly atop Ag. The adhesion energy for the real system should be intermediate between these values, as the incommensurate interface exhibits a combination of these bonding geometries. The value is significantly smaller than that calculated for iron oxide monolayers on Pt (Eadh>1 eV), and is even smaller than for FeO mono-layers on Ag(100) (∼ 0.5 eV, neglecting van der Waals corrections)24. The calculations also show that the influ-ence of the interface on the sheet’s electronic structure is minor, and Bader analysis indicates a charge transfer of only 0.1 e− per interface O atom.
IV. DISCUSSION
Though showing similarity with bulk magnetite, in that a mix of tetrahedral and octahedral coordination states is observed in both cases, the structure of the ultra-thin Fe3O4phase is clearly unique. The obvious question raised by these results is whether the Fe3O4 sheets can be synthesized in unsupported form and whether their properties will be similar to the supported phase studied here–reasonable criteria for designation as a 2D mate-rial, as opposed to a surface oxide. Previous experiments involving FeO monolayers on Ag(100) showed that such films already interact weakly with the surface, exhibiting properties similar to those predicted for an unsupported
CoFe2O4
Fe3O4
NiFe2O4
VBM
FIG. 6. Calculated total and projected densities of states for the TOT1 Fe3O4structure, as well as analogous CoFe2O4and
NiFe2O4 formed by substitution of the central octahedral Fe
layer with Co and Ni. Dashed lines mark the positions of the valence band maxima. Energies are referenced to the vacuum potential.
monolayer. For such monolayers, interaction with the substrate is dominated by Ag-Fe bonds, causing the O layer to buckle outward slightly. The Fe3O4 sheets, on the other hand, expose an oxygen layer to the substrate, and exhibit a fully-incommensurate, large-period moir´e coincidence structure. The calculated adhesion energy is also comparable in magnitude to what has been reported for e.g. graphene on copper.62Based both on experiment and on the DFT+U calculations, we conclude that the Fe3O4 phase interacts even more weakly with the silver surface than the monolayer, and that the phase forms as a result of the inherent (meta-)stability of the con-figuration, and not due to specific interaction with the silver surface. We therefore expect it to be stable in free-standing form as well, and, aside from mechanical sepa-ration from the metal surface, could perhaps be produced by reduction of Fe2O3 nanosheets13.
Although we cannot make strong claims regarding the nanosheets’ properties at this point, these could poten-tially be interesting and deserve further investigation. The distinct atomic layers in the structure inherently direct charge separation, and it is expected that other metals substituted for iron as dopants should strongly favor either the central or surface layers. Noting again that the bandgap calculated for the film separates occu-pied states at the Fe2+ layer from empty states at the Fe3+ layer, one can hypothesize that substitution of the octahedral Fe atoms with Co or Ni, which exhibit higher 3rdionization energies and form more stable divalent ox-ides, would result in widening of the band gap. Indeed,
hor’s peer reviewed, accepted manuscript. Howe
ver, the online
version of record will be different
from this
version
once it has bee
n copyedited an d typeset. PLEASE CIT E THIS ARTI C LE AS DOI: 10.1063/1.5142558
DFT+U calculations predict this to be the case; densities of states for CoFe2O4, and NiFe2O4are plotted in Fig. 6. The computed bandgap is increased to 1.0 and 1.5 eV for the cobalt- and nickel-substituted sheets, respectively, as the occupied 3d states shift downward. With bandgaps in the visible range and a high surface area, these have potential for photochemical activity, for example. We speculate that it should be possible to prepare a wide va-riety of 2D ternary oxide phases of this type, with diverse properties that could be useful in different applications.
It is noteworthy in this context that layered double hy-droxides (LDH) of iron, and especially mixtures of iron and nickel, are highly active electrocatalysts for the oxy-gen evolution reaction63. These LDH phases consist of single close-packed layers of metal ions in octahedral co-ordination to OH, and their high performance is gener-ally linked to the inherently high surface areas provided by the 2D structure and to the favorable bonding of re-action intermediates at the metal surface sites.64 Cai et al.65showed that NiFe LDH, ordinarily consisting of Fe3+ and Ni2+sites, exhibit enhanced performance when syn-thesized with a significant portion of Fe2+ as well. It would be interesting, therefore, to investigate the electro-catalytic properties of the 2D Fe3O4and bi/multimetallic islands, which should expose ions of different valence and coordination state at their edges.
The tetrahedral-octahedral-tetrahedral structure of the Fe3O4 nanosheets also suggests parallels with clays and related phyllosilicates (e.g. talc, mica), many of which exhibit a similar structure where tetrahedral sil-ica sheets are bound together by an octahedral layer of metal ions. Variants with high concentrations of iron, both in the 2+ and 3+ states and occupying both octahe-dral and (to a lesser extent) tetraheoctahe-dral sites, are known, and their performance as catalysts has been recognized.66 Redox reactions involving iron in these minerals are par-ticularly important for environmental chemistry67 and interestingly, it was shown recently68 that the combina-tion of Fe2+ and Fe3+ at the edges of 2D sheets in iron-rich clays strongly promotes their activity in oxidation reactions.
Although our investigation of the magnetic proper-ties of the sheets was limited, the preference for anti-ferromagnetic ordering was clear, as mentioned above. These properties also deserve further investigation, with views towards both fundamental aspects of antiferromag-netism in 2D materials69and towards potential spintron-ics applications70,71.
The formation of the 2-layer Fe2O3 phase, not recog-nized in previous studies of this system, is another issue that should be addressed. It is not clear at this point whether the phase can be prepared specifically, directed by e.g. controlling the oxygen pressure, or whether it is merely an intermediate formed in the process of con-version of the FeO bilayer to Fe3O4. Although, as dis-cussed above, we cannot extract much information about this structure from the SXRD data, preliminary indica-tions suggest that a similar mixed octahedral/tetrahedral
structure is formed. We note that the two-phase fits to the diffraction rods were notably worse when a rocksalt type stacking was assumed, and that the in-plane lattice parameters of the two structures are indistinguishable in our LEED and SXRD data, suggesting similar bonding configurations.
V. CONCLUSION
The structure of an ultrathin Fe3O4 phase grown on Ag(100) has been investigated by SXRD and DFT+U calculations. The structure is distinct from bulk iron oxide phases and from surface oxides whose properties are defined or strongly influenced by bonding to a metal substrate. Instead, it appears to be a unique 2D material whose properties are intrinsic to its structure. Further investigations to elucidate these properties and to isolate the material in unsupported form are underway.
VI. ACKNOWLEDGEMENTS
We are grateful to Matthew Forster, Jonathan Rawle and Chris Nicklin for assistance with the SXRD ex-periments. This work was performed within the VR funded R¨ontgen-˚Angstr¨om collaboration “Catalysis on the atomic scale” project number 349-2011-6491 and the Knut and Alice Wallenberg (KAW) funded project “Atomistic design of new catalysts” project number KAW 2015.0058. Additional funding was provided by the Swedish Research Council through grants 2016-04162 (Olsson) and 2018-05374 (Merte), as well as the Crafoord Foundation and the Swedish Foundation for Strategic Re-search. We acknowledge Diamond Light Source for time on Beamline I07 under Proposal SI10342. DFT+U sim-ulations were performed using computational resources provided by the Swedish National Infrastructure for Computing (SNIC) at the National Supercomputer Cen-tre (NSC), Link¨oping University and at the High Perfor-mance Computing Center North (HPC2N), Ume˚a Uni-versity.
1P. Tartaj, M. P. Morales, T. Gonzalez-Carre˜no, S.
Veintemillas-Verdaguer, and C. J. Serna, Adv. Mater. 23, 5243 (2011).
2R. Cornell and U. Schwertmann,
The Iron Oxides: Structure, Properties, Reactions, Occurences and Uses, 2nd ed. (Wiley-VCH Verlag GmbH & Co. KGaA, 2003).
3Q. Qu, S. Yang, and X. Feng, Adv. Mater. 23, 5574 (2011).
4L. Zhang, H. B. Wu, and X. W. D. Lou, Adv. Energy Mater. 4,
1300958 (2014).
5W. Wu, Q. He, and C. Jiang, Nanoscale Res. Lett. 3, 397 (2008).
6J. Yuan, A. Balk, H. Guo, Q. Fang, S. Patel, X. Zhao, T. Terlier,
D. Natelson, S. Crooker, and J. Lou, Nano Lett. 19, 3777 (2019).
7G. S. Parkinson, Surf. Sci. Rep. 71, 272 (2016).
8H.-J. Freund and G. Pacchioni, Chem. Soc. Rev. 37, 2224 (2008).
9S. Surnev, A. Fortunelli, and F. P. Netzer, Chem. Rev. 113,
4314 (2013).
10G. Barcaro and A. Fortunelli, Phys. Chem. Chem. Phys. 21,
11510 (2019).
hor’s peer reviewed, accepted manuscript. Howe
ver, the online
version of record will be different
from this
version
once it has bee
n copyedited an d typeset. PLEASE CIT E THIS ARTI C LE AS DOI: 10.1063/1.5142558
11C. Tan, X. Cao, X.-J. Wu, Q. He, J. Yang, X. Zhang, J. Chen, W. Zhao, S. Han, G.-H. Nam, M. Sindoro, and H. Zhang, Chem. Rev. 117, 6225 (2017), pMID: 28306244.
12N. Mahmood, I. A. D. Castro, K. Pramoda, K. Khoshmanesh,
S. K. Bhargava, and K. Kalantar-Zadeh, Energy Storage Mater.
16, 455 (2019).
13A. P. Balan, S. Radhakrishnan, C. F. Woellner, S. K. Sinha,
L. Deng, C. de los Reyes, B. M. Rao, M. Paulose, R. Neupane, A. Apte, V. Kochat, R. Vajtai, A. R. Harutyunyan, C.-W. Chu, G. Costin, D. S. Galvao, A. A. Mart´ı, P. A. van Aken, O. K. Varghese, C. S. Tiwary, A. Malie Madom Ramaswamy Iyer, and P. M. Ajayan, Nat. Nanotechnol. 13, 602 (2018).
14G. H. Vurens, M. Salmeron, and G. A. Somorjai, Surf. Sci. 201,
129 (1988).
15M. Ritter, W. Ranke, and W. Weiss, Phys. Rev. B 57, 7240
(1998).
16E. D. L. Rienks, N. Nilius, L. Giordano, J. Goniakowski, G.
Pac-chioni, M. P. Felicissimo, T. Risse, H.-P. Rust, and H.-J. Freund, Phys. Rev. B 75, 205443 (2007).
17Y. Li, K. C. Adamsen, L. Lammich, J. V. Lauritsen, and
S. Wendt, ACS Nano 13, 11632 (2019).
18Q. Fu, W.-X. Li, Y. Yao, H. Liu, H.-Y. Su, D. Ma, X.-K. Gu,
L. Chen, Z. Wang, H. Zhang, B. Wang, and X. Bao, Science
328, 1141 (2010).
19Q. Fu, F. Yang, and X. Bao, Acc. Chem. Res. 46, 1692 (2013).
20W. Kudernatsch, G. Peng, H. Zeuthen, Y. Bai, L. R. Merte,
L. Lammich, F. Besenbacher, M. Mavrikakis, and S. Wendt,
ACS Nano 9, 7804 (2015).
21Z. Chen, Y. Mao, J. Chen, H. Wang, Y. Li, and P. Hu, ACS
Catal. 7, 4281 (2017).
22Y.-N. Sun, L. Giordano, J. Goniakowski, M. Lewandowski,
Z.-H. Qin, C. Noguera, S. Shaikhutdinov, G. Pacchioni, and Z.-H.-J. Freund, Angew. Chem. Int. Ed. 49, 4418 (2010).
23L. R. Merte, Y. Bai, H. Zeuthen, G. Peng, L. Lammich, F.
Be-senbacher, M. Mavrikakis, and S. Wendt, Surf. Sci. 652, 261 (2016).
24L. R. Merte, C. J. Heard, F. Zhang, J. Choi, M. Shipilin,
J. Gustafson, J. F. Weaver, H. Gr¨onbeck, and E. Lundgren,
Angew. Chem. Int. Ed. 55, 9267 (2016).
25D. Bruns, I. Kiesel, S. Jentsch, S. Lindemann, C. Otte,
T. Schemme, T. Kuschel, and J. Wollschl¨ager, J. Phys.:
Con-dens. Matter 26, 315001 (2014).
26L. R. Merte, M. Shipilin, S. Ataran, S. Blomberg, C. Zhang,
A. Mikkelsen, J. Gustafson, and E. Lundgren, J. Phys. Chem. C 119, 2572 (2015).
27H. C. Galloway, J. J. Benitez, and M. Salmeron, Surf. Sci. 298,
127 (1993).
28H. Zeuthen, W. Kudernatsch, G. Peng, L. R. Merte, L. K. Ono,
L. Lammich, Y. Bai, L. C. Grabow, M. Mavrikakis, S. Wendt, and F. Besenbacher, J. Phys. Chem. C 117, 15155 (2013).
29G. Ketteler and W. Ranke, J. Phys. Chem. B 107, 4320 (2003).
30N. A. Khan and C. Matranga, Surf. Sci. 602, 932 (2008).
31C. Nicklin, T. Arnold, J. Rawle, and A. Warne, J. Synchrotron
Rad. 23, 1245 (2016).
32J. Drnec, T. Zhou, S. Pintea, W. Onderwaater, E. Vlieg, G.
Re-naud, and R. Felici, J. Appl. Crystallogr. 47, 365 (2014).
33E. Vlieg, J. Appl. Crystallogr. 30, 532 (1997).
34E. Vlieg, J. Appl. Crystallogr. 33, 401 (2000).
35G. Kresse and J. Hafner, Phys. Rev. B 47, 558 (1993).
36G. Kresse and J. Hafner, Phys. Rev. B 49, 14251 (1994).
37G. Kresse and J. Furthm¨uller, Comput. Mater. Sci. 6, 15 (1996).
38G. Kresse and J. Furthm¨uller, Phys. Rev. B 54, 11169 (1996).
39P. E. Bl¨ochl, Phys. Rev. B 50, 17953 (1994).
40G. Kresse and D. Joubert, Phys. Rev. B 59, 1758 (1999).
41J. P. Perdew, K. Burke, and M. Ernzerhof, Phys. Rev. Lett. 77,
3865 (1996).
42S. Grimme, J. Comput. Chem. 27, 1787 (2006).
43S. L. Dudarev, G. A. Botton, S. Y. Savrasov, C. J. Humphreys,
and A. P. Sutton, Phys. Rev. B 57, 1505 (1998).
44H. Bowen, D. Adler, and B. Auker, J. Solid State Chem. 12,
355 (1975).
45J. van Elp, J. L. Wieland, H. Eskes, P. Kuiper, G. A. Sawatzky,
F. M. F. de Groot, and T. S. Turner, Phys. Rev. B 44, 6090 (1991).
46M. Cococcioni and S. de Gironcoli, Phys. Rev. B 71, 035105
(2005).
47H. J. Monkhorst and J. D. Pack, Phys. Rev. B 13, 5188 (1976).
48J. Neugebauer and M. Scheffler, Phys. Rev. B 46, 16067 (1992).
49R. Bader, Atoms in Molecules: A Quantum Theory,
Interna-tional Ser. of Monogr. on Chem (Clarendon Press, 1994).
50W. Tang, E. Sanville, and G. Henkelman, J. Phys.: Cond. Matter
21, 084204 (2009).
51C. Haavik, S. Stølen, H. Fjellv˚ag, M. Hanfland, and
D. H¨ausermann, Am. Mineral. 85, 514 (2000).
52E. N. Maslen, V. A. Streltsov, N. R. Streltsova, and N. Ishizawa,
Acta Cryst B 50, 435 (1994).
53H. Fjellv˚ag, F. Grønvold, S. Stølen, and B. Hauback, J. Solid
State Chem. 124, 52 (1996).
54L. Mart´ın-Garc´ıa, I. Bernal-Villamil, M. Oujja, E. Carrasco,
R. Gargallo-Caballero, M. Castillejo, J. F. Marco, S. Gallego, and J. de la Figuera, J. Mater. Chem. C 4, 1850 (2016).
55K. Heinz and L. Hammer, J. Phys.: Condens. Matter 25, 173001
(2013).
56L. Giordano, G. Pacchioni, J. Goniakowski, N. Nilius, E. D. L.
Rienks, and H.-J. Freund, Phys. Rev. B 76, 75416 (2007).
57L. R. Merte, L. C. Grabow, G. Peng, J. Knudsen, H. Zeuthen,
W. Kudernatsch, S. Porsgaard, E. Lægsgaard, M. Mavrikakis, and F. Besenbacher, J. Phys. Chem. C 115, 2089 (2011).
58Y. Ning, M. Wei, L. Yu, F. Yang, R. Chang, Z. Liu, Q. Fu, and
X. Bao, J. Phys. Chem. C 119, 27556 (2015).
59S. Prada, L. Giordano, G. Pacchioni, C. Noguera, and J.
Goni-akowski, J. Chem. Phys. 141, 144702 (2014).
60P. Haas, F. Tran, and P. Blaha, Phys. Rev. B 79, 085104 (2009).
61P. A. T. Olsson, L. R. Merte, and H. Gr¨onbeck, Submitted.
62T. Yoon, W. C. Shin, T. Y. Kim, J. H. Mun, T.-S. Kim, and
B. J. Cho, Nano Lett. 12, 1448 (2012).
63M. Gong, Y. Li, H. Wang, Y. Liang, J. Z. Wu, J. Zhou, J. Wang,
T. Regier, F. Wei, and H. Dai, J. Am. Chem. Soc. 135, 8452 (2013).
64M. Gong and H. Dai, Nano Res. 8, 23 (2015).
65Z. Cai, D. Zhou, M. Wang, S.-M. Bak, Y. Wu, Z. Wu, Y. Tian,
X. Xiong, Y. Li, W. Liu, S. Siahrostami, Y. Kuang, X.-Q. Yang, H. Duan, Z. Feng, H. Wang, and X. Sun, Angew. Chem. 130, 9536 (2018).
66E. Garrido-Ram´ırez, B. Theng, and M. Mora, Appl. Clay Sci.
47, 182 (2010).
67T. B. Hofstetter, R. P. Schwarzenbach, and S. B. Haderlein,
Environ. Sci. Technol 37, 519 (2003).
68A. G. Ilgen, R. K. Kukkadapu, K. Leung, and R. E. Washington,
Environ. Sci.: Nano 6, 1704 (2019).
69M. Gibertini, M. Koperski, A. F. Morpurgo, and K. S. Novoselov,
Nat. Nanotechnol. 14, 408 (2019).
70R. Lebrun, A. Ross, S. A. Bender, A. Qaiumzadeh, L. Baldrati,
J. Cramer, A. Brataas, R. A. Duine, and M. Kl¨aui, Nature 561,
222 (2018).
71T. Jungwirth, J. Sinova, A. Manchon, X. Marti, J. Wunderlich,
and C. Felser, Nat. Phys. 14, 200 (2018).
hor’s peer reviewed, accepted manuscript. Howe
ver, the online
version of record will be different
from this
version
once it has bee
n copyedited an d typeset. PLEASE CIT E THIS ARTI C LE AS DOI: 10.1063/1.5142558