Product-Focused Software Process Improvement. This paper has been
peer-reviewed but does not include the final publisher proof-corrections or
journal pagination.
Citation for the published paper:
Mattos Issa, David; Fabijan, Aleksander; Dimitriev, Pavel; Bosch, Jan;
Olsson Holmström, Helena. (2018). An Activity and Metric Model for Online
Controlled Experiments. PROFES 2018 : Product-Focused Software Process
Improvement, p. null
URL: https://doi.org/10.1007/978-3-030-03673-7_14
Publisher: Springer
This document has been downloaded from MUEP (https://muep.mah.se) /
DIVA (https://mau.diva-portal.org).
An Activity and Metric Model for
Online Controlled Experiments
David Issa Mattos1[0000-0002-2501-9926], Pavel Dmitriev2, Aleksander Fabijan3, Jan
Bosch1[0000-0003-2854-722X] and Helena Holmström Olsson3 [0000-0002-7700-1816] 1 Department of Computer Science and Engineering,
Chalmers University of Technology, Hörselgången 11, 412 96 Göteborg, Sweden {davidis, jan.bosch}@chalmers.se
2 Outreach
1441 North 34th Street, WA 98103, Seattle, USA pavel.dmitriev@outreach.com
3 Department of Computer Science and Media Technology,
Malmö University, Nordenskiöldsgatan, 211 19 Malmö, Sweden {aleksander.fabijan, helena.holmstrom.olsson}@mau.se
Abstract. Accurate prioritization of efforts in product and services develop-ment is critical to the success of every company. Online controlled experidevelop-ments, also known as A/B tests, enable software companies to establish causal rela-tionships between changes in their systems and the movements in the metrics. By experimenting, product development can be directed towards identifying and delivering value. Previous research stresses the need for data-driven devel-opment and experimentation. However, the level of granularity in which exist-ing models explain the experimentation process is neither sufficient, in terms of details, nor scalable, in terms of how to increase number and run different types of experiments, in an online setting. Based on a case study of multiple products running online controlled experiments at Microsoft, we provide an experimen-tation framework composed of two detailed experimenexperimen-tation models focused on two main aspects; the experimentation activities and the experimentation met-rics. This work intends to provide guidelines to companies and practitioners on how to set and organize experimentation activities for running trustworthy online controlled experiments.
Keywords: data-driven development, A/B tests, online controlled experiments.
1
Introduction
Prioritizing the development of software features and services that deliver value to customers is critical for the success of every company. One way to accurately discov-er what customdiscov-ers value is to evaluate the assumptions of the comapny by means of experiments. These experiments, commonly called A/B tests, provide a framework for companies to establish causal relationships between modifications on their systems and changes in metrics. Running experiments allows companies to continuously
up-date their assumptions on their user behavior and preferences, along with many other benefits [1].
Several publications and reports from companies such as Microsoft, Facebook, Google, and LinkedIn, among many others [2]–[5], report the competitive advantage that online controlled experiments, such as A/B testing, deliver [1]. Data-driven or-ganizations make use of relevant collected data to drive decisions and directions for the organization, and experiments are one of the key techniques used by these organi-zations. However, the support and evolution of experimentation practices is far from simple, and several pitfalls can invalidate experiments and lead to incorrect conclu-sions [6].
Different models proposed in the literature [7]–[9] provide a general structure for data-driven development and experiment processes. Although these models can be used as a starting point for companies to move to an iterative experiment-driven de-velopment process, previous research [6], [10]–[15] also describes pitfalls, techniques to provide scaling of the experimentation process and techniques to ensure trustwor-thiness in the experimentation process that are not captured in or represented by the higher level of abstraction provided in these models. Because these models do not capture this level of detail, instantiating these models directly from a higher level of abstraction can lead to the limitations in the scalability and trustworthiness of the experimentation’s activities already identified by previous research. Additionally, it can lead to multiple experimentation initiatives inside an organization and lack of rigor in the process, resulting in non-comparable tests and untrustworthy results.
To address this gap, this research provides a framework that captures specific ex-perimentation details and necessary steps for running trustworthy online controlled experiments. The framework divides the experimentation process into two main inter-connected models: the set of activities that organizations should support to run trust-worthy experiments, and the role of metrics and how they align experiments with long-term business goals. The proposed framework is based on an inductive case study in collaboration with the Analysis and Experimentation team at Microsoft.
The contribution of this paper is twofold. First, we present the new findings from the case study. These findings represent important characteristics of the experimenta-tion process that were not captured in previous models and reinforces the need of a new experimentation process model. Second, we present a framework composed of two models for an experimentation process that covers the two main aspects: (1) the experimentation activities and (2) the experimentation metrics. The framework pro-vides a detailed process which aims to help companies scale their experimentation organization with a trustworthy experimentation process.
The rest of the paper is organized as follows. Section 2 provides a background in controlled experiments and related work. Section 3 describes the research process of this case study. Section 4 presents new findings from the case study that reinforce the need for a new experimentation process model. Section 5 presents the two main as-pects of the developed experimentation process framework. Section 6 concludes this paper.
2
Background and Related Work
Although there are many different techniques for learning about customer preferences and using them to evaluate ideas (e.g. interviews, focus groups, observational studies, prototypes and mock-ups) [16], online controlled experimentation is gaining signifi-cant momentum in software companies [17]. Controlled experiments are a group of techniques where users are randomly assigned to two or more variants of a product: the control (e.g. the current system) and the treatments (the system with change X). The change could be the addition of a new feature or the modification of existing functionality. The system is instrumented and key metrics of the user’s behavior are computed. After a pre-determined period of time, the metrics are analyzed. If the only consistent difference between the experiment variants is the change X and external factors are spread out evenly between the two variants, the differences in the metrics are due to the change X. Based on this statistical analysis, companies can make data-driven decisions. Kohavi et al. [15] provide a detailed guide on running controlled experiments on the web.
Gupta et al. [18] describe the software architecture of the Microsoft ExP Platform, the design decisions made while designing the platform, and its main components. This platform and its components capture essential steps and activities that enable trustworthy experiments on a large scale. Kevic et al. [19] analyzed the results of over 20,000 experiments at Bing, providing an empirical characterization of the experi-mentation process in a product-running experiment at scale. This characterization shows that the average experimentation process takes forty-two days and includes multiple iterations to minimize the likelihood of hurting users or the business due to issues with the change that is being tested.
However, not all companies and products have the capacity to run experiments at the same scale as Microsoft Bing. Experimentation in software companies typically evolves from a few independent experiments towards a mature stage where several teams run many trustworthy experiments at the same time. Fabijan et al. [20] provide guidance on how to evolve into a data-driven company, exploring the technical, or-ganizational and business evolution. The evolution of experiments in products is di-vided into four levels of maturity (crawl, walk, run, fly) across three dimensions (the technical, organizational and business). Additionally, the study presents steps and experimentation activities which are commonly used during the evolution of experi-mentation. One of the key challenges in controlled experiments is how to decide which metrics should be used in the Overall Evaluation Criteria (OEC). The OEC is the experiment objective, which should ideally capture the long-term interests of the company. Determining a good OEC is hard as it captures abstract concepts that are difficult to validate and compare with other metrics [21]. If the OEC metric captures long-term goals or represent value, true movements of the metric represent the aggre-gated value that a variant is bringing to the system.
Deng and Shi [22] provide an extensive discussion on metrics for online experi-ments, classifying the types of metrics, the qualities and characteristics of good met-rics, and how to evaluate and select metrics. Dmitriev and Wu [21] discuss a metric evaluation framework at Bing using an offline historical experiment dataset called
experiment corpus. The experiment corpus helps to evaluate new metric sensitivity and alignment with user value. This framework helps to select suitable OEC metrics for experiments.
Previous research has provided different models and frameworks that capture and provide guidance on how to develop experiment-driven software. The QCD model (Quantitative/qualitative Customer-driven Development) [9] is an inductive model based on a generalization of approaches used by companies to guide their collection of customer feedback throughout the development process. Experimentation explores the notion of continuous validation of customer value, in contrast to the traditional up-front specification of requirements. The QCD explores this notion by treating re-quirements as hypotheses that need customer validation at the beginning of the devel-opment process. New hypotheses are based on business strategies, customer feedback, innovation strategies and previous hypothesis cycles. Qualitative feedback (surveys, interviews, focus groups and mock-ups), together with quantitative data (feature us-age, customer behavior and support data), allows the evaluation of hypotheses. Hy-potheses that are not confirmed through any of the selected customer feedback tech-niques are abandoned while validated hypotheses can be refined into a more detailed hypothesis or can be implemented and deployed. This model provides a general framework for evaluating hypotheses with customer feedback. This model can incor-porate online experiments at a higher level of abstraction. However, it does not pro-vide detailed clear steps and activities for instantiating an online experiment in soft-ware systems.
Olsson and Bosch [8] present the HYPEX (Hypothesis Experiment Data-Driven Development) model as an alternative development process for companies to com-press the customer feedback loop. This model advocates for an iterative and incre-mental development approach, rather than spending engineering effort on larger quan-tities of functionalities without customer validation. The HYPEX model is composed of six steps: (1) the generation of a feature backlog from customer needs or business goals. (2) Feature selection and specification (what is the intended behavior, what is the gap it addresses, and multiple implementation alternatives). (3) The implementa-tion and instrumentaimplementa-tion of a minimum viable feature (MVF). (4) Analyzing whether the measured behavior of the MVF addresses the gap or not. (5) Generation of hy-potheses that explain the feature behavior and why the gap was/wasn’t addressed. If the gap was addressed new features are selected as in the second step. (6) If the gap was not addressed, alternative implementations can be made (step 3) or a decision to abandon the feature can be made. The HYPEX model is a general model for data-driven development and running product experiments, but it does not provide specific steps for running online controlled experiments.
Fagerholm et al. [7] present the RIGHT (Rapid Iterative value creation Gained through High-frequency Testing) model for continuous experimentation. The goal of this model is to provide a systematic framework for developing experiment-based software. This is achieved by establishing a series of building blocks that act as pre-conditions for running experiments. These blocks are divided into two main parts: the RIGHT process model and the RIGHT infrastructure architecture model. The RIGHT process model follows the Lean Startup methodology cycle [23]: build, measure,
learn. The goal of this cycle is to achieve the vision of the company (which is con-nected to the business model). This is operationalized through hypotheses generated due to uncertainties in how to execute the vision through the business model and strategy. The set of generated hypotheses is prioritized with the learning of previous iterations. The selected hypothesis is implemented through an instrumented minimum viable feature or product (MVF). The collected data from the MVF is analyzed and used to update the assumptions of the business strategy and abandon the tested hy-pothesis or the data is used to further iterate with the hyhy-pothesis by changing or opti-mizing it. The RIGHT infrastructure architecture model sketches the infrastructure needed to run experiments and specifies the roles and tasks, the technical infrastruc-ture, and the information artefacts consumed and generated during the experimenta-tion process. The RIGHT model was created in a startup environment by two compa-nies starting to run their first online experiments, and it takes the approach of abstract-ing the underlyabstract-ing details of a continuous experimentation system, in order to be gen-eralizable to a range of different experiments that can be conducted in a startup envi-ronment.
The discussed models can be used as a starting point for companies to systemati-cally move to an iterative experiment-driven development process, providing a higher level of abstraction of the experimentation process and describing general activities. However, previous research [6], [10]–[15] describes pitfalls, techniques to provide scaling of the experimentation process and techniques to ensure trustworthiness in the experimentation process that are not captured and represented by the higher level of abstraction provided in the discussed models. Instantiating these models directly from a higher level of abstraction can lead to the limitations in the scalability and trustwor-thiness of the experimentation’s activities already identified by previous research.
3
Research Method
To help companies develop and support their experimentation process and infrastruc-ture models we conducted an inductive case study [24] in collaboration with the Analysis and Experimentation team at Microsoft.
Data collection: The collected empirical data consists of interview notes,
white-board drawings, quotes and shared supporting data from nine semi-structured inter-views with an average and median length of thirty-two minutes each. At the time of the data collection, the second author was working with the Analysis and Experimen-tation team and was the main contact person for the other researchers during the data collection and analysis phases. All the interviews were conducted in the premises of the company by the first author, who was accompanied by the second author when possible. The interviewees were selected by the second author and represent a diverse selection of software engineers and data scientists working both within the experi-mentation platform and as users of the platform in different product groups.
The interviews were based on a questionnaire containing eight open-ended ques-tions, starting with a short introduction and explanation of the research. The partici-pants were asked to describe their experimentation process and how it is conducted in
each product they work with. Next, the participants were asked to compare their own experimentation process and infrastructure with the existing models in the literature and point out similarities and differences. Next, they were asked about what experi-mentation activities they performed, the time spent on these activities, their relative impact on the experiment reliability, and the other main activities performed by other people in an experiment lifecycle (from hypothesis generation to decision). We orga-nized the interviews by products and by an approximation of the number of experi-ments the interviewees ran each year. This allowed us to differentiate experiences from products that run experiments on a large scale from products that start and run experiments on a small scale.
Data Analysis: Thematic coding was used to analyze the grouped data [25].
Re-curring codes, drawings of the experimentation process and references to different parts of the platform architecture and activities helped to formalize the new findings and derive the proposed experimentation framework. For example: descriptions of different tests and analysis to ensure the experiment was properly configured were grouped in the “Pre-quality checks” while the different techniques used to evolve a metric were divided between “Online evaluation” and “Offline validation”. We grouped the different experimentation activities in the development, execution and analysis categories. Based on the thematic coding and the reported activities, we compared them with the existing experimentation models to identify the differences from existing models and propose the activity and metric model. Our analysis is based only on data reported by more than one interviewee, and when available in the devel-opment of the models we triangulate the data with other research reports by the Anal-ysis and Experimentation team at Microsoft, available at the weblink: https://exp-platform.com/.
Validity considerations: To improve the construct validity of the study, and prior to the data collection stage, the semi-structured interview guide was applied to a group of two developers from a Brazilian company with experience in A/B testing, known to the first author, and two Ph.D. students in software engineering. This helped to identify potential problems, such as ambiguity in the questions and the explana-tions. Regarding the external validity process, although our work was conducted with only one case company, our empirical data was collected from experiences of several different products which are running trustworthy experiments at scale as well as only a few experiments per year. This helped to identify and compare trustworthy experi-mentation processes at different stages of maturity. Therefore, we believe that our results can be generalized for companies that want to scale their experimentation or-ganization with a trustworthy experimentation process.
4
Findings
In this section, we describe new findings obtained from the empirical data that are not presented in previous research. Together with the description of the experimentation process collected during the interviews, these findings reinforced our motivation to develop the experimentation process framework presented in the next section.
1 - Customer feedback is an important source of experimentation ideas
The first finding from the empirical data is that experimentation ideas, which are later synthesized into experimentation hypotheses, are often inspired by customer feed-back, instead of high-level business goals. In this research, we differentiate experi-ment ideas from experiexperi-ment hypotheses. Experiexperi-ment ideas are the first source of po-tential changes that can be made to systems, and they represent the popo-tential value of a modification. However, often experiment ideas do not represent real value and therefore need to be tested in experiments [26]. Experiment hypotheses synthesize ideas into concrete experimentation scenarios, addressing what the change is, and how it can be implemented and evaluated. Ideas are synthesized into an experiment hy-pothesis by experiment owners. An experiment hyhy-pothesis, after deployment, can measure the real value of the synthesized idea. Developers and product owners often collect experiment ideas using different qualitative feedback collection techniques. Experiment ideas are refined, developed, prioritized and synthesized based on the experiment owners (developers, product owners and data scientists) being convinced of the positive impact for the user and for the key metrics. Another source of custom-er feedback ideas are diffcustom-erentiator features and uscustom-er feedback in competitors’ open channels. Although experiment ideas can come from business strategies, often they influence the prioritization process of experiments by influencing the metrics.
“It is very rare that an experiment comes from the business. Most experiments come from a group of engaged developers willing to code new ideas and run the ex-periments […] The ideas for the new features and their exex-periments are almost al-ways inspired by customers and competition” – Principal Data Scientist
Existing models such as the HYPEX and the RIGHT model propose that the business goals impose outcomes for experiments, but do not explicitly represent how hypothe-ses are identified and prioritized. The QCD model propohypothe-ses business strategies, inno-vation initiatives, customer feedback and previous experiments as the source of new ideas. However, it does not consider differences between experiment ideas and exper-iment hypotheses and how they can be further developed in a concrete experexper-iment hypothesis. This insight reinforces the direct and indirect customer feedback as the drivers of new experiment ideas. However, experiment ideas still need to be priori-tized and synthepriori-tized into experiment hypothesis by experiment owners and engi-neers.
2 - Metrics guide experiments towards long-term goals and help prioritize hy-potheses
The second finding refers to the role of metrics in learning and in hypothesis prioriti-zation. Experiments are launched with the goal of validating a change in the system or learning more about user behavior. Both the validation of a change and the outcomes of an experiment are closely related to the validity of the metric, whether it measures its concept correctly, and whether it reflects the business strategy of the company. If a metric is misaligned with the business strategy of the company, changes and knowledge gained from experiments will also be misaligned with the strategy. How-ever, correctly chosen metrics incentivize teams to take actions which are aligned with the long-term goals of the company [21]. Good metrics will help them prioritize experiments that can have a positive impact on the long-term goals.
“If our decisions to ship are based on these metrics, these metrics have a big im-pact on the development and evolution of the product. They guide the teams to devel-op and focus their work to improve these metrics” – Principal Data Scientist
The existing experimentation models do not describe or emphasize how metrics im-pact hypothesis prioritization and long-term company goals. When metrics are con-sidered only part of the instrumentation system, they do not reflect the bidirectional influence on the business strategy of the company.
3 - Metrics evolve and capture the experiment assumptions
As discussed in the second finding, metrics can guide the long term-goals of the com-pany and help prioritize the hypotheses. Additionally, metrics also capture uncertainty and experiment assumptions. As metrics often represent abstract and subjective con-cepts [21] such as satisfaction and engagement, they contain assumptions about what constitutes these concepts. These assumptions should be tested and validated during the experimentation process and should be constantly iterated in order to maintain alignment with the business strategy. This constant update and validation of the as-sumptions based on the results of an experiment leads to a metric evolution process. Metrics can start as low level signals, and then evolve to capture more complex con-cepts that are more closely aligned with the business strategy. Additionally, the evolu-tion of metrics also reflects the evoluevolu-tion of the business strategy and the product focus over time. As the company changes its strategies, metrics should be updated to align with these changes.
Existing models describe the presence of uncertainty and assumptions in the business strategy and in the role of the business analyst, as they are responsible for hypothesis prioritization. However, these models do not describe or discuss how the metrics evo-lution and the business strategy influence each other and impact the product.
5
The experimentation process framework
In the previous section, we discussed the findings and compared them to previous research. Previous research did not capture all the identified characteristics from the findings nor present specific experimentation details, or the necessary steps to take when running trustworthy online controlled experiments. This led to the motivation and the need to develop a new framework that incorporates these findings. The framework is based on the collected empirical data, including descriptions and draw-ings of the process, comparison with other processes and the characteristics identified in the new findings and in the different components represented in the Microsoft ExP Platform described in [18]. During the data collection, the researchers asked the inter-viewees to describe their experimentation process and compare it with existing mod-els. This discussion, together with findings from previous research, led to the devel-opment of this framework, which consists of the two main aspects of the
experimenta-Fig. 1. The relationship between the two main aspects (in bold), their relation with the business strategy, and how the findings connect them.
Aligns (Insights B,C)
Guide Exp. goals (Insight B) Prioritize (Insight B) Learnings and decisions Update (Insight C) Update assumptions User feedback Synthesized (Insight A) Metrics Business strategy Experiment Experiment hypotheses
tion process: (1) the experimentation activities, and (2) the experimentation metrics. These aspects are related to the business long-term strategies as represented in Fig. 1. This diagram represents how the two main aspects of experimentation used in this work relate to each other and to the business, and how they connect to the findings discussed in the previous section. Next, we detail these two aspects in two separate models, the experimentation activity model, and the metric model. These models were developed based on the collected empirical data and previous research.
5.1 The experimentation activity model
The experimentation activity model describes the different activities which comprise a single experiment iteration, from the experiment ideas, to the experiment analysis necessary for the running of trustworthy online experiments. The arrows correspond to sequential connected activities. For example, when the experiment is launched pre-quality checks are run followed by ramp-up procedures before the experiment data is collected from a larger user base. Furthermore, our model divides the experimentation process into three sequential phases: the experiment development phase, the
ment execution phase, and the experiment analysis phase. We illustrate the
experi-mentation activity model in Fig. 2 and describe the three phases in greater detail.
Experiment development phase
This phase refers to the specification and development activities of the experiment necessary to implement the variation change. This phase takes place before users are exposed to any variations. Finding A discusses how experiment hypotheses are gener-ated and synthesized in the experimentation process. Experiment ideas are usually derived from four sources: (1) customer feedback (Finding A), (2) further iteration from previous experiments iterations [19], (3) need to understand and model the user behavior, and (4) less often through higher-level business goals (dashed line). The hypotheses are prioritized based on the experiment owners’ prior analysis of how the hypotheses can impact the OEC. This analysis can be based on historical data from the feature, insights from other market segments (e.g. a feature that shows success in the US market might be prioritized for launch in another market or globally), or on
Fig. 2. The experimentation activity model
Metric selection Instrumentation system Selection Experiment learnings
Development Execution Analysis
Specify
Feature under change
Experiment data collection Decisions Implements Implements Implements Logs Software product Experimentation phases Computes Detailed hypothesis Aligns Randomization to target group Ramp-up Guardrail boundaries Pre quality
checks Post quality checks Metrics Metric engine Experiment data Potential Hypotheses Customer feedback Previous experiments iterations Business goals
Inputs and outputs Activity Stored data Feature
coding parametrizationFeature Loggingcode
Understanding of the results Artifacts Statistical report and scorecards Alerts Exposed variation Log user-behavior Variation assignment Users Feature under changeFeature under change
Feature under change variations
Metrics by variation Prioritization of hypothesis Prioritize Experiment owners and developers Statistical analysis Iterate/ stop experiment
experience gained from similar previous experiments or other products.
Following prioritization of the hypothesis a detailed hypothesis is elaborated. This includes specification of the experiment type (A/B, A/B/n, MVT etc.), how many variants are going to be present, cohorts or market segmentation, experiment duration and metrics to be used. Additionally, it covers the feature/change specification, in-cluding the area of functionality, actual and expected behavior, and implementation alternatives and considerations.
In addition, the detailed hypothesis specifies the target metrics that are expected to have impact and movements. The specification of the experiment metrics is closely related to the metrics used to prioritize the experiment itself. This includes lower-level signals that measure user-specific behaviors, guardrail metrics that indicate whether an experiment is within the allowed experiment conditions, and the leading metrics [1] that guide the experiment analysis. The metric selection is related to logging capa-bilities. The logging code represents the instrumentation of the system that interacts with the experimentation system. The logging code collects lower-level user behavior signals that can be used to compose complex metrics in the experimentation system. It is worth noting that the logging code should comply with the same standards (e.g. deployment, testing, code review, and integration pipeline) as any other product code.
Depending on the type of detailed specification of the hypothesis, the change in the system at the product level can happen in two ways, or a combination of the two. The first is through coding of the modification. This method is common when the experi-ment specification requires coding of a new feature or extensive modification of exist-ing ones. The experiment set-up is a comparison of the current system with the change (treatment) and the system without the change (control). The second way in which the change can be done is by parametrizing an existing functionality and run-ning experiments to modify these parameters. In this case the functionality already exists but appears to have suboptimal performance. The parameters of this functional-ity are configured during the experiment execution and are assigned to users. Alt-hough this might require a larger overhead in supporting and setting up a configura-tion manager, it reduces the effort and time spent on each experiment.
Experiment execution phase
After the experiment is properly designed, the metrics selected, the change coded and instrumented, the experiment moves to the experiment execution phase. Here, users are randomized and are assigned to the experiment variations of the feature under change. The user behavior is logged, and the initial metrics are computed per variation using the metric engine and initial statistical analysis are computed using the statistical analysis tool. The metric engine is responsible for collecting and transform-ing raw data into experiment metrics. These metrics are consumed by the statistical analysis tool in order to run quality checks, check for guardrail-metrics and generate scorecards. The metrics, as discussed in the metric model, align the experiment goals with the business strategy and serve as input in the prioritization of experiment hy-potheses.
The assignment of the users to the different variations can happened in two general ways (other methods used for websites are described in [15]). The first is to use a feature toggling system. In this case, the change in the system is parametrized using a
variable, and the users are assigned to feature variations that the parameter activates (treatment group) or deactivates (control group). The second method is through traffic routing, where multiple instances of the system are run in parallel and the assignment system redirects the user to one of the multiple instances. The randomization refers to how users are assigned to a specific variation of the experiment during the execution phase. The randomization usually targets a specific group of users at the beginning and then generalizes to a larger audience. This target is specified in the detailed hy-pothesis. Although randomization might look intuitive, there are several techniques available to ensure that the randomization is not biased towards any variation [15], [27]. Then the instrumentation system captures the user behavior and logs the experi-ment data for use in statistical analysis.
The first step in the execution phase is to have confidence that the experiment will yield trustworthy results.
“A lot of effort goes into making sure the experiment passes the (pre-) quality checks. This is an essential step that gives us confidence in the experiment, so that we will not go to the next steps only to discover we did something wrong at the begin-ning” – Principal Data Scientist
Before running experiments and exposing users to different variations, pre-quality tests are run to check for common pitfalls. Examples of pre-quality tests are: A/A or null tests, sample ratio mismatching, randomization checks, and offline testing. The A/A test assigns the users to the same variant A (the system without the change) with the aim of testing the experimentation system and assessing variability in the collect-ed data [15]. The sample ratio mismatch (SRM) [10] is considercollect-ed a critical diagnosis tool for online experiments. The SRM checks the percentage allocation of the users. This allows the experiment owners to detect bias (that would invalidate the experi-ment results) towards any variation as well as check performance considerations. Randomization checks are tests which identify whether the randomization procedure is biased or has any patterns and checks the consistency of the randomization between sessions (to ensure that recurring users see the same variations). Offline testing uses historical data to assess the impact of the changes in the system and estimate confi-dence intervals [28].
After the pre-quality checks the activities that take place in the experiment execu-tion phase are: the ramp-up, guardrail boundaries and experiment data collecexecu-tion. Ramp-up is a procedure where the treatment variations are initially launched to a small percentage of users. This is useful because critical errors can be detected early while exposing only a small number of users to the treatment variations. Large effect sizes in key metrics are mostly related to experiment errors [29], therefore fewer us-ers’ needs will be exposed to the change while identifying such errors. As the experi-ment runs without severe degradations, the percentage of users exposed to the treat-ment can be continuously increased until each variation has equal allocation, so that the experiment power is maximized [15]. A ramp-up procedure should be implement-ed together with an automatimplement-ed alerting capability with different significant levels and configurable actions. By checking guardrail metrics and experiment boundaries, such as key metrics that the experiment should not alter or deteriorate, the alerting system will alert experiment owners if something unusual is happening. In extreme cases, it
will shut down an experiment with a significant negative impact if no action was tak-en. This allows organizations to invest in innovative and bold changes while reducing the risk of exposing users to bad ideas and errors [15].
After the main experiment execution, post-quality tests can be run to ensure that the experiment is valid and the data is reliable. Common post-quality checks are (1) checking for experiment invariant metrics, (2) learning effects, (3) A/A tests, (4) in-teraction effects with other overlapping experiments, and (5) novelty effects [20]. Experiment invariant metrics are metrics that are not expected to change within the scope of the experiment. If there is a statistically significant movement in those met-rics during the experiment execution, either the assumptions about the impact of the experiment are wrong or the implementation of the experiment is wrong. In both cas-es, it is worth exploring the reasons for these unexpected results. Other quality checks that are beyond the scope of this paper can be seen in [2], [10], [20]. The statistical analysis tool supports the whole experiment execution, computing guardrail tests and quality checks. Following the post-quality checks, the statistical analysis tool gener-ates reports and scorecards for the key metrics of the experiment. Qualitative data collected from feedback boxes and other consumer feedback channels (if available) can be used together with the quantitative analysis to help explain the result.
Experiment analysis phase
The analysis phase follows both the data collection and the conclusion of the ex-periment execution. The analysis phase consists of developing an understanding of the statistical output of the experimentation system in the context of assumptions about user behavior.
Understanding of the results is an activity that analyzes the results from the statisti-cal analysis in order to generate evidence about customer preferences and behavior and thus facilitate the decision-making process. It is important to reinforce that as the complexity of the experiment increases and there is not a standard OEC, key metrics can move in opposite directions, behave differently in different markets and in differ-ent user segmdiffer-ents. In such scenarios, it is important to understand why differdiffer-ent mar-kets or user segments behaved differently. Not only does this generate meaningful knowledge which can be used to update assumptions about user behavior, but it also facilitates the process of decision-making and helps the evolution of the metrics and their alignment with the business strategy. Based on the results of this activity, the company can make decisions (such as ship or not ship the change) and update their assumptions and the metrics.
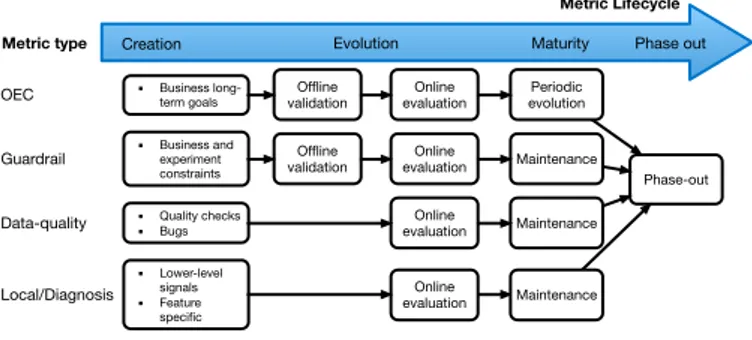
5.2 The experiment metric model
A key component of the experimentation process described above is the metrics. Met-rics guide hypothesis prioritization, the instrumentation required in the system, and the understanding of the results, and reveal whether the experiment results can be trusted. The experiment metric model that we discuss in this section characterizes two aspects of metrics: metric lifecycle and metric type. These two aspects are related to the findings B and C. These findings reinforce the central role that metrics play in the experiment design and execution. The metric lifecycle is divided into four main
phas-es: creation, evolution, maturity and phase-out. The metric type is based on the four metric types identified in previous research [10]: OEC metrics, data-quality metrics, guardrail metrics and local feature and diagnostic metrics. The metric model is repre-sented in Fig. 3.
The arrow in the metric model refers to the different stages in a metric lifecycle. In the creation phase, a first prototype of a metric is created. In this step, the metric con-sists of either aggregated lower-level signals (such as usage time, clicks, etc.), or modifications of existing metrics (such as linear combination or proportions).
The evolution phase consists of refining the metric and aligning it with the metric goal. During this process additional metrics can be combined with the original one to better capture more complex concepts. The refinement process can also impact the sensitivity of the metric. Offline validation and online evaluation are two techniques used to assess and support the evolution of a metric. The offline validation process analyses the metric directionality and sensitivity. Directionality refers to the direction of positive impact. The sensitivity of a metric refers to how well a metric is capable of moving due to the treatment. Techniques for offline validation of metrics can be found in [21], [22]. Online evaluation refers to analyzing the metric during an exper-imental run. This includes computing the metric with live users. The evaluation can be done through the comparison of the new metric with other existing metrics and through degradation experiments. Degradation experiments refer to the degrading of the user experience to find the directionality and sensitivity of metrics in the absence of an experiment corpus or analogous metrics for comparison. Strange movements of metrics during the experiment execution and quality tests can indicate instrumentation problems.
The maturity phase represents a period where the metric has been evaluated or val-idated and does not go through extensive modifications. For some metrics, the maturi-ty phase represents a phase where they are updated in pre-established periods with learnings from multiple experiments or updated to accommodate changes in the busi-ness strategy of the company or the product, or only when issues arise in a mainte-nance process.
The last phase is the phase-out. In this phase, older metrics can be replaced with newer metrics, and metrics specific to an experiment or feature are deactivated after the experiment or feature lifecycle is over. It is worth noting that each metric might reach the different stages during different time frames. Metrics designed to be used only in one experiment can go through the creation to the phase-out process in only one experiment cycle. Metrics specific to features go through many experiment cy-cles, until the feature is only maintained or it is abandoned. OEC metrics that cross several features and even products can last many experimental cycles and years.
The second aspect of the metric model that we describe refers to the type of metric. Overall Evaluation Criteria (OEC) metrics guide the experiment outcomes and are a
Fig. 3. The metric model
Phase-out
Creation Evolution Maturity Phase out
Online evaluation Maintenance ▪ Lower-level signals ▪ Feature specific Local/Diagnosis Online evaluation Offline
validation evolutionPeriodic
▪ Business long-term goals OEC Maintenance Online evaluation Offline validation ▪ Business and experiment constraints Guardrail Online evaluation Maintenance ▪ Quality checks ▪ Bugs Data-quality Metric type Metric Lifecycle
measure of the experiment’s success. They represent and capture assumptions about business strategies and long-term company goals. OEC metrics are used across exper-iments and their evolution depends on the inputs from multiple experexper-iments and the alignment with business goals. The evolution of OEC metrics affects multiple exper-iments and therefore is only updated periodically. The update of such metrics goes through offline validation and online evaluation.
Data-quality metrics are used in quality checks and inconsistency checks, such as implementation bugs, synchronization errors, and telemetry loss. Some of these met-rics are feature specific, such as checking for data quality in experiments specific for a feature, while others are used in multiple experiments during pre-quality checks, such as the Sample Ratio Mismatch and checks for randomization imbalance during A/A tests. These metrics are evaluated online and their evolution and update occur when feature-specific modifications require updates or when issues arise.
Guardrail metrics are metrics that are not used as an indicator of success but in-stead serve as boundaries for the experiment. Negative movements of guardrail met-rics might be an indicator that experiment conditions were violated, generating alerts. These metrics, although they do not represent business directions as the OECs do, can represent business constraints on the OEC movement. These metrics evolve periodi-cally in order to align with changing business restrictions. When updated, guardrail metrics go through offline validation and online evaluation.
Local feature and diagnosis metrics are metrics used in individual functionalities of products. They do not impact other experiments and serve as diagnostic indicators used to understand the movement of OECs and guardrail metrics. Diagnosis metrics represent lower-level signals and serve as debug metrics for understanding unex-pected movements of OEC and guardrail metrics. Local feature and diagnosis metrics are usually constrained to the experiment or feature lifecycle. Due to their short lifecycle these metrics are only evaluated online. To support the creation, evolution, maturity and phase-out phases of the different types of metrics, the experimentation team should support a metric management platform. This type of system prioritizes important metrics, constrains metrics to specific features and keeps track of inactive phased-out metrics for comparison and offline validation between older and newer experiments.
6
Conclusions
Online controlled experiments have become the standard practice for evaluating ideas and prioritizing features in most large web-facing software-intensive companies [1], [3]–[5]. Although companies can rely on models to start their experimentation organi-zation and data-driven practices they might struggle to establish a trustworthy exper-imentation process as they scale their experexper-imentation organization. Previous research provides models and processes for starting an experimentation organization based on higher-level descriptions of the experimentation process. However, these models do not capture all details and techniques that allow companies to scale and to ensure trustworthiness in the experimentation process [6], [10]–[15]. Based on a case study
research with multiple product teams responsible for running online controlled exper-iments at Microsoft, we provide an experimentation framework composed of two detailed experimentation models focused on two main aspects; the experimentation activities and the experimentation metrics. This model discusses granular aspects of the experimentation process that can help companies and practitioners to scale their experimentation activities into a trustworthy experimentation process.
In future research, we plan to validate this experimentation process in other com-panies, to compare how the different activities map onto their experimentation pro-cess and analyze other aspects of the experimentation propro-cess, such as how the organ-ization roles change during the evolution of the experiment.
Acknowledgments: This work was partially supported by the Wallenberg
Artifi-cial Intelligence, Autonomous Systems and Software Program (WASP), funded by the Knut and Alice Wallenberg Foundation. The authors would like to thank Mi-crosoft’s Analysis and Experimentation team for the opportunity to conduct this study with them.
References
1. A. Fabijan, P. Dmitriev, H. H. Olsson, and J. Bosch, “The benefits of controlled experimentation at scale,” in Proceedings - 43rd Euromicro Conference on Software Engineering and Advanced Applications, SEAA 2017, 2017, pp. 18–26.
2. R. Kohavi, A. Deng, B. Frasca, R. Longbotham, T. Walker, and Y. Xu, “Trustworthy online controlled experiments,” Proc. 18th ACM SIGKDD Int. Conf. Knowl. Discov. data Min. - KDD ’12, p. 786, 2012.
3. E. Bakshy, D. Eckles, and M. S. Bernstein, “Designing and Deploying Online Field Experiments,” Proc. 23rd Int. Conf. World wide web - WWW ’14, pp. 283–292, Sep. 2014. 4. H. Gui, Y. Xu, A. Bhasin, and J. Han, “Network A/B Testing,” in Proceedings of the 24th
International Conference on World Wide Web - WWW ’15, 2015, pp. 399–409.
5. D. Tang, A. Agarwal, D. O’Brien, and M. Meyer, “Overlapping experiment infrastructure,” in Proceedings of the 16th ACM SIGKDD international conference on Knowledge discovery and data mining - KDD ’10, 2010, p. 17.
6. P. Dmitriev, B. Frasca, S. Gupta, R. Kohavi, and G. Vaz, “Pitfalls of long-term online controlled experiments,” Proc. - 2016 IEEE Int. Conf. Big Data, Big Data 2016, pp. 1367– 1376, 2016.
7. F. Fagerholm, A. Sanchez Guinea, H. Mäenpää, and J. Münch, “The RIGHT model for Continuous Experimentation,” J. Syst. Softw., vol. 123, pp. 292–305, 2017.
8. H. H. Olsson and J. Bosch, “The HYPEX Model: From Opinions to Data-Driven Software Development,” Contin. Softw. Eng., vol. 9783319112, pp. 1–226, 2014.
9. H. H. Olsson and J. Bosch, “Towards Continuous Customer Validation: A Conceptual Model for Combining Qualitative Customer Feedback with Quantitative Customer Observation,” in Icsob, vol. 114, 2015, pp. 154–166.
10. P. Dmitriev, S. Gupta, K. Dong Woo, and G. Vaz, “A Dirty Dozen: Twelve Common Metric Interpretation Pitfalls in Online Controlled Experiments,” Proc. 23rd ACM SIGKDD Int. Conf. Knowl. Discov. data Min. - KDD ’17, pp. 1427–1436, 2017.
11. T. Crook, B. Frasca, R. Kohavi, and R. Longbotham, “Seven pitfalls to avoid when running controlled experiments on the web,” Proc. 15th ACM SIGKDD Int. Conf. Knowl. Discov. data Min. - KDD ’09, p. 1105, 2009.
12. T. Kluck and L. Vermeer, “Leaky Abstraction In Online Experimentation Platforms: A Conceptual Framework To Categorize Common Challenges,” 2017.
13. R. Chen, M. Chen, M. R. Jadav, J. Bae, and D. Matheson, “Faster Online Experimentation by Eliminating Traditional A / A Validation,” pp. 1635–1641, 2017.
14. R. L. Kaufman, J. Pitchforth, and L. Vermeer, “Democratizing online controlled experiments at Booking.com,” http://arxiv.org/abs/1710.08217, 23-Oct-2017. [Online]. Available: http://arxiv.org/abs/1710.08217.
15. R. Kohavi, R. Longbotham, D. Sommerfield, and R. M. Henne, “Controlled experiments on the web: survey and practical guide,” Data Min. Knowl. Discov., vol. 18, no. 1, pp. 140–181, Feb. 2009.
16. A. Fabijan, H. H. Olsson, and J. Bosch, “Customer Feedback and Data Collection Techniques in Software R&D: A Literature Review,” in Software Business, ICSOB 2015, vol. 210, J. M. Fernandes, R. J. Machado, and K. Wnuk, Eds. Braga, Portugal: Springer International Publishing, 2015, pp. 139–153.
17. R. Kohavi and S. Thomke, “The Surprising Power of Online Experiments,” Harvard Business Review, no. October, 2017.
18. S. Gupta, S. Bhardwaj, P. Dmitriev, L. Ulanova, P. Raff, and A. Fabijan, “The Anatomy of a Large-Scale Online Experimentation Platform,” in International Conference on Software Architecture ICSA, 2018, no. May.
19. K. Kevic, B. Murphy, L. Williams, and J. Beckmann, “Characterizing experimentation in continuous deployment: A case study on bing,” in Proceedings - 2017 IEEE/ACM 39th International Conference on Software Engineering: Software Engineering in Practice Track, ICSE-SEIP 2017, 2017, pp. 123–132.
20. A. Fabijan, P. Dmitriev, H. H. Olsson, and J. Bosch, “The Evolution of Continuous Experimentation in Software Product Development,” in Proceedings of the 39th International Conference on Software Engineering ICSE’17, 2017.
21. P. Dmitriev and X. Wu, “Measuring Metrics,” Proc. 25th ACM Int. Conf. Inf. Knowl. Manag. - CIKM ’16, pp. 429–437, 2016.
22. A. Deng and X. Shi, “Data-Driven Metric Development for Online Controlled Experiments,” Proc. 22nd ACM SIGKDD Int. Conf. Knowl. Discov. Data Min. - KDD ’16, pp. 77–86, 2016.
23. E. Ries, The Lean Startup: How Today’s Entrepreneurs Use Continuous Innovation to Create Radically Successful Businesses. 2011.
24. P. Runeson and M. Höst, “Guidelines for conducting and reporting case study research in software engineering,” Empir. Softw. Eng., vol. 14, no. 2, pp. 131–164, 2009.
25. C. Robson and K. McCartan, Real World Research, 4th ed. John Wiley & Sons Ltd, 2016. 26. R. Kohavi, A. Deng, B. Frasca, T. Walker, Y. Xu, and N. Pohlmann, “Online controlled
experiments at large scale,” Proc. 19th ACM SIGKDD Int. Conf. Knowl. Discov. data Min. - KDD ’13, p. 1168, 2013.
27. A. Deng, J. Lu, and J. Litz, “Trustworthy Analysis of Online A/B Tests,” Proc. Tenth ACM Int. Conf. Web Search Data Min. - WSDM ’17, pp. 641–649, 2017.
28. L. Bottou, J. Peters, J. Quiñonero-Candela, D. X. Charles, D. M. Chickering, E. Portugaly, D. Ray, P. Simard, and E. Snelson, “Counterfactual Reasoning and Learning Systems,” J. Mach. Learn. Res., vol. 14, pp. 3207–3260, 2013.
29. R. Kohavi, A. Deng, R. Longbotham, and Y. Xu, “Seven rules of thumb for web site experimenters,” Proc. 20th ACM SIGKDD Int. Conf. Knowl. Discov. data Min. - KDD ’14, pp. 1857–1866, 2014.