ISSN Online: 1947-394X ISSN Print: 1947-3931
DOI: 10.4236/eng.2017.910048 Sep. 30, 2017 801 Engineering
Is Mosul Dam the Most Dangerous Dam in the
World? Review of Previous Work and
Possible Solutions
Nadhir Al-Ansari
1, Nasrat Adamo
1, Varoujan Sissakian
2, Sven Knutsson
1, Jan Laue
11Lulea University of Technology, Lulea, Sweden 2University of Kurdistan, Erbil, Iraq
Abstract
Mosul Dam is an earth fill dam located on the Tigris River in North Western part of Iraq. It is 113 m in height, 3.4 km in length, 10 m wide in its crest and has a storage capacity of 11.11 billion cubic meters. It is, constructed on be-drocks which consist of gypsum beds alternated with marl and limestone, in cyclic nature. The thickness of the gypsum beds attains 18 m; they are in-tensely karstified even in foundation rocks. This has created number of prob-lems during construction, impounding and operation of the dam. Construc-tion work in Mosul Dam started on January 25th, 1981 and started operating on 24th July, 1986. After impounding in 1986, seepage locations were recog-nized. The cause of seepage is mainly due to: 1) The karsts prevailing in the dam site and in the reservoir area. 2) The existence of gypsum/anhydrite rock formations in the dam foundation alternating with soft marl layers and wea-thered and cavernous limestone beddings. 3) The presence of an extensive ground water aquifer called Wadi Malleh aquifer, which affects considerably the ground water regime in the right bank. The dissolution intensity of the gypsum/anhydrite ranged from 42 to 80 t/day which was followed by a noti-ceable increase in the permeability and leakages through the foundation. In-spection of the dam situation in 2014 and 2015 indicates that the dam is in a state of extreme unprecedentedly high relative risk. In this work, possible so-lutions to the problem are to be discussed. It is believed that grouting opera-tions will elongate the span life of the dam but do not solve the problem. Building another dam downstream Mosul Dam will be the best protective measures due to the possible failure of Mosul Dam, to secure the safety of the downstream area and its’ population.
Keywords
Mosul Dam, Tigris River, Dam Failure, Karstification, Flooding, Iraq
How to cite this paper: Al-Ansari, N., Adamo, N., Sissakian, V., Knutsson, S. and Laue, J. (2017) Is Mosul Dam the Most Dangerous Dam in the World? Review of Previous Work and Possible Solutions. Engineering, 9, 801-823.
https://doi.org/10.4236/eng.2017.910048 Received: August 31, 2017
Accepted: September 27, 2017 Published: September 30, 2017 Copyright © 2017 by authors and Scientific Research Publishing Inc. This work is licensed under the Creative Commons Attribution International License (CC BY 4.0).
http://creativecommons.org/licenses/by/4.0/
DOI: 10.4236/eng.2017.910048 802 Engineering
1. Introduction
Mosul Dam is located on the Tigris River in North Western part of Iraq; ap-proximately 60 km northwest of Mosul city [1] (Figure 1). Mosul Dam is one of the most important strategic projects in Iraq for management of its water re-sources. Construction of Mosul Dam began on January 25th, 1981 and started operating on July 7th, 1986. The dam is a multipurpose project to provide water for many irrigation projects located in the north and south of Iraq, flood control and hydropower generation. The dam is 113 m high and 3650 m long including the spillway. The top width is 10 m at the 341 m (a.s.l.) crest level. The dam is an earth fill type with a clay core. The upstream side is faced with rock [1]. The dam was designed to impound 11.11 km3 of water at the normal operation level, in-cluding 8.16 and 2.95 km3 of live and dead storage respectively (Figure 2).
The dam has a concrete spillway located on the left abutment. The weir crest elevation of the spillway is 317.5 m (a.s.l.) and its length is 680 m. The spillway has five radial gates measuring 13.5 m × 13.5 m giving a discharge of 12,600 m3
Figure 1. Location of Mosul Dam with main facilities.
Figure 2. Schematic diagram of Mosul Dam cross section.
ffl 247 m a.s.l ffl 300 m a.s.l ffl 341 m a.s.l ffl 335 m a.s.l ffl
330 m a.s.l Max. operation level
Min. operation level Normal operation level (storage capacity =11.11 km3)
Clay core Earth fill
shell
Live storage capacity = 8.16 km3
Dead storage capacity = 2.95 km3
DOI: 10.4236/eng.2017.910048 803 Engineering sec-1 at the maximum reservoir level of 338 m (a.s.l.) [1]. The total cost of Mosul Dam was estimated at 2.6 billion US$ at the prices level of 1980s.
After impounding in 1986, seepage locations were recognized. The seepage due to the dissolution of gypsum and anhydrite beds raised a big concern for the safety of the dam and its possible failure. This problem was kept in a small closed circle within the Iraqi Ministry of Water Resources (previously Ministry of Irrigation) till the US Army Corps of Engineers conducted a study on Mosul Dam for the period June, 2004 to July, 2006 and highlighted the possibility of the dam failure. News media had highlighted this concern in 2014 when ISIS occu-pied the dam site area. It was reported that about 500,000 would lose their lives in case of Mosul Dam failure. Loses of property and destruction of the infra-structure of the main cities downstream the dam will be enormous, and the flood wave will reach the capital city Baghdad. In this research, the main geolog-ical and engineering problems will be highlighted, and possible solution will be recommended.
2. Geology of the Area
In the vicinity of Mosul Dam, the exposed formation is Lower Fars (Fatha). It is composed of alternating beds of limestone, marl and gypsum [2]. The dam ab-utments are located on the Upper Member of the Fatha Formation (Middle Mi-ocene) (Figure 3). The Upper Member, as the Lower Member of the Fatha For-mation consists of cyclic sediments, marls, clay stone, limestone and gypsum; however, in the uppermost part the clay stone ratio increases as compared with the lower part. These inhomogeneous rocks; in their mechanical behavior, will certainly behave differently when are loaded. The gypsum and limestone beds are usually karstified, but the Karstification is less in the Upper Member as compared to Lower Member of the Fatha Formation [3] [4]. This is attributed to the presence of more clastics in the Upper Member than that of the Lower Member of the Fatha Formation, besides that gypsum and limestone beds be-come thin in the uppermost parts of the formation.
Due to the complexity of the geology of the area, several investigations were carried out (e.g. [5]-[19]). Al-Ansari et al. [2] reported that there were two faults within the dam site area. The first is of rotational type striking NW-SE offsetting the northern corner of Butmah East structure. The other fault is trending N NE-S SW along the right bank of the River Tigris. This fault is not clear on the surface and it was detected using Landsat images. This is due to the fact that the fault is deep seated and it might be partly controlling the Tigris River course from the dam site to Aski Mosul. Wakeley et al. [20] collected all the borehole data and constructed a model to show the complex geology at the dam site (Figure 3).
No tectonic activity is reported from the dam site and near surroundings [21]. Furthermore, the present small faults, as discovered at the dam site during ex-ecution of detailed geological mapping by Iraq Geological Survey has no signifi-
DOI: 10.4236/eng.2017.910048 804 Engineering Figure 3. Intersecting cross sections from intermediate version of ERDC geologic conceptual model, showing complex stratigra-phy and partial resolution of discrepancies in stratigrastratigra-phy at intersections of the geologic panels from generated boreholes [20].
cant importance and/ or causes any hazard for the dam [5]-[19]. Therefore, the area of the dam site almost doesn’t suffer from active tectonic disturbances; this is also confirmed by Kelly et al. [22], when they stated that the dam body does not suffer from any problem.
3. The Problem
The geology created a number of problems during construction, impounding and operation of the reservoir. After impounding in 1986, seepage locations were recognized. The cause of seepage is mainly due to geological problems that can affect the safety of the dam. These problems are:
- The karsts prevailing at the dam site and in the reservoir area.
- The existence of gypsum/anhydrite rock formations in the dam foundation alternating with soft marl layers and weathered and cavernous limestone bed-dings.
aqui-DOI: 10.4236/eng.2017.910048 805 Engineering fer, which affects considerably the ground water regime in the right bank.
The most significant geological hazard that influences Mosul Dam is the Kars-tification, especially in the foundation’s rocks. The influence of the Karstification is also confirmed by [2] [4] [7] [23]-[28]. The karst development extends to a depth of 100 m below the foundation of the dam. The Karstification enhanced the extensive dissolution of gypsum and gypsum anhydrite rocks present above and below the limestone layers. These dynamics caused the collapsing of whole layers of clayey marls into the underneath cavities forming beds composed of brecciated gypsum particles and anhydride blocks embedded into a loose clayey matrix. Four such layers were discovered during the geological investigations (Figure 4).
The presence of surface cracking and groundwater fluctuation give rise to the development of sinkholes. One sinkhole on the left flank of the reservoir ap-peared suddenly overnight in February 2003 and developed rapidly with 15 m of settlement and a 15 m diameter depression (Figure 5). Other sinkholes appeared on the right side downstream the dam (Figure 6). The rate of settlements of these sinkholes was 0.25 m when they appeared in 1992 and then reduced to 50% in 1998. The maximum cumulative settlement was recorded to be 5 m in a sink-hole SD4. It is believed that the formation of these sinksink-holes is due to the disso-lution of surface gypsum beds, which led to the formation of conduits under the surface. This took place due to the groundwater flow from Wadi Malleh aquifer toward the River Tigris, and the recharge of this aquifer increased tremendously when the reservoir was impounded. The conduit has developed in size due to the fluctuation of the water level in the pond downstream the main dam caused by the operation of the regulating dam. Once the size of these caves increased and became closer to the surface they collapsed after heavy rainfall. Recent bathyme-tric survey conducted in 2011 showed the presence of a large number of sink-holes within the reservoir area (Figure 7). This is a dangerous phenomenon, es-pecially if they are connected to Wadi Malleh aquifer, then they can cause nu-merous problems for the safety of the dam.
In addition, springs also appeared downstream the dam located on the same line of the sinkholes. The flow from the spring reached 360 l/s (Figure 8). The water had high concentration of sulphate indicating its origin from Wadi Malleh aquifer [30]. It should be mentioned, however, the amount of seepage flow from the Wadi Malleh aquifer was very high in the pumping storage scheme and the tailrace tunnel and its intake structure. The excavation of the caverns was only possible after performing extensive grouting works all around these caverns. The importance of the Wadi Malih aquifer is not only due to the great difficulties it caused during the construction of the pump storage scheme; but also that it shapes the ground water flow regime in and around the right abutment of the dam in addition to the fact that it contributed to the formation of a series of sinkholes at the right bank downstream of the main dam. The high concentra-tion of sulphate in the water of this aquifer clearly indicates the dissoluconcentra-tion of
DOI: 10.4236/eng.2017.910048 806 Engineering Figure 4. Geological Cross Section along the axis of the dam.
DOI: 10.4236/eng.2017.910048 807 Engineering Figure 5. The left bank sinkhole (A) early stage (B) full development stage.
Figure 6. Sinkholes downstream Mosul Dam-Right Bank.
DOI: 10.4236/eng.2017.910048 808 Engineering Figure 8. Example of seepage.
Figure 9. Fissure on the right slope side of the dam.
Figure 10. Large conduit found in March 2002 in the upper right rim of the reservoir. gypsum from the dam site and its vicinity. In addition, the hydrostatic pressure of water within the reservoir is increasing the rates of dissolution. This process is in progress since the operation of the dam. This process also led to the appear-ance of other features like the fissure near 100 m from the right abutment of the dam which appeared in 2002 (Figure 9). Furthermore, the dissolution pheno-mena continued into later years. Figure 10 shows a large conduit which was discovered in March 2002 within a gypsum/anhydrite layer on the right side of the reservoir.
In view of the above, it can be clearly stated that there are a dynamic move-ment of groundwater within the dam site and its surrounding causing high rates of dissolution of gypsum associated with washing fine clay and carbonate small
DOI: 10.4236/eng.2017.910048 809 Engineering particles. This process is alarming where it can create large caves that can reach the surface of the ground leading to sudden collapse of the ground surface dur-ing the infiltration of surface water through the top cover of these caves. This was noticed in February 2003 (see Figure 5), October 2004 and July 2005. This phenomenon is old within the karstified rocks of the area and has been increas-ing in its rate due to the effect of the operation of the dam ([5]-[19]).
4. Present Status of the Dam
To evaluate the status of the geological conditions in the dam area, the Engi-neer’s and Environmental center of research of the US Army Corps of Engineers
[22] used the rock quality designation (RQD) [31] as an index for the descrip-tion of rock mass fractured state. The comparison performed was on samples taken in 1989 and 2006. The results showed that RQD was 45% - 65% and 0% - 20% for the two years respectively. The deterioration of the samples is due to the dissolution of gypsum (Figure 11).
In addition, the deep curtain grouting was also investigated. It was noticed that some parts were highly deteriorated and required grouting 4 or 5 times an-nually. It was also noticed that the dissolution front had progressed 350 m to-ward the east, i.e. an average of about 17 m/year. The samples recovered from the grouting gallery showed that all the rocks were replaced by friable grout ma-terial.
Taking this information into consideration, the following points can be hig-hlighted:
- The dissolution phenomenon is not recent in Mosul Dam area. The im-pounding of Mosul Dam reservoir increased the rate of dissolution of the rocks. This led to the sudden appearance of sinkholes in the area.
- The bedding plains under the foundation of the dam represent weak areas, which eased the water movement along these surfaces. The movement of water along these surfaces increased the dissolution of rocks vertically and horizontal-ly. Furthermore, the supply of fresh unsaturated water from Mosul Dam reser-voir tremendously increased this process.
- The dip of the beds on the eastern side of the dam does not exceed 6 degrees
DOI: 10.4236/eng.2017.910048 810 Engineering in SE direction and this makes the groundwater to move along this direction. It was noticed that when the water level in the reservoir exceeds 318 m. a. s. l. the rate of dissolution increases. This is attributed to the rock types within the area. The beds on the far eastern part of the dam are horizontal, and that condition decreases the rate of dissolution. It should be also mentioned that the high dip of beds on the right side of Wadi Deer Al Malleh fold is so high, and this reduces the rates of dissolution there.
In view of the above, it is obvious that the situation of the dam is deteriorating with time. On the 8th of August, 2014, the Islamic State of Iraq and Syria (ISIS) terrorists group seized control of the Mosul Dam, and it was seized back from the hands of ISIS on the 16th of the same month. The end result of all this was the halting of the grouting operations which had continued for the past 30 years and had consumed more than 95000 tons of solid grouting materials, which were considered, even if temporary solution, the only one necessary to stabilize the foundation for some more time. In 2015, many United States agencies were led by the USACE to carry out measurements, surveys and observations to follow developments that might lead to the dam failure. The findings of the team were: a) The concentration of sulfates in the seepage water increased indicating in-creased dissolution of gypsum.
b) Caverns and sinkholes were increasing under the dam. There were signs of increased formation of cavities under the dam. Dissolution of gypsum reached 10,000 m3 during the period August 2014 until beginning of 2016 due to discon-tinuation of grouting works.
c) Increased monolith movement in the grouting gallery and cracks’ opening were noticed ([32] p. 12). The movements are believed to be caused by settle-ment and not resulting from onsite activity. Cumulative settlesettle-ment in the grout-ing gallery from 1986 to the end of 2015 records showed a sharp increase in set-tlement in 2015 which indicates a worsening situation in the dam foundations
([32] p. 13). Satellite based information also indicated that there is local differen-tial settlement in the body of Mosul Dam averaging from 5 to 10 mm/year [33] [34]. In December 2016, Milillo et al. [37] published their findings from space geodetic monitoring of Mosul Dam. They found that the rate of subsidence of Mosul Dam for the period 2004-2010 was 12.5 mm/year has increased to 15 mm/year after 2013 after re-grouting operations stopped (Figure 12). This sub-sidence is related to the dissolution of gypsum and the reservoir-induced pres-sure which is the main cause of an increase in the dissolution rates. They also added that any annual increase of water levels in the reservoir in the future could lead to an increase of water pressure in the dam foundation, which combined with the absence of re-grouting could speed up the dissolution of the dam sub-strate and promote its destabilization.
The plot of the data for Mosul Dam on the screening Portfolio Risk Analysis (SPRA) process for Dam Safety is shown in Figure 13. This plot considers load-ing frequency, an engineerload-ing ratload-ing to estimate a relative probability of failure,
DOI: 10.4236/eng.2017.910048 811 Engineering Figure 12. Up-down (left) and east-west (right) displacement at the Mosul dam, Iraq. Negative values indicate downward and westward motion respectively ([32]).
DOI: 10.4236/eng.2017.910048 812 Engineering and both human life loss and economic consequences of failure [35] [36]. This procedure shows that Mosul Dam is in a state of extreme relative risk (Figure 13). For more details, see ([5]-[19]).
5. What Happens if the Dam Fails?
In 1984, the Ministry of Irrigation commissioned the Swiss Consultants Consor-tium to carry out a potential dam break and flood wave study for Mosul Dam. The study was completed in three volumes report, which contained the possible causes of failure, full description of the mathematical model used, its calibration using known high flood recordings, and a complete flood routing of the wave in its way in the Tigris river valley down to (24) kilometers south of Baghdad [38] [39] [40] [41] [42]. Swiss consultant considered that if failure occurred; the most plausible cause would be piping in the foundation resulting in enlarged flows within the dam base which would progress to open a big gap in the dam. The model used in the simulation was (Flow in River Systems) best known as (FLORIS). The calibrating of the model showed that it fits best the recorded floods when manning (n) used was (0.030). For a flood wave of the size under consideration, the consultant adopted rightly a value of (n) equals (0.033), and even checked what could happen if (n) is (0.050). For gap width, two values were considered; 700 meters and 200 meter respectively. The first value being the more plausible one as it is equal to the length of the dam section closing the river channel, while the second is in line with the Corps of Engineers practice of con-sidering a gap width double the dam height. Six scenarios were run to get the hydrographs of the Flood wave for these scenarios. The results are shown in Ta-ble 1 which is constructed from the tables and hydrographs given in the original study [38] [39] [40] [41] [42] and published in reference [19].
From Table 1, it can be seen that the initial maximum discharge of the wave may vary between (551,000 m3/second to (415,000 m3/second) according to the scenario under consideration. FLORIS was then used to route the wave all the way down to Baghdad for different possible water levels in the reservoir. Table 2
shows the peak discharges of the wave, its heights, and times of arrival at the different cities and towns along the river course.
This study was checked by Black & Veatch in 2005. They outlined their con-clusions in their report [27]. Their method was to decouple the derivation of the breach development hydrograph from routing the wave in the river channel. For the first part they used, the model (DAMBRK UK) upgraded to fit UK condi-tions by Binnie and Partners and the University of Bradford, and they indicated Table 1. Scenarios of breach formation at Mosul Dam [39].
Case A B C D E F
Breach width of bottom(m) 700 700 700 700 200 200 Breaching time (hours) 4 4 5 5 2 2 Roughness of the river channel Manning’s (n) 0.33 0.050 0.033 0.050 0.033 0.5
DOI: 10.4236/eng.2017.910048 813 Engineering Table 2. Reservoir out flow in 1000 m3∙sec−1 [41].
Hours/Case A B C D 0 1 1 1 1 1 13 13 13 13 1.5 80 80 80 80 2.0 215 210 215 212 2.5 372 356 335 325 3.0 474 452 422 404 3.5 535 499 480 453 4.0 551 510 509 475 4.5 538 469 497 460 5.0 507 469 497 460 6.0 405 382 435 405 8.0 271 266 186 278 10.0 186 192 195 198 12.0 123 136 130 142 18.0 37 47 39 49 24.0 18 2 19 22
that the output could be fed to any of the two models (ISIS 2.2) developed by (HR Wallingford) and Halcrow (UK) or (MIKE 11) developed by the Danish Hydraulic Institute in order to carry out the wave flood routing. Both models had the capability of presenting the results in a graphical form and interfacing with GIS to provide details of impounded area. As a final judgment (Black & Veatch) considered that both models did not add to the accuracy of the results in the Swiss Consultants using (FLORIS) and any additional output did not justify the additional work needed to apply any of these two models, so they accepted using (FLORES) for the flood wave routing. They considered finally that SC study was done in the best possible way and in a highly professional manner. Later, in (2009) and (2015) two more studies on the subject were done namely
[43] [44]. In these studies, they used other models for the analysis but in using these models they assumed gap width and time of the gap breach without giving justification of the selected values. Their assumption of (n) value seemed also to be far from the real conditions. In addition to all this, no mention was given on how the calibration of their models, and its validation were done. These missing details result in many question marks and may shed doubt on the outcome of these studies.
A new study was performed by [45] from the Joint Research Center of the European Commission (JRC. They investigated the time evolution and characte-ristics of the flood wave and its impact on the population living along the Tigris River. The (HyFlux2) computer code was used, which had been developed at the
DOI: 10.4236/eng.2017.910048 814 Engineering center by [46]. This model was routinely used for tsunami and storm surge events but originally developed for dam break analysis problems.
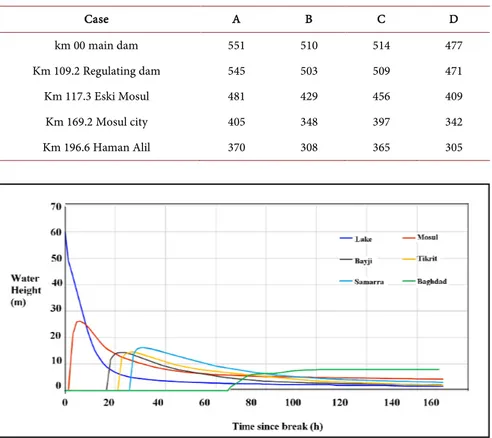
Table 3 summaries the results of the studied scenarios for different reservoir levels and assuming the bottom of the breach at level (252), breach area equal (26%) of the dam surface area, i.e. 40,560 m2 out of 155,000 m2. This table gives the peak height of the wave, time of arrival of the wave and time of arrival of its peak to five cities along the river. Accordingly, the wave will reach Mosul city after 1 hr. 40 min. and Baghdad in 3.5 days. The maximum height will be about (26) meters and (8) meters in Mosul and Baghdad respectively. Figure 14 gives the wave peak height at five cities and its arrival time.
From LANDSAT 2014 Global population Database and the STRM91 and to-pography layers with resolution of 1 Km2, the researchers arrived at the number of affected population at different depths of inundation. This was done by supe-rimposing water depths of (0.1 m, 0.5 m, 2.0 m, 5.0 m, 10 m and >10 m) on the (LANDSAT 2014) global population database to find the number of people be-tween these levels. The studies arrived at very interesting statistics which is shown in Table 4. This table shows the total number of population and total areas affected for a scenario of reservoir water level of (330) which is the maxi-mum reservoir design operation level.
From tables presented in this study Table 5 was also constructed. It gives the number of population affected at various reservoir water levels (RWL), for dif- Table 3. Peak discharges in 1000 m3∙sec−1 [45].
Case A B C D km 00 main dam 551 510 514 477 Km 109.2 Regulating dam 545 503 509 471 Km 117.3 Eski Mosul 481 429 456 409 Km 169.2 Mosul city 405 348 397 342 Km 196.6 Haman Alil 370 308 365 305
DOI: 10.4236/eng.2017.910048 815 Engineering Table 4. Number of People affected and areas inundated at various water depths of flood water for reservoir water level (330) [45].
Inundation Population Area (km2)
0.1 - 0.5 m 948,000 637 0.5 - 2.0 m 3,144,000 2022 2 - 5 m 1,626,000 1150 5 - 10 260,000 916 >10 m 270,000 916 Total 6,248,000 7202
Table 5. Affected population for different periods and depths of inundation level in five major cities along river course ([45]).
RWL T Inudation Mosul Bayji Tikrit Samara Baghdad
330 6 0.1 - 0.5 21,000 0 0 0 746,000 0.5 - 2.0 55,000 300 100 3000 2,949,000 2 - 5 41,000 400 2500 100 1,134,000 5 - 10 60,000 17,000 14,000 5500 26000 >10 183,000 2000 4000 3500 0 319 6 0.1 - 0.5 27,000 0 0 0 803,000 0.5 - 2.0 12,000 500 0 0 1,756,000 2 - 5 510,000 15,000 3500 1000 750,000 5 - 10 66,000 4500 14,000 10000 78,000 >10 125,000 0 500 1000 0 300 12 0.1- 0.5 14,000 500 500 1000 382,000 0.5 - 2.0 m 15,000 9500 7000 7000 850,000 2 - 5 86,000 3500 8000 3000 229,000 5 - 10 54,000 0 500 500 60,000 >10 4000 0 0 0 0
ferent periods (T) and at different depths of inundation at the five biggest cities along river course shown. The scenarios of failure are:
- Reservoir water level = 330 which is the maximum design operation water level. - Reservoir water level = 319 which is the maximum operation water level adopted in (2006).
- Reservoir water level = 300 which is the dead storage water level as per de-sign.
From all these statistics, it can be concluded that If Mosul Dam fails, then the catastrophe which follows is by far beyond anything, which had been expe-rienced before or can be imagined to happen in the future.
DOI: 10.4236/eng.2017.910048 816 Engineering
6. Possible Solutions?
Since the start of the seepage and other problems, solutions were discussed to solve them by the International Board of Experts (IBOE) which had been ap-pointed by the Ministry of Irrigation at that time to follow the designs and the construction of the dam. The IBOE had number of meetings with the designers and contractors discussing the problems at the dam site. Many reports and stu-dies had been also prepared by other consultants and experts who were invited by the Contractors or the Board and even by the Owner were also discussed during these meetings. Grouting problems and type of grout mixtures were among those. Recommendations to use silica gel in the grouting of the left bank curtain in order to reduce seepage appearing in the left bank and very high takes of cement grouts and the use of sand gravel mixes in a number of zones were al-so considered (see [47] [48]). All studies concluded that the dissolution of rocks that had occurred since impounding was substantial, but not so great as to prec-lude a successful completion.
Several alternatives were suggested. These were:
a) Precipitation of insoluble materials (such as sodium chloride) from ground seepage water to fill seepage paths. This was rejected since the precipitant vo-lume will not be enough to fill seepage paths of various sizes and that the in-jected fluid may flow in an unpredicted manner by varying seepage flows.
b) Protecting gypsum or anhydrite surfaces against dissolution by sealing gypsum/anhydrite surfaces. This can be achieved either by maintaining a satu-rated or super satusatu-rated solution with SO4 against the rock surfaces, which re-quires a continuous supply of solution to seepage water probably from an up-stream gypsum blanket. This was also rejected due to large quantities of removed gypsum daily from the foundation and the uncertainty of directions taken by seepage flow path. The other alternative was to provide a chemical solution, which react with CaSO4 to form a highly insoluble coating. This suggests the use of calcium oxalate, but the problem facing this solution is the tenacity and dura-bility of such a coating against further seepage and the uncertainty and difficul-ties of judging the performance with time. In addition, this material has the toxic effects of oxalate to animals and humans, and the large volumes required to be released into ground water.
c) Use of barriers: This can be achieved by:
i) Blanketing: Blanketing the upstream side of the dam and reservoir (Figure 15). This is normally done by drawing down the reservoir, and to avoid this, dropping the lining materials (bentonite pellets) through pipes lowered into the bottom of the pond then sand would be placed on top to hold the clay in place against any disturbances. This method has not been used in ponds and not in large reservoirs before.
ii) Positive cutoff: A cutoff wall is to be constructed as shown in (Figure 16). This procedure is very risky to be executed now on Mosul Dam. The risk in-volves the great depth of the cutoff wall, hardness of pervious strata, presence of
DOI: 10.4236/eng.2017.910048 817 Engineering Figure 15. Illustration of upstream blanketing arrangement.
Figure 16. Illustration of upstream cut-off arrangement.
cavities and voids in the foundation, in addition to maintaining the verticality of the diaphragm panels at these unprecedented depths. The Board; however, judged this solution undesirable due to the required lowering of the reservoir level, which could extend 2 - 3 years in addition to the very high cost.
iii) Construction of a new curtain: This is to be done as a direct reinforce-ment to the existing curtain; this assumes that it could be done in a better geo-logical location in the upstream of the dam in order to provide improvement. The geological conditions are not different upstream the dam, and the construc-tion require the drawing down of the reservoir so such proposal had no value.
The Ministry of Irrigation asked an expert (Mr. Mariotti) to further discuss the problem of the curtain and give suggestions. His report was submitted to the International Board of Experts [49] and the following proposals were given:
a) In the context of strengthening the grout curtain in the problem areas where massive grouting had to be repeated, widening the curtain was recom-mended. Additional rows of boreholes ought to be drilled consisting of one row upstream of the present curtain and slightly inclined towards the upstream, another row in the downstream of the present curtain and inclined towards downstream, and finally a central vertical row in between. The central row was to be grouted first followed by the upstream row and then the downstream. Fi-nally, the central row would be re-drilled and fine grouting to be performed us-ing silica gel. The Board did not object to this proposal as machinery and grout-ing capacity were available.
b) The second solution was to construct a tunnel the length of the chalky se-ries from which grouting would be performed. The Board thought that such work was very specialized and would need expert studies to check its feasibility.
re-DOI: 10.4236/eng.2017.910048 818 Engineering place risky material. This alternative received the same comments as in (b) above.
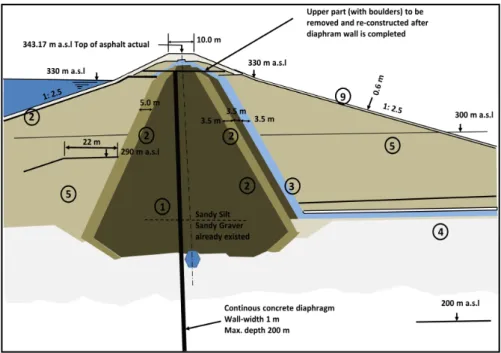
d) The fourth alternative was to construct a diaphragm wall from the up-stream berm, with a sloping concrete facing from the top of the diaphragm to the top of the dam (Figure 17). Or even to remove part of the top of the dam and install the diaphragm from the top through the core in a location upstream of the gallery. This arrangement was attributed to the unavailability of machines that could cut to the desired level. In a later update, the removal of the dam top was thought unnecessary due to new development in diaphragm machines. This suggestion was disregarded due to technical and economic factors.
All the discussed alternatives were not practical, and some of them were even not feasible. Therefore, it was decided to continue the works on the present cur-tain by improving the mixes and injection procedure to combat large take areas, sealing large pipes and channels, providing a new array of piezometers taping the known solution areas especially the contact between the pervious limestone and gypsum GB0 layers to monitor the efficiency and the long term performance of the curtain in these soluble layers where windows were most likely would de-velop.
To take some protective measures due to the possible failure of Mosul Dam, to secure the safety of the downstream area and its’ population the Ministry of Ir-rigation decided to construct Badush Dam in 1988. The design and construction of Badush Dam were initiated in 1988 using fast track method to complete the dam within four years. It is located on the Tigris River, approximately 40 km downstream from Mosul Dam site and approximately 15 km upstream of Mosul city (Figure 18). Other functions of the dam were power generation using water discharged by Mosul Dam and by the regulating scheme power plants. The work
DOI: 10.4236/eng.2017.910048 819 Engineering Figure 18. Badush Dam location in relation to Mosul Dam [50].
on this dam was halted in 1991 due to UN sanctions on Iraq.
7. Conclusions and Recommendations
Mosul Dam is suffering from the seepage problem under the foundation of the dam since the start of its impounding in 1986. Various works were done to overcome the problem, but it seems that the dam is showing more and more signs of weakness. In view of all the published work and meetings, it is well un-derstood that the geology of the dam site is very complicated, and it suffers from severe problems due to the presence of badly jointed and cavernous soluble gypsum/anhydrite layers, gypsum breccias layers, weathered and jointed limes-tone and soft marls. The consultants had underestimated these problems where impounding have increased the solubility of the rocks within the vicinity of the dam and enhanced the formation of sinkholes. Despite all the intensive main-tenance work the dissolution of gypsum continued and the gypsum breccias lay-ers were very much resistant to grouting at the deep grout curtain zones. Fur-thermore, it is evident from the work done that grouting can only be a tempo-rary solution and cannot stop permanently the dissolution of gypsum. In addi-tion, it is causing weakening of the rocks by the re-grouting process; it cannot stop the progressive formation of sinkholes and; moreover, it is giving a false sense of security.
Looking at the reports, papers and discussions of researchers and experts, it is believed that the following points are to be considered:
- Keeping the reservoir water level as low as possible for such a period that might be necessary subject to updated risk analysis.
ex-DOI: 10.4236/eng.2017.910048 820 Engineering isting monitoring program and upgrade the system with new available instru-mentation to pin point the most critical locations to be grouted.
- Providing possible early warning system for changing conditions that may indicate where and when a failure mechanism is developing.
- Bathymetric survey should be conducted to determine the points of excessive leakage from the reservoir and to detect any sinkhole, spring and seeps within the upstream area in the reservoir close to the dam.
- Emergency Action plan should be developed and implemented, and the pub-lic should be aware of such a plan.
- A new panel of experts is to be established to meet every three months to re-view the status of the grouting program and any new development.
- Since grouting is not the final solution for the problem, other alternatives are to be carefully studied, and a decision should be taken to solve this problem. These solutions may require including the construction of a diaphragm in Mosul Dam, completion of Badush Dam or a hybrid solution of both.
References
[1] Iraqi Ministry of Water Resources (2012) Water Resources, Mosul Dam. https://www.mowr.gov.iq/en
[2] Al-Ansari, N.A., Barazanji, A., Al-Jabari, M. and Gayara, A. (1984) Geological In-vestigation of Mosul Dam Site. The Ministry of Irrigation, 41 p.
[3] Sissakian, V.K. (1978) Report on the Geological Mapping of Tuz Khurmatu-Kifri- Kalar Area. Iraq Geological Survey Library Report No. 902.
[4] Sissakian, V.K. and Al-Mousawi, H.A. (2007) Karstification and Related Problems, Examples from Iraq. Iraqi Bulletin of Geology and Mining, 3, 1-12.
[5] IVO (Imatran Voima Osakeyhtio) (1969) Consulting Engineers, Finland, Geologic Map of Mosul Dam. Ministry of Agrarian Reform.
[6] Al-Sinjari, M.A. (2007) Characterization and Classification of Some Vertisols West of Duhok Governorate. PhD Thesis, University of Mosul.
[7] Sissakian, V.K., Al-Ansari, N. and Knutson, S. (2014) Karstification Problems in Mosul Dam and Its Assessment. North Iraq. Engineering, 6, 84-92.
https://doi.org/10.4236/eng.2014.62012
[8] Adamo, N., Al-Ansari, N.A., Issa, I.E., Sissakian, V. and Knutsson, S. (2015) Mys-tery of Mosul Dam the Most Dangerous Dam in the World: Problems Encountered during and after Impounding the Reservoir. Journal of Earth Sciences and Geotech-nical Engineering, 5, 47-58.
[9] Adamo, N., Al-Ansari, N.A., Issa, I.E., Sissakian, V. and Knutsson, S. (2015) Mys-tery of Mosul Dam the Most Dangerous Dam in the World: Foundation Treatment during Construction. Journal of Earth Sciences and Geotechnical Engineering, 5, 59-69.
[10] Adamo, N., Al-Ansari, N.A., Issa, I.E., Sissakian, V. and Knutsson, S. (2015) Mys-tery of Mosul Dam the Most Dangerous Dam in the World: Maintenance Grouting. Journal of Earth Sciences and Geotechnical Engineering, 5, 71-77.
[11] Adamo, N., Al-Ansari, N.A., Issa, I.E., Sissakian, V. and Knutsson, S. (2015) Mys-tery of Mosul Dam the Most Dangerous Dam in the World: Experts Proposals and Ideas on Mosul Dam. Journal of Earth Sciences and Geotechnical Engineering, 5,
DOI: 10.4236/eng.2017.910048 821 Engineering 79-93.
[12] Al-Ansari, N.A., Issa, I.E., Sissakian, V., Adamo, N. and Knutsson, S. (2015) Mys-tery of Mosul Dam the Most Dangerous Dam in the World: The Project. Journal of Earth Sciences and Geotechnical Engineering, 5, 15-31.
[13] Al-Ansari, N.A., Adamo, N., Issa, I.E., Sissakian, V. and Knutsson, S. (2015) Mys-tery of Mosul Dam the Most Dangerous Dam in the World: Karstification and Sinkholes. Journal of Earth Sciences and Geotechnical Engineering, 5, 33-45. [14] Al-Ansari, N.A., Adamo, N., Issa, I.E., Sissakian, V. and Knutsson, S. (2015)
Mys-tery of Mosul Dam the Most Dangerous Dam in the World: Dam Failure and Its Consequences. Journal of Earth Sciences and Geotechnical Engineering, 5, 91-111. [15] Al-Ansari, N.A. (2015) Geological and Engineering Investigations of the Most
Dangerous Dam in the World. SCIENPRESS, London.
[16] Sissakian, V., Al-Ansari, N.A., Issa, I.E., Adamo, N. and Knutsson, S. (2015) Mys-tery of Mosul Dam the Most Dangerous Dam in the World: General Geology. Jour-nal of Earth Sciences and Geotechnical Engineering, 5, 1-13.
[17] Adamo, N. and Al-Ansari, N.A. (2016) Mosul Dam Full Story: Safety Evaluation of Mosul Dam. Journal of Earth Sciences and Geotechnical Engineering, 6, 185-212. [18] Adamo, N. and Al-Ansari, N.A. (2016) Mosul Dam Full Story: Engineering
Prob-lems. Journal of Earth Sciences and Geotechnical Engineering, 6, 213-244.
[19] Adamo, N. and Al-Ansari, N.A. (2016) Mosul Dam Full Story: What if the Dam Fails? Journal of Earth Sciences and Geotechnical Engineering, 6, 245-269.
[20] Wakeley, L.D., Kelley, J.R., Talbot, C.A., Pearson, M.L. and Broadfoot, S.W. (2007) Geologic Conceptual Model of Mosul Dam. U.S. Army Engineer Research and De-velopment Center, 61 p.
[21] Sissakian, V.K., Abdul Ahad, A.D. and Hamid, A.T. (2011) Geological Hazards in Iraq, Classification and Geographical Distribution. Iraqi Bulletin of Geology and Mining, 7, 1-28.
[22] Kelly, J., Wakeley, L.D., Broadfoot, S.W., Pearson, M.L., McGill, T.E., Jorgeson, J.D., Talbot, C.A. and McGrath, C.J. (2007) Geologic Setting of Mosul Dam and Its En-gineering Implications. Final Report, U.S. Army Engineer District, Gulf Region, Baghdad.
[23] Swiss Consultants (1979) Mosul Dam Project-Planning Report, Vol. 1, State Organ-ization of Dams, Republic of Iraq, Ministry of Irrigation.
[24] Black and Veatch (2004) Mosul Dam Assessment, Review of 1984 Dambreak and Floadwave Study for Mosul Dam, Mosul Dam Library, Iraq.
[25] Mark and Wheeler (2004) Mosul Dam Assessment, Task Order No. 8, Report on Site Visit, Mosul Dam Library, 3-7 September, 2004.
[26] Sissakian, V.K. and Ibrahim, F.A. (2004) Geological Hazards Map of Mosul Qua-drangle, Scale 1:250000. Iraq Geological Survey Library Report No. 2860.
[27] Washington Group International (2005) Inter-Office Correspondence. Mosul Dam Library.
[28] Hijab, S.R. and Al-Jabbar, M.A. (2006) Geophysical Investigation on Mosul Dam Area, Stage One, Emergency Microgravity Survey. Iraq Geological Survey Library, Internal Report.
[29] Issa, E.I., Al-Ansari, N.A. and Knutsson, S. (2013) Changes in Bed Morphology of Mosul Dam Reservoir. Journal of Advanced Science and Engineering Research, 3, 86-95.
DOI: 10.4236/eng.2017.910048 822 Engineering [30] Swiss Consultant (1984) Mosul Dam Project Hydrological Study on Right Bank
Report. State Organization of Dams, Republic of Iraq, Ministry of Irrigation, June 1984.
[31] Deere, D.U. and Deere, D.W. (1989) Rock Quality Designation (RQD) after Twenty Years Contract Report GL-89-1. U.S. Army Engineer Waterways Experiment Sta-tion, Vicksburg.
[32] Al-Abayachi, S. (2016) Report on Mosul Dam, Iraqi House of Representatives. Agriculture, Water, and Marshes Sub-Committee.
https://drive.google.com/file/d/0Byn0PFg9wZ5FNHNQUmxLb0JzenM/view [33] Coffman, R. (2014) Mosul Dam Could Fail if ISIS Doesn’t Continue Grouting
Op-erations. Expert Says, University of Arkansas, Fayetteville, Article ID: 621536. [34] Cetinic, F. (2016) Satellite Based Information to Support Health Analysis of Mosul
Dam. International Workshop on Mosul Dam, Stockholm, 24-25 May 2016. [35] MaCleanathan, J.T. (2009) Update for Screening Portfolio Risk Analysis for U.S
Army Corps of Engineers Dams. Risks and Reliability Directorate USACE.
[36] U.S. Department of the Interior Bureau of Reclamation (2014) Interim RCEM (Reclamation Consequence Estimating Methodology). Guidelines for Estimating Life Loss for Dam Safety Risk Analysis, February 2014.
[37] Milillo, P., Bürgmann, R., Lundgren, P., Salzer, J., Perissin, D., Fielding, E., Biondi, F. and Milillo, G. (2016) Space Geodetic Monitoring of Engineered Structures: The Ongoing Destabilization of the Mosul Dam, Iraq. Scientific Reports, 6, Article No. 37408. http://www.nature.com/articles/srep37408
https://doi.org/10.1038/srep37408
[38] Swiss Consultants (1984) Security Measures II, Addendum 3-Flood Wave Studies, Task 2 Mosul Flood Wave, Confidential Report for the Ministry of Irrigation, State Organization of Dams, V. 1 (Summary), V. 2 (The Model and Model Calibration), V. 3 (Calculation of Mosul Flood Wave).
[39] Swiss Consultants (1984) Security Measures II, Addendum 3-Flood Wave Studies, Task 2 Mosul Flood Wave, Confidential Report for the Ministry of Irrigation, State Organization of Dams, V. 1 (Summary), V. 2 (The Model and Model Calibration), 3 (Calculation of Mosul Flood Wave).
[40] Swiss Consultants Consortum (1984) Mosul Dam Flood Wave. Summary, Vol. 1. [41] Swiss Consultants Consortum (1984) Mosul Dam Flood Wave. Model Calibration,
Vol. 2.
[42] Swiss Consultants Consortum (1984) Mosul Dam Flood Wave. Calculation, Vol. 3. [43] Al-Taiee, T.M. and Rasheed, M.M. (2009) Simulation Tigris River Flood Wave in
Mosul City Due to hypothetical Mosul Dam. 13th International Water Technology Conference, Hurghada.
[44] Mahmud, M.I., Al Azawi, A.O., Abdul Majeed, A.T. and Khalil, T.W. (2015) Mosul Dam Break Scenario and Its Effects on the Areas along the River down to Baghdad. Ministry of Higher Education and Scientific Research, Center for Catastrophes Data Management and Space Archives, Baghdad. (In Arabic)
[45] Annunziato, A., Andredakis, I. and Probst, P. (2016) Impact of Flood by a Possible Failure of the Mosul Dam. Version 2, Joint Research Centre JRC Technical Reports, EU Commission.
http://publications.jrc.ec.europa.eu/repository/bitstream/JRC101555/lbna27923enn. pdf
Im-DOI: 10.4236/eng.2017.910048 823 Engineering pact Assessment of Severe Inundation Scenario to Chemical Facilities and Down-stream Environment. EUR 23354 EN-2008.
http://www.google.se/url?sa=t&rct=j&q=&esrc=s&source=web&cd=2&ved=0ahUK EwiMrcDK4tfRAhWC1iwKHf9MA3wQFggeMAE&url=http%3A%2F%2Fportal.gd acs.org%2Fabout%2FPublications%2FItemID%2F205%2FModID%2F662&usg=AF QjCNEG-Mtyu2tSVcrmS_-6nWjrvmfAgw&bvm=bv.144224172,d.bGg
[47] Luga, R. (1986) Report on Visit in February 1986 Concerning Grouting Works. GEOCONSEIL, Ministry of Irrigation, Baghdad.
[48] Binnie and Partners (1987) Mosul Dam Foundation Cut-Off. Report, Ministry of Ir-rigation, Baghdad.
[49] IBOE (1989) International Board of Experts. Interim Meeting Report, Ministry of Irrigation, Baghdad, Iraq.
[50] Al-Adily, A., Khasaf, S. and Ajaj, A. (2014) Hydrological Impacts of Iraqi Badush Dam on Ground Water. International Water Technology Journal, 4, 90-106.

![Figure 7. Holes noticed at the bed of Mosul reservoir [29].](https://thumb-eu.123doks.com/thumbv2/5dokorg/4426709.106496/7.892.311.809.298.665/figure-holes-noticed-bed-mosul-reservoir.webp)

![Figure 11. Samples recovered from well drilled near SD5 ([20]).](https://thumb-eu.123doks.com/thumbv2/5dokorg/4426709.106496/9.892.416.703.844.1057/figure-samples-recovered-drilled-near-sd.webp)
![Figure 13. Screening Portfolio Risk Analysis (SPRA) for Mosul Dam [32].](https://thumb-eu.123doks.com/thumbv2/5dokorg/4426709.106496/11.892.107.784.107.544/figure-screening-portfolio-risk-analysis-spra-mosul-dam.webp)
![Table 5. Affected population for different periods and depths of inundation level in five major cities along river course ([45])](https://thumb-eu.123doks.com/thumbv2/5dokorg/4426709.106496/15.892.311.809.153.332/table-affected-population-different-periods-depths-inundation-cities.webp)