Wetland Survey
Compiled Excerpts From The National Final Report
iSSN 0282-7298
Sweden has the highest variation in wetland types within the EU. A fifth of the country’s land area is covered by wetlands, and after Russia, it has the largest wetland area in Europe.
The Swedish Wetland Survey (VMI) took place between 1981 and 2004. The survey covered all large wetland sites except from the ones in the alpine zone. About 35,000 wetland sites were surveyed with a com-mon methodology. All sites were surveyed by aerial photographs and about 12 % of the sites were also surveyed in the field. The survey covers 3.4 million hectares or approximately 8 % of Sweden’s land area.
The purpose of this report is to make information about the wetland survey available outside of Sweden. The report is a compilation of excerpts from the national final report. It focuses on VMI-methodology, Swedish wetland types, and the results and the final evaluation of the survey.
The Swedish Wetland Survey
Compiled Excerpts From The National Final Report
URbaN GUNNaRSSON aND MiChaEl lÖFROTh
SWEDISH ENVIRONMENTAL PROTECTION AGENCY
Compiled Excerpts From The National Final Report
Urban Gunnarsson1 and Michael Löfroth2
1. County Administrative Board of Dalarna, Falun 2. Former project leader VMI
The national final report in Swedish: Gunnarsson Urban and Löfroth Michael. 2009. Våtmarksinventeringen (VMI)
– resultat från 25 års inventeringar
Translated and summarized by Saskia Sandring, Swedish University of Agricultural Sciences, Umeå
Internet: www.naturvardsverket.se/Om-Naturvardsverket/Publikationer/Publications-in-English
The Swedish Environmental Protection Agency
Phone: + 46 (0)10-698 10 00, Fax: + 46 (0)10-698 10 99 E-mail: registrator@naturvardsverket.se
Address: Naturvårdsverket, SE-106 48 Stockholm, Sweden Internet: www.naturvardsverket.se
ISBN 978-91-620-6618-5 ISSN 0282-7298 © Naturvårdsverket 2014 Print: Arkitektkopia AB, Bromma 2014
Preface
The VMI (The Swedish Wetland Survey) is a huge survey. During the survey 1980–2005 altogether about 35, 000 sites were surveyed by aerial photo-graphs and about 12 % of the sites were also surveyed in the field. The survey covers about 8% of Sweden’s land area. The survey was done by the County Administrative Boards with financial support and co-ordination from The Swedish Environmental Protection Agency (Sw. Naturvårdsverket). Most of the counties have published their results in final reports. The national final report was published in 2007. The reports and some unpublished manuscripts have been converted to digital format and will soon be available on the internet.
This report was commissioned by the Swedish Environmental Protection Agency and carried out by Urban Gunnarsson and Michael Löfroth. Saskia Sandring has been the main responsible for the translation. The purpose has been to make the results from the wetland survey available outside of Sweden. The report is a compilation of excerpts from the national final report. But there are also some added text and corrections of errors compared to the Swedish version. The text focuses on the data that may be of most interest for the international reader, such as the methodology used, description of wetland types and results. There is less information about objectives and evaluation of the survey, and none about costs, description of current threats to wetlands and data presented per county.
The Swedish Environmental Protection Agency hopes that this compiled report will make the Swedish wetlands and the Swedish Wetland Survey known in other countries and be of use for those that want to know more about Swedish Wetlands.
The views expressed in this report are those of the authors and do not nec-essarily represent the views of the Swedish Environmental Protection Agency. The Swedish Environmental Protection Agency, July 2014
Contents
SummAry 6
InTrOducTIOn 7
Wetland definition 7
Objectives of the survey 7
ThE mEThOdOlOgy 9
Step 1 – Choice of sites and remote sensing 10
The VMI data structure 10
Remote sensing 11
Step 2 – Preliminary conservation values 13 Four classes of nature conservation value 13
Value criteria 13
Step 3 – Field survey and final classification 14 Data, quality assurance and publications 14
ThE VmI wETlAnd TyPES 15
rESulTS 22
Surveyed area 22
Wetlands types 22
Distribution of wetlands in Sweden 24
Mire regions 25
Nature conservation value 28
Degree of human impact 28
EVAluATIOn Of ThE VmI 31
Has the VMI attained its objectives? 31
Strengths and weaknesses of the VMI 31
Future development 32
Conclusions 32
PrEVIOuSly PublIShEd VmI-rEPOrTS 33
Summary
The VMI (the Swedish Wetland Survey) was coordinated by the Swedish Environmental Protection Agency in cooperation with the County
Administrative Boards during 1981–2005. VMI surveyed all larger wetlands sites outside the Alpine zone. In total, 35, 000 wetland sites were included in the survey, corresponding to 4.3 million hectares, or approximately 10% of the land area of Sweden. The main objectives of the survey were: to classify and identify valuable wetlands which should be conserved for future genera-tions, to investigate the impact of human activities on the wetlands of Sweden, and to increase general knowledge about wetlands in Sweden.
In this report we describe the method used, and present some of the main results. In the VMI, wetlands to be surveyed were defined as: ‘areas where the water table, during the main part of the year, is close below, at or above the ground level, including vegetation covered water surface, and areas exposed when the water level is low.
Due to limited financial resources a lower size limit was used for selecting sites to be surveyed, i.e. all wetlands larger than 10 hectares in southern Sweden and 50 hectares in northern Sweden. During remote sensing, all sites were clas-sified to wetland type and assigned a nature conservation value. Twelve per cent of the sites were also surveyed in the field, to gather supplementary data.
Based on the distribution of different mire types, the country was divided into five mire-type regions (i.e. the Mountain mire region, the Palsa mire region, the Aapa mire region, the Raised bog region, and the Pine bog-marsh mire region). The mire type regions correspond in many ways to the ones in neighboring countries (Finland, Norway and Denmark). The most common wetland type in Sweden is topogenous fens, followed by string mixed mires and string fens.
The survey shows that about 80% of the Swedish wetlands are disturbed by human activities, especially by drainage that causes degeneration of the wet-land ecosystems. When classifying the site’s nature conservation value, lack of negative human impact was one of the important criteria, but also represen-tativity and wetland diversity. The sites were assigned a nature conservation value (class 1–4), 11% to class 1 (the highest values), 24% to class 2 (high values), 51% to class 3 (medium values) and 14% to class 4 (low or no values).
All VMI data is collected in the VMI database. The data is regularly used in the daily work by civil servants as well as others. The results have for example been used to make the Swedish Mire Protection Plan, to select Ramsar sites and in different court cases. Thanks to VMI many wetlands have been preserved for the future.
Introduction
Sweden has the highest variation in wetland types within the EU. A fifth of the country’s land area is covered by wetlands, and after Russia, it has the largest land area in Europe. Between 1981 and 2004, about 35, 000 wet-lands throughout the country, except for the Alpine zone, were surveyed with a common methodology. The VMI (våtmarksinventeringen – “the Swedish Wetland Survey”) includes a total wetland area of 3.4 million hectares.
Wetland sites included in the VMI are, in general, a larger hydrologi-cal unit consisting of wetland. Very large wetland areas have sometimes been divided into smaller wetland sites in the survey.
The survey consists of two parts. The first part included all surveyed wetlands, and consists mainly of collecting data from remote sensing. In the second part, the most valuable wetlands (ca. 12%, i.e. about 4,000 sites) were surveyed in the field as well.
Data from the survey were collected in a national database, to permit analysis of the results. The present report is a compilation of excerpts from the national final report (Gunnarsson & Löfroth 2009), containing some data analysis of the results and a description of the method.
Wetland definition
In the VMI, wetlands were defined as: ‘areas where the water table during the main part of the year is close below, at or above the ground level, including vegetation covered water surface. An area is called a wetland when at least 50% of its vegetation is hydrophilic, i.e. water loving. Exceptions are tem-porarily exposed lake-, sea-, and river beds; they are classified as wetlands despite a lack of vegetation.’ (Löfroth 1991).
This definition differs from that used by the Ramsar Convention, (Convention on wetlands): ‘Wetlands are areas of marsh, fen, peatland or water, whether natural or artificial, permanent or temporary, with water that is static or flowing, fresh, brackish or salt, including areas of marine water the depth of which at low tide does not exceed six meters.’ The Ramsar con-vention thus includes open water areas that are not included in the Swedish Wetland Survey.
The VMI definition is currently broadly accepted within Swedish nature conservation and environmental protection.
Objectives of the survey
During the late 1970s, consciousness of the value of wetlands increased. At the same time, the exploitation of wetlands also increased markedly, through
a survey of wetlands, aimed at improving knowledge of Swedish wetlands and their nature conservation value. The survey started with an initial period including method-developing.
The objectives of VMI that was identified initially was: • to identify all larger wetlands except in the Alpine zone;
• to identify wetland types and to describe their overall ecological, hydrological and morphological qualities;
• to describe the degree and type of human impact on wetlands; • to classify the nature conservation value of wetlands;
• to collect data as a base for administration and planning at the level of regional and national authorities, for dealing with wetland matters, such as applications for ditching, peat harvesting, deforestation, and water regulation.
The methodology
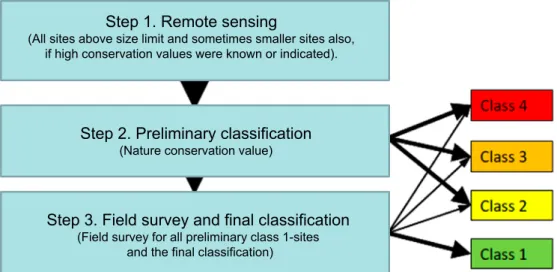
The basic standardized methodology in the VMI was constant throughout the entire period, but development in science and technique during the survey etc were gradually reflected in the methodology. The basic method was intro-duced by Göransson et al. (1983), and further developed by Löfroth (1991). The VMI-methodology consists of three steps (Figure 1). All sites were sur-veyed using aerial photographs (step 1). In step 2, all sites were assigned a preliminary rank, according to their nature conservation value. Those ranked highest were surveyed in the field (step 3). The rank of some sites was also adjusted on the basis of field data.
Figure 1. Korrigerad text ligger ovanpå äldre text i ruta Step 1-3. Hela bilden kan förminskas eller förstoras för att passa in i manus och teckenstorlek eller typsnitt ändras för bästa slutlig läsbarhet.
Step 1. Remote sensing
(All sites above size limit and sometimes smaller sites also, if high conservation values were known or indicated).
Step 2. Preliminary classification
(Nature conservation value)
Step 3. Field survey and final classification
(Field survey for all preliminary class 1-sites and the final classification)
Figure 1. Schematic flowchart of the VMI in general, including classification of nature conservation values.
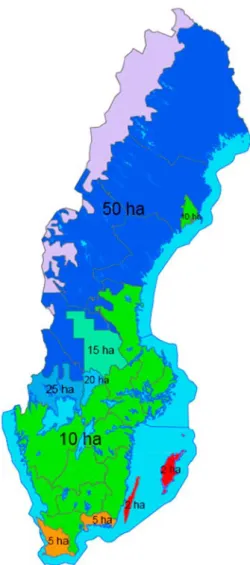
Step 1 – Choice of sites and remote sensing
The VMI covers the whole of Sweden except the Alpine zone. In northern Sweden in general, all wetlands larger than 50 ha, and in southern Sweden, all wetlands larger than 10 ha, were included; however, there were some excep-tions to these size limits (Figure 2). Other size limits were used in some parts, due to financial constraints or to the importance of mapping small wetlands in counties with few wetlands, than in those with many, and especially in areas with many small rich fens. In addition to size, other information was used to choose wetlands, viz. reports by locally knowledgeable people, answers from questionnaires and places known from the literature. This additional choice of wetlands included a number of wetlands below the regional size limit.
The VMI data structure
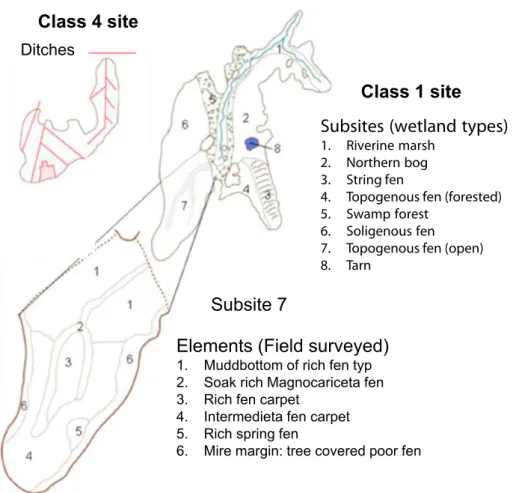
Information about all wetlands was collected at three hierarchical levels: site, sub-site and element (Figure 3). A site is defined as an area with a continu-ous wetland cover. This means that a site can include one or several wetland types. A sub-site is an area or several areas within a site, with one of the wetland types used for the sub-sites, (see table 1). The smallest feature, the element, describes structures and veg-etation types (e.g. string, flark, pool, spring or lawn). The vegetation type was classified both from aerial photo-graphs (step 1) and in the field (step 3). Vegetation types classified from aerial photographs were rough vegetation classes, whereas in field vegetation was classified mainly according to the veg-etation types described by Nordiska ministerrådet (The Nordic Council of Ministers), in 1994. There is a digital version at http://www.norden.org/). Only in a few cases new vegetation types were described. Sub-elements were sometimes used if there were patches of other vegetation types within an element.
Figure 2.
OBS! Använd pdf-bild som kopieras från bilaga 4. Inga överliggande textfält finns.Figure 2. The lower size limit for wetlands used in the VMI. The Alpine zone (mauve) was not included.
Remote sensing
Remote sensing was essential for the primary selection of sites and for the pre-liminary classification of nature conservation values. At the start of the survey, black-and-white aerial photographs were used, and after about 1986, infrared (IR) aerial photographs were used. IR photographs contain more information, and made it possible to distinguish more wetland types. Most photographs were taken during the early 1980s, but newer photographs were also used to identify later impacts. In addition topographical, geological and, if available, vegetation maps were used for background information.
The site delimitation was determent by the border of wetland to either dry land or open water and was identified by remote sensing. Then the sites were divided into sub-sites and those were divided into elements. The area of each site and sub-site was calculated, and the type and degree of human impact, forest cover, wetness, and hydro-topography were determined (Figure 3). All data were recorded in the VMI database.
Figure 3. Two examples of sites surveyed in VMI. The upper left part shows a severely impacted class 4 sites that is not further divided into sub-sites. To the right, a class 1 site is divided into eight sub-sites. A detailed division of sub-site 7 into 6 elements are shown below, with vegetation types recorded during the field survey.
Figure 3.
Class 4 site
Class 1 site
Subsite 7
Elements (Field surveyed)
1. Muddbottom of rich fen typ 2. Soak rich Magnocariceta fen 3. Rich fen carpet
4. Intermedieta fen carpet 5. Rich spring fen
6. Mire margin: tree covered poor fen
Ditches
Subsites (wetland types)
1. Riverine marsh 2. Northern bog 3. String fen
4. Topogenous fen (forested) 5. Swamp forest
6. Soligenous fen 7. Topogenous fen (open) 8. Tarn
OBS! Använd pdf-bild som kopieras från bilaga 4 och kila in i lämplig skala under
överliggande textfält i denna ppt.
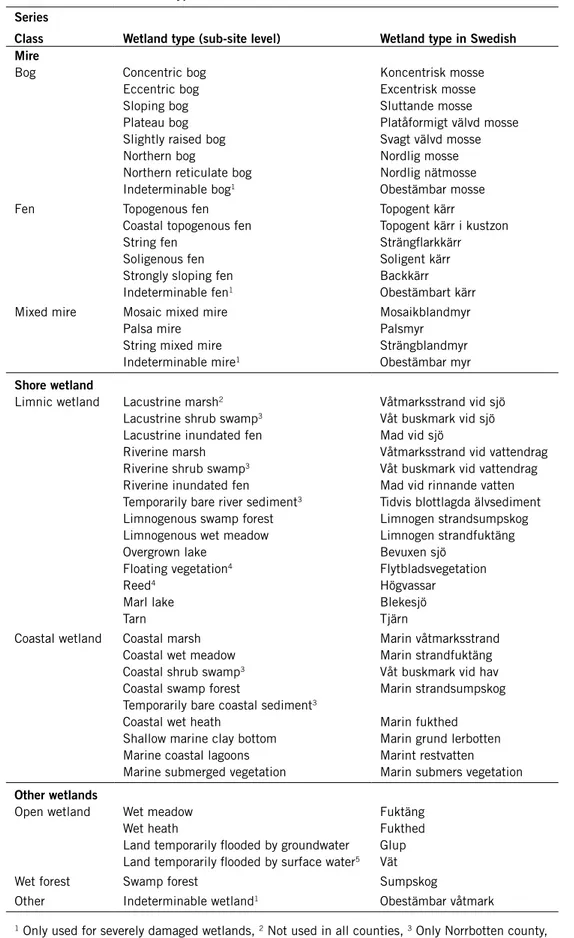
Table 1. division of wetland types used in the VmI. Series
class wetland type (sub-site level) wetland type in Swedish mire
Bog Concentric bog Koncentrisk mosse
Eccentric bog Excentrisk mosse
Sloping bog Sluttande mosse
Plateau bog Platåformigt välvd mosse Slightly raised bog Svagt välvd mosse
Northern bog Nordlig mosse
Northern reticulate bog Nordlig nätmosse Indeterminable bog1 Obestämbar mosse
Fen Topogenous fen Topogent kärr
Coastal topogenous fen Topogent kärr i kustzon
String fen Strängflarkkärr
Soligenous fen Soligent kärr
Strongly sloping fen Backkärr Indeterminable fen1 Obestämbart kärr Mixed mire Mosaic mixed mire Mosaikblandmyr
Palsa mire Palsmyr
String mixed mire Strängblandmyr Indeterminable mire1 Obestämbar myr
Shore wetland
Limnic wetland Lacustrine marsh2 Våtmarksstrand vid sjö Lacustrine shrub swamp3 Våt buskmark vid sjö Lacustrine inundated fen Mad vid sjö
Riverine marsh Våtmarksstrand vid vattendrag Riverine shrub swamp3 Våt buskmark vid vattendrag Riverine inundated fen Mad vid rinnande vatten Temporarily bare river sediment3 Tidvis blottlagda älvsediment Limnogenous swamp forest Limnogen strandsumpskog Limnogenous wet meadow Limnogen strandfuktäng
Overgrown lake Bevuxen sjö
Floating vegetation4 Flytbladsvegetation
Reed4 Högvassar
Marl lake Blekesjö
Tarn Tjärn
Coastal wetland Coastal marsh Marin våtmarksstrand Coastal wet meadow Marin strandfuktäng Coastal shrub swamp3 Våt buskmark vid hav Coastal swamp forest Marin strandsumpskog Temporarily bare coastal sediment3
Coastal wet heath Marin fukthed Shallow marine clay bottom Marin grund lerbotten Marine coastal lagoons Marint restvatten Marine submerged vegetation Marin submers vegetation
Other wetlands
Open wetland Wet meadow Fuktäng
Wet heath Fukthed
Land temporarily flooded by groundwater Glup Land temporarily flooded by surface water5 Vät
Wet forest Swamp forest Sumpskog
Step 2 – Preliminary conservation values
Nature conservation values were described in four classes based upon the crite-ria: representativity, size, intactness, diversity and rarity (Göransson et al. 1983, Löfroth 1997). The computer program PAN (Löfroth 1997) was used as a tool to rank all sites. The preliminary class of a site was based on a combination of the ranks from the five criteria. The proportional distribution of the number of sites in each class in every county was intended to be approximately: class 1 – the 10% highest ranked sites, class 2 – the next 20% highest ranked sites, class 3 together with class 4 –70% of the sites with lowest rank, where class 4 only included severely damaged sites. The final distribution of sites between classes may differ somewhat from the intended in areas with highly valuable wetlands.
Four classes of nature conservation value
Nature conservation value classes were used in the same way in the entire country, and have therefore become an established system for wetland classifi-cation in Sweden. The four nature conservation values classes are:
• Class 1 sites with very high values that are to a large extent untouched and need to be conserved for future generations.
• Class 2 sites with high values that are usually untouched. Impact on hydrology should be avoided.
• Class 3 includes sites with medium values and both untouched and more disturbed sites. Several of the class 3 sites are locally important sites. • Class 4 sites are destroyed by human impact and have little value. These
sites should mainly be chosen in case of exploitation.
Value criteria
Six criteria were used as a tool to rank the nature conservation value: representativity, size, intactness, variability, rarity and other criteria.
Representativity. In each one of the about 50 ecogeographic regions
(Nordiska Ministerrådet 1994), all wetland types that occur there today should to a comprehensive extent be conserved for the future, i.e. be repre-sented in the highest nature conservation class (class 1). The purpose is to preserve vivid populations of existing species, and a broad representation of occurring vegetation types, features and structures as well as the ecological and hydrological function of the wetland.
Size. Large sites are, for several reasons, of greater value than small sites.
A large site often has a greater variation in hydrology, topography and ecol-ogy, and can therefore offer a larger variety of habitats. Furthermore, large sites allow for larger populations, which also may be less vulnerable. Many species also need extensive areas to exist.
Intactness. Intact (untouched) wetlands have not been influenced
rion, and any impact caused by land uses such as mowing or grazing without fertilizing, is usually regarded as a positive impact.
Variability. A variable site has large variation in nature types, biotopes,
structures and ecotones, which is important for biodiversity. A high variety of hydro-morphological structures and number of wetland types, contributes to a high variability value.
Rarity. Occurrences of rare species or rare nature types contribute to a
high nature conservation value. Data on the commonness of a wetland type in a region were obtained by remote sensing (step 1). At species level, informa-tion was obtained from the literature or from the field survey (step 3).
Other criteria. Other aspects to be considered are, e.g., research,
educa-tional purposes or recreation. If research has been conducted in an area, it may contribute to the nature conservation values of the area. Finally, the value for recreational outdoor activities may also contribute to a site’s total nature conservation value.
Step 3 – Field survey and final classification
Sites preliminarily assigned to class 1 by remote sensing (step 1), were investi-gated in the field to verify the classification, to identify disturbances that had occurred after the aerial photographs were taken, and to document further information about the sites. Every site was photographed. Any new impacts or misinterpretations of aerial photographs were documented. Every sub-site was described as regards structures, the gradient from mud-bottoms to hummocks, tree cover, human impact, culture-historical traces, etc. At element level, veg-etation types were classified according to Nordiska ministerrådet (1994). The cover of the found plant species was also recorded. Afterwards the field data was added in the data base. Finally a comprehensive description was written for the site.
Data, quality assurance and publications
All collected data were electronically recorded and collected in a national database. Data entries were standardized (Löfroth 1992) and data quality was validated 1999–2003 and 2002–2007, when the database was administered by the Environmental Data Centre at the Swedish University of Agricultural Sciences. Aerial photographs, collected plants and animals and site photo-graphs are archived at the County Administrative Boards.
There are only a few counties that haven’t published parts or all the results from the survey. Some of those manuscripts are now digitalized and will soon be available on the internet. However, all counties were monitored and data have been entered into the database. The survey of some counties has been
The VMI wetland types
The classification system used for the VMI (Table 1) is based on the structure by Sjörs (1967), and is internationally accepted (e.g. Ruuhijärvi 1983, Botch & Masing 1983, National Wetlands Working Group 1988, Moen 1999). Owing to the development of remote sensing techniques, and to the addition of new survey areas with new wetland types, the classification system has developed successively.
Wetlands with vegetation that can accumulate peat are defined as mires. Other wetland types do not accumulate thick peat layers. Instead, they are either directly on mineral soil or in a form of limnic/marine environment. Wetlands that are not actively peat accumulating are divided into marshes and other wetlands. The wetland types are briefly described below.
MIRES
The classification of mires in VMI is based on their present appearance and ecology. The mire’s genesis is not reflected in the classification. For example are bogs classified by their present hydro morphology independently of the bogs origins from terrestrialisation, paludification or primary mire formation – the three different types of mire origin in Sweden. Wetlands may be devel-oping naturally along different successional pathways; however, this was not considered in the classification system.
Mires are divided into bogs, fens and mixed mires. They may be open or covered with forest. Forest-covered mires are classified as mires in the VMI, even if they are called swamp forests in other surveys. Swamp forests as a type is used only for wetlands without active peat accumulation (see Other wet-lands). However, where the forest canopy was closed, making it impossible to identify underlying vegetation on aerial photographs, completely forest-cov-ered fens may accidentally have been classified as swamp forests.
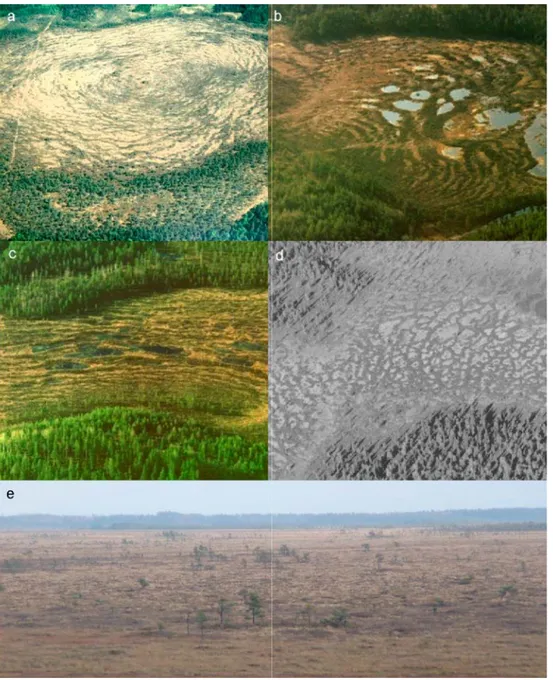
Bogs
Bogs receive water only from precipitation (ombrotrophic water), and are therefore extremely nutrient-poor. As a stressful environment, with a high groundwater table and low pH (usually below 4), bogs are species-poor eco-systems. Even if some bogs are distinctly raised, with the highest point at the centre, not all are markedly raised. The open, central bog surface often con-sists of smaller wet patches (hollows) and dryer parts (hummocks), which can form patterns of hummock strings. Raised bogs are divided into concen-tric bogs, eccenconcen-tric bogs, sloping bogs, plateau bogs and slightly raised bogs.
Concentric bogs are dome shaped and have the highest point at the centre.
They usually have a concentric pattern of strings. Eccentric bogs have their highest point is in the periphery, and their raised bog surface slopes in three directions. Sloping bogs are often not as markedly raised above their
sur-16
level central open surface, with distinctly sloping margins. Slightly raised bogs are only weakly raised or almost flat, often more or less wooded (e.g. pine bogs) and without marked patterns. Northern bogs are flat or slightly sloping, open or with trees (mainly pine). They are identified by the bog vegetation, but often have single occurrences of fen indicators, such as Carex pauciflora and Carex globularis. Additionally, they are often ‘shallow’, i.e. with only a thin peat layer. The transition to surrounding fens or mineral soil is often dif-fuse, because distinct lagg-fens are usually absent. Northern reticulate bogs are a variant of northern bog, in which the hummock strings form a markedly reticulate structure. The strings may be open or tree-covered, and the intervening areas usually consist of wet Sphagnum carpets without fen indicators.
Figure 4. Bog types: a. Concentric bog, b. Eccentric bog, c. Sloping bog, d. Northern reticulate bog, e. Plateau bog. Photos: a Hans-Gunnar Wallentinus, b, c Urban Gunnarsson, d Markus Forslund, e Saskia Sandring
Fens
Fens are always fed by water that has been in contact with mineral soil (min-erogenic water), with a higher mineral content than water from precipitation. In the VMI, three variants of fens were distinguished, according to the topog-raphy of the underlying ground surface: these range from strongly-sloping
fens, with a slope of at least 8%, via soligenous fens, with a slope of 3–8%,
to topogenous fens, which are mainly level, but which can have a slope of up to 3%. A fourth fen type, coastal topogenous fen has somewhat different vegetation, owing to the influence of marine deposits and water. For practical reasons, all fens 0–5 meters above sea level are included in this type. These four types mostly have an even fen carpet without any microtopographical structures. A fifth fen type string fens, are slightly or strongly sloping and have patterns consisting of strings and flarks, both with fen vegetation. The strings can be parallel or bow-shaped and give shape to flarks with carpets, mud-bottoms or open water.
Figure 5.
Figure 5. a. Weakly sloping soligenous fen, b. Topogenous fen, c. Strongly sloping fen, d. Palsa mire. Photos: a, b, c Urban Gunnarsson, d Sture Westerberg.
Mixed mires
Mixed mires contain both fen and bog features. They consist of bog struc-tures, usually hummock islands or strings, mixed with fen strucstruc-tures, fen lawns or flarks. String mixed mires are similar to string fens, but have higher hummocks with distinct bog vegetation. Strings are parallel or bow-shaped, or in some cases, reticulate. Mosaic mixed mires have both bog and fen veg-etation, but no marked structures. Bog elements are irregularly distributed on
conditions (low mean temperatures and little precipitation). Palsa mires are elongated mounds with a core of frozen peat. They are covered with bog veg-etation and surrounded by a mixture of elements of fen and/or bog vegveg-etation.
SHORE WETLANDS
Shore wetlands are found along the shores of lakes and rivers or along the coast. They are always influenced by, or dependent on, limnic or marine water. These types vary, owing to fluctuations in the water table and chemical com-ponents. The shore wetland series is divided into two classes. Limnic shores are found along lakes and watercourses with fresh water, and coastal shores along the coast, with salt or brackish sea water. Coastal shores are character-ized by salt resistant vegetation, which is missing on limnic shores. However, due to the low salt content of the brackish water in the Gulf of Bothnia, the difference in vegetation between coastal and limnic shores sometimes is lim-ited. Differences in the level and dynamics of the water table are the main basis for classifying both limnic and coastal shores, where wet meadows are only temporarily flooded and floating vegetation and marine submerged veg-etation is found in permanent water bodies.
A coastal or limnogenous wet meadow is that part of the shore which is above the mean groundwater table, but which is regularly flooded. The veg-etation consists mainly of moisture-preferring meadow plants, and peat is rarely accumulated. During floods, sediment (including mud) is accumulated, which is advantageous for productivity.
Several types of swamps were recorded in the VMI. A characteristic of
lim-nogenous and coastal swamp forests is regular flooding by fresh or salt water.
Trees have a continuous cover (more than 25% cover) and are taller than 3 m (if shorter, they are defined as shrubs). Swamp forests often lack a peat layer. However, tree-covered fens sometimes have a thick peat layer. Lacustrine,
riv-erine or coastal shrub swamps are also relatively common in the flooded shore
zone. They are not peat accumulating, and are covered by shrubs not more than 3 m tall. For methodological reasons, this type was only classified on a sub-site level in the northernmost county (Norrbotten).
A lacustrine, riverine or coastal inundated fen is wetter than a wet meadow, and is found mainly within the normal variation of the water table. These wet-lands are dominated by sedge and herb communities. Some peat accumulation can occur, but the peat is then usually mixed with alluvial sediments.
Reeds and water surfaces rich in vegetation are found on the part of the shore below the mean water table. Reeds are often dominated by Carex,
Schoenoplectus, Equisetum and Phragmites. During the winter, they are
mechanically affected by ice. Farther out, in the zone of floating vegetation, plants such as species of Nymphaeaceae and Potamogeton dominate. In early years of the survey, black-and-white aerial photographs were used, and the type
The type overgrown lake is used for all lakes that are overgrown, independent of the kind of vegetation. With IR-remote sensing, they could to some extent be divided into reeds or floating vegetation. The type overgrown lake was then used for mixed vegetation, or cases that were difficult to interpret. The pos-sibility to distinguish between reeds and floating vegetation, and to distinguish these from marsh vegetation (a mixture of herbs and graminoids), which is also common in meadow marshes, meant also a change in the use of the types
riverine marsh, lacustrine marsh, coastal marsh, riverine and lacustrine
inun-dated fens, which earlier included wetlands close to lakes, watercourses and the sea. Marine coastal lagoons are open water surfaces that are separate from the sea, but receive salt water during floods. Farther out, marine submerged
vegetation is found down to a depth of 10 m, with vegetation dominated by
e.g. Zostera marina.
Tarns are not a wetland type according to the VMI. They were still
sur-veyed if they were surrounded by more than 50% of mires. A tarn smaller than 1 ha, that is surrounded by mire, is described as an element pool
(Swedish: ‘göl’) within a sub-site. There is no upper size limit for a tarn in the VMI. Marl lakes sometimes develop on limestone with upwelling water that precipitates calcium carbonate when it comes to the surface. Often, rich-fen vegetation is found close to marl lakes.
Temporarily bare river sediments and temporarily bare coastal sediments
are vegetation-free sediment banks in rivers and at the sea. These types have only been used in Norrbotten County. Shallow marine clay bottoms are coastal areas below the mean water table, consisting of clay bottoms that are temporarily exposed at low water levels.
Coastal wetlands also include coastal wet heaths which, because they always occur within the coastal zone, are markedly influenced by salt water. Otherwise, wet heaths are considered as other wetlands.
OTHER WETLANDS
The series ‘Other wetlands’ includes moist and wet land that are neither mires nor shore wetlands. They usually do not accumulate peat.
Open moist to wet areas
Wet meadows are open wetlands without peat accumulation, found in
depres-sions in the terrain or in areas with surface groundwater. Wet meadows may have a sparse shrub or tree layer. These areas are mostly dependent on some kind of usage, such as haymaking or grazing by livestock. They occur most often within meadows and pastures, together with drier meadow types. They are common in the Alpine zone, which are not included in the VMI. Wet
heaths occur on poorer and coarser soils than wet meadows. Often, they form
a mosaic with other drier heath vegetation. The vegetation is often dominated by dwarf shrubs and sometimes has a thin peat layer.
There are two wetland types that have their origin caused by flooding during part of the year, by water that does not originate from lakes, watercourses or the sea. Both types are dry for much of the year. The two wetland types are distinguished by the origin of the water that usually causes the flooding.
Figure
6.
Figure 6. a. Coastal wet meadow, b. Riverine inundated fen , c. Coastal shrub swamp, d. Marine coastal lagoons, e. Lacustrine inundated fen, f. Limnogenous swamp forest, g. Marine submerged vegetation, h. Temporarily bare river sedimens, i. Reed. Photos: a Urban Gunnarsson,
be flooded by a combination of ground water and surface water. Land
tem-porarily flooded by surface water – (Swedish: ‘vätar’) occur mainly on the
islands of Öland and Gotland. Such areas are created in depressions in the terrain where the bedrock does not allow infiltration. They are filled by rain and snow melting water, which remains until it evaporates. Some areas may receive additional runoff water from surrounding land. The vegetation is often discontinuous, and sometimes there are patches of marl.
Tree-covered wetlands
This class includes only one type, swamp forests without peat accumulation and limnic or marine influence. See limnogenous and coastal swamp forests above for a definition of swamp forests.
INDETERMINABLE WETLAND TYPES
When totally impossible to determine to what type a specific wetland should be classified as, and this due to human impact, it has been accepted to classify the sub-site to one of the indeterminable wetland types. There are five such wetland types; indeterminable bog, indeterminable fen, indeterminable mire and indeterminable open other wetland and finally if it’s not possible to decide on any of these there is the wetland type indeterminable wetland.
Results
A selection of the most interesting statistics is presented at national level. The national final report (Gunnarsson & Löfroth 2009) and the county reports give more detailed data (for references to county reports, see the list at the end of this report).
Surveyed area
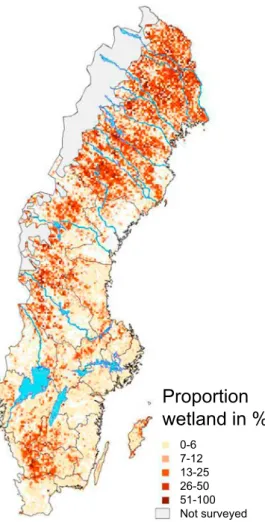
The VMI includes about 35, 000 sites, corresponding to a wetland area of 3.4 million hectares or 8% of the total area of Sweden. About 33 % of the surveyed area is situated in the northernmost county (Norrbotten) (Figure 7). In addition, 12% of the sites (4, 146 in total) were also surveyed in the field.
A comparison between the mire area surveyed by VMI and the Swedish database on land and vegetation cover (SMD) shows that VMI includes in total 54% of the total mire area, (“Open mire” and “Mires in forests”), estimated by the SMD. In total, SMD estimate the mire area to be 5.15 million hectares.
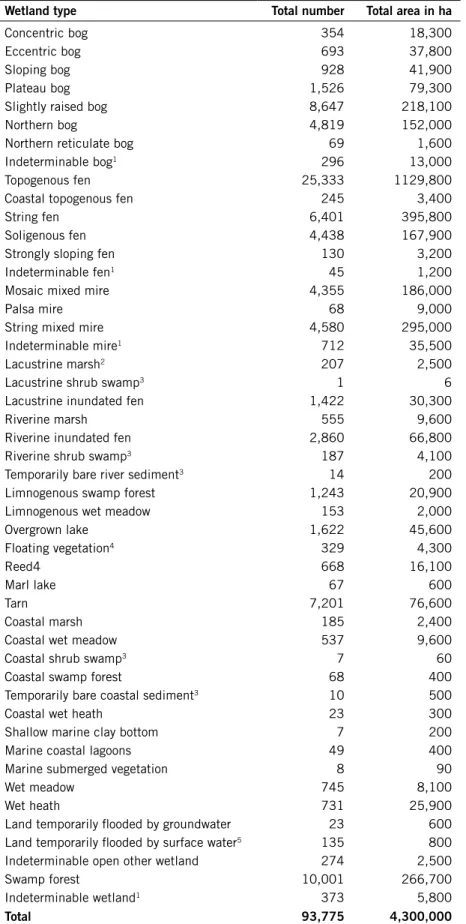
Wetlands types
The VMI shows that the most common wetland types (sub-sites) in numbers and area are topogenous fen, swamp forest, slightly raised bog, string fen and string mixed mire. See table 2 for the results for all types.
Figure 7.
Proportion
wetland in %
0-6 7-12 13-25 26-50 51-100 OBS! Använd pdf-bild som kopieras från bilaga 4 och kila in i lämplig skala underöverliggande textfält i denna ppt.
Table 2. The wetlands types (sub-sites) – the numbers and area surveyed by VmI.
wetland type Total number Total area in ha
Concentric bog 354 18,300
Eccentric bog 693 37,800
Sloping bog 928 41,900
Plateau bog 1,526 79,300
Slightly raised bog 8,647 218,100
Northern bog 4,819 152,000
Northern reticulate bog 69 1,600
Indeterminable bog1 296 13,000
Topogenous fen 25,333 1129,800
Coastal topogenous fen 245 3,400
String fen 6,401 395,800
Soligenous fen 4,438 167,900
Strongly sloping fen 130 3,200
Indeterminable fen1 45 1,200
Mosaic mixed mire 4,355 186,000
Palsa mire 68 9,000
String mixed mire 4,580 295,000
Indeterminable mire1 712 35,500
Lacustrine marsh2 207 2,500
Lacustrine shrub swamp3 1 6
Lacustrine inundated fen 1,422 30,300
Riverine marsh 555 9,600
Riverine inundated fen 2,860 66,800
Riverine shrub swamp3 187 4,100
Temporarily bare river sediment3 14 200
Limnogenous swamp forest 1,243 20,900
Limnogenous wet meadow 153 2,000
Overgrown lake 1,622 45,600 Floating vegetation4 329 4,300 Reed4 668 16,100 Marl lake 67 600 Tarn 7,201 76,600 Coastal marsh 185 2,400
Coastal wet meadow 537 9,600
Coastal shrub swamp3 7 60
Coastal swamp forest 68 400
Temporarily bare coastal sediment3 10 500
Coastal wet heath 23 300
Shallow marine clay bottom 7 200
Marine coastal lagoons 49 400
Marine submerged vegetation 8 90
Wet meadow 745 8,100
Wet heath 731 25,900
Land temporarily flooded by groundwater 23 600 Land temporarily flooded by surface water5 135 800 Indeterminable open other wetland 274 2,500
Swamp forest 10,001 266,700
Indeterminable wetland1 373 5,800
Distribution of wetlands in Sweden
The distribution of wetlands shows a marked regional pattern in Sweden. The two main factors that determine wetland distribution are long-term climatic conditions and human impact. Other important factors are topography and soil type.
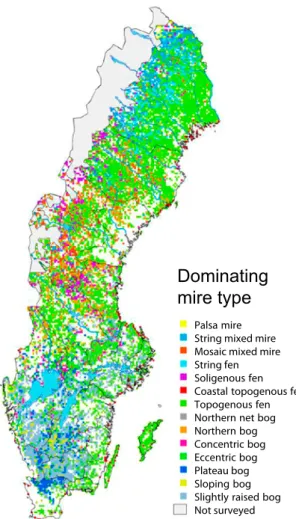
Wetlands in the south are dominated by bogs, and in the north, by fens and mixed mires (Figure 8). In south-eastern Sweden, many mire types are absent. Here, limnic and marine marshes, together with pine bogs and swamp forests, are most frequent. Palsa mires only exist in the far north. Next, there is a region of string mixed mires and string fens that dominate large areas in the Norrbotten County (Figure 9). Topogenous fens are the most common wetland type in Sweden, and dominate in the north. Soligenous fens mostly occur close to the Alpine zone. In southern Sweden, slightly raised bogs are the dominating wetland type, but other types of raised bog are also relatively common (Figure 9). Figure 8. Dominating wetland class Bog Fen Mixed mire Limnic wetland Coastal wetland Open wet land Swamp forest Other wetland Not surveyed OBS! Använd pdf-bild som kopieras från bilaga 4 och kila in i lämplig skala under
överliggande textfält i denna ppt.
Figure 8. Maps showing the dominating wetland Figure 9. Maps showing the dominating mire types
Dominating
mire type
Palsa mire String mixed mire Mosaic mixed mire String fen Soligenous fen Coastal topogenous fen Topogenous fen Northern net bog Northern bog Concentric bog Eccentric bog Plateau bog Sloping bog Slightly raised bog Not surveyed
Figure 9.
OBS! Använd pdf-bild som kopieras från bilaga 4 och kila in i lämplig skala underöverliggande textfält i denna ppt.
Mire regions
The division into mire regions is based on dominating mire type and on the distribution of particular mire types. We had a mainly Fennoscandic perspec-tive when designating the mire regions. We identified four regions outside the Alpine zone: the Palsa mire region, the Aapa mire region, the Raised bog
region and the Pine bog-marsh mire region. The Alpine zone is regarded as
a region on its own, the Mountain mire region. The Aapa mire region is divided into four sub-regions: northern, central, southern, and a soligenous Aapa mire region. It is important to point out that there are no sharp boundaries between regions; instead, the borders should be regarded as broad transition zones. The Swedish mire regions (Fig 10.) fit well with the boundaries drawn by the neighboring countries (e.g. Moen 1999, Ruuhijärvi 1988). The divi-sion into mire regions is quite different from the dividivi-sion into ecogeographi-cal regions (Nordiska ministerrådet 1994) and differs also from the division into vegetation zones (Sjörs 1999). This shows that the climatic bases for these divisions are not the same as the conditions for the occurrence of mires.
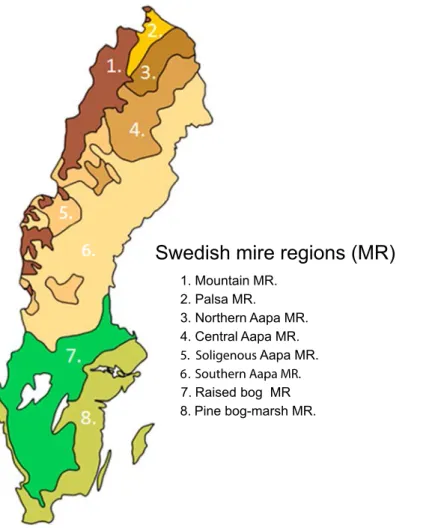
Figure 10. Division of Sweden into mire regions including sub-regions of the Aapa mire region.
Figure 10.
Swedish mire regions (MR)
1. Mountain MR. 2. Palsa MR. 3. Northern Aapa MR. 4. Central Aapa MR. 5. Soligenous Aapa MR. 6. Southern Aapa MR. . 7. Raised bog MR 8. Pine bog-marsh MR.THE MOUNTAIN MIRE REGION
This region was not surveyed, and can therefore not be described on the basis of data from this survey. Mountain mires often have a shallow peat layer (Moen 1999), and in some areas may be difficult to distinguish from heath and meadow vegetation.
THE PALSA MIRE REGION
The Palsa mire region is situated in the northernmost part of Sweden. It includes parts of the Alpine zone, which was not surveyed in the VMI, but where palsa mires occur and dominate (Länsstyrelsen i Norrbottens län 2004). Besides palsa mires, in this region string mixed mires, mosaic mixed mires and soligenous fens are also found. Precipitation is often sparse, leading to a thin snow cover in winter. Summer temperatures are low, and the growing season is very short (less than 110 days with temperatures above 5 °C; Tuhkanen 1980, Sjörs 1999).
THE AAPA MIRE REGION
This region is the largest mire region, and covers most of northern Sweden. The name aapa mire comes from Finnish mire terminology (Cajander 1913), and includes large mire complexes which always have a low central part of different fen types (Ruuhijärvi 1988). Relatively high humidity and a short growing season are typical of this region (Sjörs 1999, Tuhkanen 1980). We divided the Aapa mire region into four sub-regions: northern, central, south-ern, and a soligenous aapa mire region. The northern aapa mire
sub-region is found only in the Norrbotten County, east of the Palsa mire sub-region.
Typically, this sub-region is dominated by string mixed mires, where the strings become high and have pure bog vegetation. The strings are less regu-lar and can form reticulate patterns. Other common types are string fens and northern reticulate bogs. The central aapa mire sub-region is found south-east of the northern aapa mire sub-region. It is dominated by string fens, but topo-genous fens also cover large areas. Aapa mires are most typical in this sub-region. The flarks are regular and separated by low strings. The southern aapa
mire sub-region is the largest sub-region. Topogenous fens dominate in this
region, but bogs of northern type and mosaic mixed mires are also common. String mixed mires and string fens are not as common, but may occur in some areas. The soligenous aapa mire sub-region is characterized by very high pre-cipitation, and humidity is high, so that sloping or steeply sloping soligenous fens can occur. Soligenous fens dominate, but topogenous fens and string fens are also relatively common, in this sub-region.
THE RAISED BOG REGION
Large parts of south-western Sweden belong to this region, except a thin area along the west coast. The northern part of the region expands to the east to
Precipitation is relatively high in this region, and the growing season (daily mean above 5 °C) exceeds 170 days (Tuhkanen 1980). The eastern parts are a little less rich in precipitation, which is probably the reason why raised open bogs are less common towards the east, and more or less disappear closer to the Baltic coast.
THE PINE BOG-MARSH REGION
This region extends along a thin belt down along the west coast and continues to the north in a broader belt along the Baltic sea to northern Uppland, and includes the islands of Öland and Gotland. Mires are in general small in this region. Common mire types are pine bogs and topogenous fens. Annual pre-cipitation is often below 700 mm, and evaporation is high because of a high mean temperatures. This results in a water deficit in the region, particularly during the summer. Even the high human impact probably has had a negative effect on the occurrence of mires.
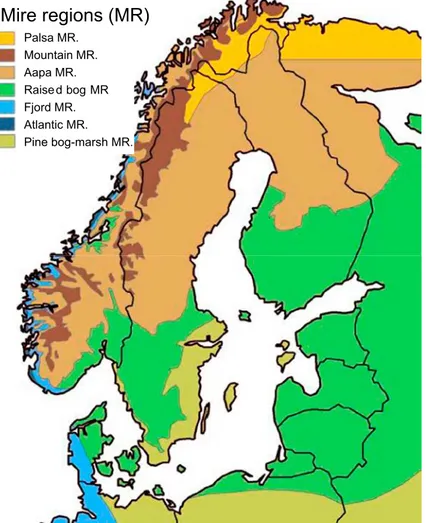
Figure 11. Right: Distribution of mire regions in the Baltic Sea region.. The mire regions in north-ern Europe are based on: Moen (1999) for Norway, Ruuhijärvi (1988) for Finland, Risager & Aaby
Palsa MR. Mountain MR. Aapa MR. Raised bog MR Fjord MR. Atlantic MR. Pine bog-marsh MR.
Figure 11.
Mire regions (MR)
OBS! Använd pdf-bild som kopieras från bilaga 4 och kila in i lämplig skala under
överliggande textfält i denna ppt.
Nature conservation value
All sites were classified into the four nature conservation value classes, as fol-lows: 3, 660 sites (11%) as class 1; 7, 773 sites (24%) as class 2; 16, 852 sites (51%) as class 3 and 4, 588 sites (14%) as class 4 (Figure 12). Large sites often had a higher rank and are thus often found in classes 1 or 2. Small sites were more often severely disturbed or damaged, which is why they make up a large proportion in class 4. Totally destroyed wetland sites are not part of the VMI, because they are not considered as wetlands in VMI, but totally destroyed sub-sites at a site that is not totally destroyed are included.
Degree of human impact
In the survey 89, 000 human impacts were registered in total at sub-site level. Only 20% of the wetland area (ca. 1 million ha) is entirely untouched. The proportion of untouched wetlands is highest in the sparsely populated areas close to the Alpine zone, and lowest in areas with a high population and a high proportion of agriculture (Figure 13).
Figure 12. Nature conservation value class Class 1 Class 2 Class 3 Class 4 OBS! Använd pdf-bild som kopieras från bilaga 4 och kila in i lämplig skala under överliggande textfält i denna ppt.
Figure 13.
Degree of
human impact
None Weak local Strong local Weak general Strong general Destroyed OBS! Använd pdf-bild som kopieras från bilaga 4 och kila in i lämplig skala underöverliggande textfält i denna ppt.
The degree of impact differs among wetland types (Figure 14). In general, bogs have a large proportion of human impact (often local), and limnic wetlands have a large proportion with general impact, compared to other wetland classes. Specifically, a large proportion of northern reticulate bogs, strongly sloping fens, marl lakes, tarns and wet heaths, was untouched.
Figure 14. Degree of human impact for the different wetland types, as a proportion of the total
Figure
14.
Concentric bog Eccentric bog Sloping bog Plateau bog Slightly raised bog Northern bog Northern reticulate bog Topogenous fen Coastal topogenous fen String fen Soligenous fen Strongly-sloping fen Mosaic mixed mire Palsa mire String mixed mire Lacustrine marsh Lacustrine inundated fen Riverine marsh Riverine inundated fen Riverine shrub swamp Temporilarly bare river sediments Limnogeous swamp forest Limnogeous wet meadow Overgrown lake Reed Marl lake Tarn Coastal marsh Coastal wet meadow Coastal shrub swamp Coastal swamp forest Temporilarly bare coastal sediments Coastal wet heath Shallow marine clay bottom Marine submerged vegetation Wet meadow Wet heath Land temporarily flooded by groundwater Land temporarily flooded by surface water Swamp forest
Degree of impact None
Proportion 0,0 0,2 0,4 0,6 0,8 1,0
Weal
local Strong local Weakgeneeral Strong genereal
OBS!
Fullt med överliggande textfä
lt och vita döljfält etc. Inga
delar av
Drainage is the commonest and most severe impact on wetlands (40%), followed by logging (22%) and roads (17%, Figure 15). Logging rarely has a strong impact and roads usually have a local impact. Electric power trans-mission lines are the fourth commonest type of impact (6%).
Figure 15. The proportion of the different human impact types in the total number of human impacts (in total, 89, 000 impacts were recorded).
Drainage Logging Roads Power lines Other impacts
Winter roads and vehicle tracks Peat cutting
Water table regulations Buildings
Farming
Evaluation of the VMI
Has the VMI attained its objectives?
The original objective of expanding knowledge about wetlands in Sweden, their status and values (Statens Naturvårdsverk 1980), has largely been attained. Reports from the County Administrative Boards and the internet homepage have made the information publicly available. The VMI has suc-ceeded well in quantifying nature conservation values and human impact on wetlands. The results have led to a better and more secure treatment of wet-land matters by the authorities, and a better protection strategy of wetwet-lands in Sweden (e.g. Naturvårdsverket 2007).
In general, the quality of remote sensing of all sites (step 1) is good. The remote sensing technique used in VMI was developed within the project, and all staff involved in the remote-sensing component and field work were trained within VMI. The sites that were surveyed in the field (most nature conservation value class 1 sites and some class 2 sites) have a better accuracy than the others.
The VMI is a valuable base for the work of municipality and County Administrative Boards. It is one of the most frequently used surveys in e.g. land use planning. It is also valuable for national statistics of wetlands. The classifi-cation according to nature conservation values in VMI is also of major impor-tance to the choice of sites included in the mire protection plan of Sweden and its revised version (Lonnstad & Löfroth 1994, Naturvårdsverket 2007).
Strengths and weaknesses of the VMI
The VMI was conducted during a 25-year period; during that time, techniques developed further. The main methodology, i.e. interpretation of aerial photo-graphs, classification of wetland types and nature conservation value and field surveys, worked well. Even though the introduction of infrared images made the interpretation of vegetation easier, the quality of the aerial images was similar throughout. Today, all images are digital, which permits direct digital interpretation.
The common methodology, applied in all counties, is strength of the study. This allows a common judgement to be made of wetlands throughout Sweden. The classification of nature conservation values was especially important. The simple classification in four steps provided an easy and intuitive system. The VMI s focused from the start on recording human impacts on wetlands. This will be useful for future monitoring surveys of changes in human impact.
Weaknesses are that the remote sensing method makes it difficult to find all wet forests. The size-limit means that many small wetland of high conser-vation value were not surveyed. As a result wetland and vegetation types that
The latter is partly addressed by a rich fen survey; however, data on other types of small, valuable wetland (e.g. swamp forests, mires and marshes) will still be missing. The Alpine zone was not surveyed, and consequently there is a lack of knowledge about it. A further weakness is the paucity of knowledge about invertebrates in wetlands, which were surveyed only sporadically in VMI.
Future development
Presently a uniform and comprehensive survey is of importance. The ongoing survey of rich fens is a step in that direction. A repeated survey of hydrologi-cal disturbance, carried out with VMI-methodology, would be a simple way of studying the long-term development of wetlands and human impact on them.
Furthermore, there is a need to survey the Alpine zone. Data are needed about wetland types, areas, cultural remnants and nature conservation values. Disturbance has increased in alpine areas during the past 50 years, through the rapid development of tourism and the increased use of cross-country vehi-cles. Climate change will also have a large impact on alpine and sub-arctic wetlands, e.g. palsa mires are totally dependent on climatic conditions.
At present a satellite based method to survey all open mires for changes in the vegetation has started as an operational national survey. This method will detect new human impacts on wetlands that will be reflected in the vegetation. This method will be a complement to VMI and will cover the entire country in 2017.
There is an on-going project to digitalize all the reports so that they will become available on the internet. The sites have been digitalized and there is a wish to be able to digitalize the sub-sites and the impacts as well, if funds become available.
Conclusions
In a European perspective, Sweden has a very large responsibility for the con-servation and administration of the large and relatively intact wetland area. The VMI gives a good overview of Swedish wetlands outside the Alpine zone and the results show a high diversity of both species and ecosystems.
The VMI has been successful in many ways, but knowledge is still lacking about the wetlands of the Alpine zone, and about small, valuable wetlands. There is still room for a further use and development of the VMI-methodology.
Previously published VMI-reports
Original County Report
Stockholm county Länsstyrelsen i Stockholms län (1997) Uppsala county Länsstyrelsen Uppsala län (1986) Östergötland county Schröder (1994 a, b)
Jönköping county Länsstyrelsen i Jönköpings län (1994 a, b, c, 1995 a, b, 1996, 1997, 1998)
Kronoberg county Länsstyrelsen i Kronobergs län (1987) Kalmar county Hellman (1984); Hylander (1993) Gotland county Martinsson (1997)
Blekinge county Franzén (1993) Kristianstad county Johansson (1989) Malmöhus county Lindup (1994)
Halland county Forslund & Rundlöf (1984); Larsson & Liliegren (1998)
Göteborg och Bohus county Hallingbäck, Uddén & Åhlund (1983) Älvsborg county Martinsson (1993)
Skaraborg county Länsstyrelsen i Skaraborgs län (1991) Örebro county Länsstyrelsen i Örebro län (1998 a, b)
Västmanland county Lennartsson & Pettersson (1988); Gladh (1988) Dalarna county Rafstedt & Bratt (1990)
Gävleborg county Länsstyrelsen i Gävleborgs län (2001) Västernorrland county Grundström & Uppsäll (1994) Jämtland county Länsstyrelsen i Jämtlands län (2002) Västerbotten county Forslund, Forslund & Löfroth (1993) Norrbotten county Länsstyrelsen i Norrbottens län (2004)
Unpublished County Report
Södermanland county
No county report
Värmlands län
Updated County Report
Jönköping county Liliegren (1998)
Halland county Larsson & Liliegren (1998)
Unpublished Updated County Report
References
Botch, M.S. & Masing, V.V. 1983. Mire ecosystems of the U.S.S.R. I: Ecosystems of the World. 4B. Mires. swamp, bog, fen and moor. Regional studies (ed. Gore, A.J.P.), pp. 95-152. Elsevier, Amsterdam.
Cajander, A.K. 1913. Studien über die Moore Finlands. Acta Forestalia Fennica 2: 1-208.
Gladh, L. 1988. Våtmarksinventeringen i Västmanlands län, södra delen. Länsstyrelsen i Västmanlands län, miljövårdsenheten 1988(13): 1-12.
Grundström, S. & Uppsäll, S. 1994. Skyddsvärda våtmarker i Västernorrlands län. Länsstyrelsen i Västernorrlands län publikation 1994(2): 1-400.
Gunnarsson, U. & Löfroth, M. 2009. Våtmarksinventeringen – resultat från 25 års inventeringar. Nationell slutrapport för våtmarksinventeringen (VMI) i Sverige. Naturvårdsverket Rapport 5925: 1-119.
Göransson, G., Hellman, K., Johannson, C.E., Löfroth, M., Månsson, M. & Ots, T. 1983. Inventering av Sveriges våtmarker (VMI). Metodik för våtmark-sinventering. Statens naturvårdsverk, SNV PM 1680: 1-77.
Hallingbäck, T., Uddén, J., Åhlund, M. 1983. Skyddsvärda myrar i Göteborgs o Bohus län. Naturinventeringar i Göteborgs och Bohus län 1983(4): 1-80. Hellman, K. 1984. Våtmarksinventeringen inom fastlandsdelen av Kalmar län. Del 1. Allmän beskrivning och katalog över särskilt värdefulla objekt. Naturvårdsverkets rapport SVN PM 1787: 1-46
Hylander, K. 1993. Våtmarksinventering av Öland 1993. Länsstyrelsen i Kalmar län informerar 1994(3): 1-211
Forslund, M., Forslund, S.R. & Löfroth, M. 1993. Våtmarker i Västerbottens län. Länsstyrelsen i Västerbottens län, meddelande 1993(1): 1-146.
Forslund, M. & Rundlöf, S. 1984. Inventering av våtmarker i Hallands län. Länsstyrelsen i Hallands län, meddelande 1985(1): 1-277.
Franzén, L. 1993. Våtmarker i Blekinge. Länsstyrelsen i Blekinge, Karlskrona. Johansson, A. 1989. Våtmarker i Kristianstads län, del 1. Länsstyrelsen i Kristianstads län, Kristianstad.
Larsson, M. & Liliegren, Y. 1998. Uppdatering av våtmarksinventeringen i Hallands län 1994–1995. Länsstyrelsen i Hallands län, meddelande 1998(1): 1-30.
Liliegren, Y. 1998. Uppdatering av våtmarksinventeringen i Jönköpings län 1998 – en uppdatering med avseende på ingrepp. Länsstyrelsen i Jönköpings län meddelande 1998(29): 1-21.
Lindup, B. 1994. Våtmarksinventeringen i Malmöhus län. Länsstyrelsen i Malmöhus län, miljövårdsenheten, meddelande 1993(4): 1-70.
Lonnstad, J. & Löfroth, M. 1994. Myrskyddsplan för Sverige. Naturvårdsverket, Solna. 30
Länsstyrelsen i Gävleborgs län. 2001. Våtmarksinventeringen i Gävleborg. Länsstyrelsen Gävleborg, rapport 2001(7): 1-191.
Länsstyrelsen i Jämtlands län 2002. Våtmarker i Jämtlands län, del 1 – allmän del. Natur i Jämtland 2002(2): 1-85.
Länsstyrelsen i Jönköpings län. 1994a. Våtmarker i Vetlanda kommun. Meddelande 1994(10).
Länsstyrelsen i Jönköpings län. 1994b. Våtmarker i Eksjö kommun. Meddelande 1994(4).
Länsstyrelsen i Jönköpings län. 1994c. Våtmarker i Sävsjö kommun. Meddelande 1994(14).
Länsstyrelsen i Jönköpings län. 1995a. Våtmarker i Aneby och Tranås kommuner. Meddelande 1995(6).
Länsstyrelsen i Jönköpings län. 1995b. Våtmarker i Nässjö kommun. Meddelande 1995(6).
Länsstyrelsen i Jönköpings län. 1996. Våtmarker i Jönköpings kommun. Meddelande 1996(18).
Länsstyrelsen i Jönköpings län. 1997. Våtmarker i Vaggeryds kommun. Meddelande 1997(41).
Länsstyrelsen i Jönköpings län. 1998. Våtmarker i Värnamo kommun. Meddelande 1998(2).
Länsstyrelsen i Kronobergs län. 1987. Våtmarker i Kronobergs län. D. 1, Huvudrapport. Naturvårdsenheten, Länsstyrelsen i Kronobergs län, Växjö. Länsstyrelsen i Norrbottens län 2004, Våtmarker i Norrbottens län. Länsstyrelsen i Norrbottens län rapportserie 2004(6): 1-217.
Länsstyrelsen i Skaraborgs län. 1991. Våtmarker i Skaraborgs län, del 1. Länsstyrelsen i Skaraborgs län, meddelande 91(2): 1-506.
Länsstyrelsen i Stockholms län. 1997. Våtmarksinventering i Stockholms län. Länsstyrelsens U-serie U 1997(1): 1-268.
Länsstyrelsen Uppsala län. 1986. Inventering av våtmarker i Uppsala län. 1, Rapport och bearbetningar. Meddelanden från Planeringsavdelningen, Länsstyrelsen, Uppsala län 1986: 1-220.
Länsstyrelsen i Örebro län. 1998a. Våtmarker i Örebro län. Södra delen. Länsstyrelsen i Örebro län, publikation 1998(9): 1-243.
Länsstyrelsen i Örebro län. 1998b. Våtmarker i Örebro län. Norra delen. Länsstyrelsen i Örebro län, publikation 1998(9): 1-243.
Löfroth, M. 1991. Våtmarkerna och deras betydelse. Naturvårdsverket Rapport 3824: 1-93.
Löfroth, M. 1992. VMI blankettinstruktion. Statens naturvårdsverk, stencil. Löfroth, M 1997. Poängsättning Av Naturvärde (PAN). Statens naturvårds-verk, stencil.
Martinsson, M. 1997. Våtmarker på Gotland, del 1. Länsstyrelsen i Gotlands län, livsmiljöenheten – rapport 1997(8): 1-286.
Martinsson, P.-O. 1993. Våtmarker i Älvsborgs län. Länsstyrelsen i Älvsborgs län, rapport 1993(6): 1-350. 31
Moen A. 1999. National Atlas of Norway. Norwegian Mapping Authority, Hönefoss.
Naturvårdsverket. 2007. Myrskyddsplan för Sverige. Huvudrapport over revideringen 2006. Naturvårdsverket Rapport 5667: 1-64.
National Wetlands Working Group. 1988. Wetlands of Canada. Environment Canada, Ottawa.
Nordiska Ministerrådet. 1994. Vegetationstyper i Norden. Tema Nord 1994(665): 1-627.
Raeymaekers, G. 2000. Conserving mires in the European union. European Commission Nature Conservation Unit, Luxemburg.
Rafstedt, T. & Bratt, L. 1990. Våtmarker i Kopparbergs län. Länsstyrelsen i Kopparbergs län, miljövårdsenheten N 1990(2): 1-561.
Ruuhijärvi, R. 1988. Myrvegetation. Atlas över Finland 141: 1-5.
Schröder, J. 1994a. Våtmarker i Östergötlands län 1993–1994. Boxholms, Kinda, Linköpings, Mjölby, Söderköpings, Vadstena, Valdemarsviks, Åtvidabergs, Ydre och Ödeshögs kommuner. Miljövårdsenheten, Länsstyrelsen i Östergötlands län, Linköping.
Schröder, J. 1994b. Våtmarker i Östergötlands län 1993–1994. Finspångs, Motala och Norrköpings kommuner. Miljövårdsenheten, Länsstyrelsen i
Sjörs, H. 1967. Nordisk växtgeografi. 2:a upplagan. Scandinavian University Books, Stockholm.
Sjörs, H. 1999. The background: geology, climate and zonation. Acta Phytogeographica Suecica 84: 5-14.
Statens naturvårdsverk. 1980. Sveriges våtmarker – anspråkskartering. SNV PM 1364.
Tuhkanen, S. 1980. Climatic parameters and indices in plant geography. Acta Phytogeographica Suecica 67: 1-105.
Wetland Survey
Compiled Excerpts From The National Final Report
iSSN 0282-7298
Sweden has the highest variation in wetland types within the EU. A fifth of the country’s land area is covered by wetlands, and after Russia, it has the largest wetland area in Europe.
The Swedish Wetland Survey (VMI) took place between 1981 and 2004. The survey covered all large wetland sites except from the ones in the alpine zone. About 35,000 wetland sites were surveyed with a com-mon methodology. All sites were surveyed by aerial photographs and about 12 % of the sites were also surveyed in the field. The survey covers 3.4 million hectares or approximately 8 % of Sweden’s land area.
The purpose of this report is to make information about the wetland survey available outside of Sweden. The report is a compilation of excerpts from the national final report. It focuses on VMI-methodology, Swedish wetland types, and the results and the final evaluation of the survey.
The Swedish Wetland Survey
Compiled Excerpts From The National Final Report
URbaN GUNNaRSSON aND MiChaEl lÖFROTh