STATENS VAG- OCH TRAFIKINSTITUT _
The National Swedish Road and Traffic Research InstituteSTUDIES OF PAVEMENT WEAR CAUSED BY STUDDED PASSENGER
CAR TYRES ON STRAIGHT TEST TRACKS, THE BROMMA TRACK
by!
y
_ r
_
.
O. Andersson and B. Lilja,
REPORT Nr 3A
STATENS VAG- OCH TRAFIKINSTITUT
TheNational Swedish Road and Traffic Research Institute
STUDIES OF PAVEMENT WEAR CAUSED BY STUDDED PASSENGER
CAR TYRES ON STRAIGHT TEST TRACKS, THE BROMMA TRACK
by
O. Andersson and B. Lilja
REPORT Nr 3A
TABLE OF CONTENTS
SUMMARY Page 1
INTRODUCTION " 1
THE TEST TRACK. " 2 TEST TRACK TRAFFIC " 3 WEAR MEASUFEPOENT " 5
Geometric Egggiling " 5
Badiometgig profiling 6
RESULTS w " 7 V
PORTLAND CEMENT CONCRETE " 11
CONCLUSIONS " 11
Tables and figures " 12*25
mmwmm "%
STUDIES OF PAVEMENT WEAR CAUSED BY STUDDED PASSENGER CAR TYRES 0N STRAIGHT TEST TRACKS. THE "BROMMA TRACK".
SUMMARY
A test track composed of eight straight test sections with different wearing courses was built on the domestic airport of Stockholm (Bromr ma Airport) during the autumn of 1968, and it was trafficked by an
autOpiloted vehicle provided with four studded tyres. The purpose was,
to determine the wear of different pavements caused by studded tyres under realistic conditions and to establish the relation between such
wear and the wear measured in similar experiments in the road machine of the Road Research Institute. The tests were carried out during two winters, comprising in all 100,000 circuits. The wear was measured by geometric profiling,and on the same time a method based upon the mea-surement of radioactive radiation absorption was tried.
The results showed the same ranking of the different pavements with respect to wear on the Bromma test track as in the road machine. They also showed that the wear resistance is favoured by enrichment of large aggregate, especially in the surface, of the wearing course, by increased binder hardness and by tar precoating of the aggregate at high temperature. The manufacture of wearing courses including
rolled-in
coated chippings has some critical stages which can easily make
the addition of the chippings useless. One small sample from an old Portland cement concrete pavement was also included and showed come paratively little wear.
INTRODUCTION
The investigations of pavement wear due to studded tyres carried out by the Swedish Road Research Institute were initially limited to the test road machine of the institute (traffic simulator). There are, however, certain important differences between the traffic in this machine and regular traffic on roads. But simulation of the regular traffic ought to be obtained by running vehicles on a test track whaving pavements built in the conventional way. Such experiments have been reported for instance by wehner (1) in 1964 and by many VTI Report Mr 3 A.
other authors. During 1967-68 a test track to be built on the domestic airport of Stockholm (Bromma Airport) was planned by the Road Research Institute, and the track was meant to be trafficked by an autopiloted vehicle. In this way it was also possible to obtain an important comr parison between wear in the road machine and wear under realistic conditions. The test track in the road machine is circular and its
diametre only 5 metres. Running occurs at constant speed and without
lateral forces in the contact area between wheel and pavement surface. The climate is for practical purposes maintained constant. The wearing
courses are laid on an unrealistic base by hand and packed by means
of a plate vibrator.
By curtesey of the Swedish Board of Civil Aviation a closed
run-away (runrun-away 09) on Bromma.Airport was opened for the experiment,
which was sponsored mainly by the Swedish Road Administration and the City of Stockholm. The wearing courses were composed in cooperation
with these authoroties.
THE TEST TRACK
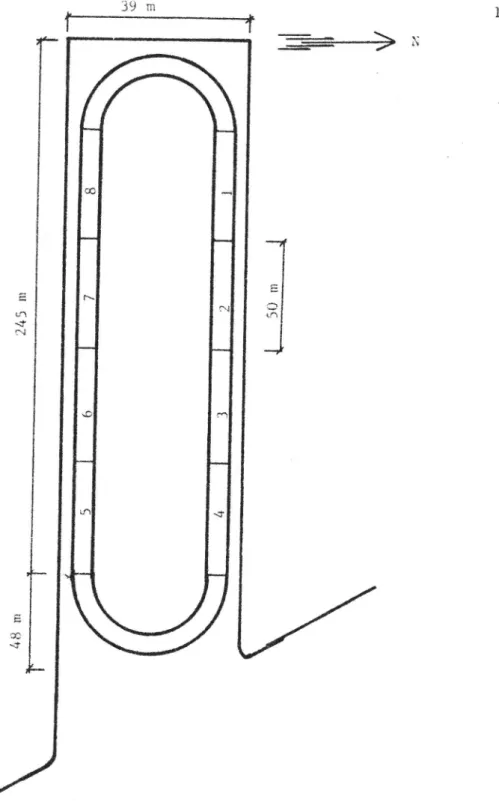
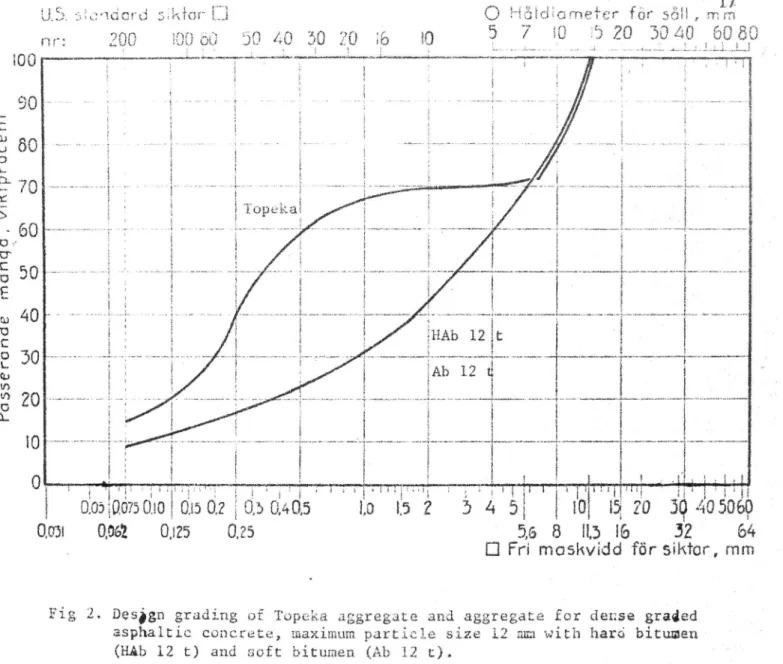
The test track had two parallell straight sections, each 200 metres of length, which were connected by semicircular tracks, radius of curvature 18 metres, figure 1. On each straight section four diffe-rent wearing courses were laid, each 50 metres of length. wearing courses were also laid in the curves but these were not included in the experiment. The wearing courses, which were laid in the autumn of 1968, are described in table 1 and figure 2. The results of an
analysis of samples from the asphaltic mixtures and aggregates are
given in table 2 and figure 3 and 4. During the experiment a 1 x 1
metre cement concrete slab, sampled from a- 15 years old pavement on E4 near the northern exit of Stockholm was introduced. Soon after
the beginning of the experiment it was obvious that the wear of sec-tions four and five was extremely uneven. These secsec-tions contained rolled-in coated chippings, and the chippings were at many places
unadequately fixed to the base. Individual stones could easily be removed by means of a hard tool. These sections were therefore
over-laid during the summer of 1969 and were replaced by new pavements
according to the specifications in table 3. The results of an analysis of the mixtures and aggregates are given in table 4 and figure 6. The pavements of the test track were laid on a rerulating Course U?On the original surfaCe of runaway 09. This pavement was composed of a wearing course of asphaltic concrete laid on a Macadam roadbase. The subsoil is a fine grained clay layer whose thickness varies from the eastern
end of the track where it is the largest to the western end closest to the
edge of the airfield where the soil layer is quite shallow. Determination of the plate bearing value wasdone in June 1971 at the centre of each test section. The result is given in figure 1 as k-values, that is specific surface load divided by deflection. The bearing capacity of the structure falls within the normal range for conventionally built roads, but varies considerably within the area of the test track. It should, however, be pointed out that during the greater part of the experiment the base was frozen.
TEST TRACK TRAFFIC
The track was trafficked by an autopiloted car, Volvo Duett, provided
with studded passenger car tyres on all four wheels. The runs were made during two winter seasons, January-April 1969 and December 1969-April 1970. Each season comprised 50,000 circuits. Wear measurements
were made every 12,500 circuit. It was intended to use the same tyres.
and studs as were used in the road machine runs. This could be realized
only during the first season. At the start of the second season the tyre types used were no longer to be found on the market. The closest
similar type of tyre had to be used. The vehicle characteristics during the two seasons of running are shown in table 5.
The system used for autopiloting of the vehicle was developed by the
mechanical department of the Road Research Institute and was partly
based on systems used in conjunction with experiments on autopiloted traffic made in other countries, "the electronic road" (2). The system worked in the following way. The steering wheel was operated by a servo motor, whose control signals came from two antenna coils on the front bumper of the vehicle. These coils were during the runs influenced by a magnetic field, generated by the current in a cable
(0.4 A, 5 kHz) located in a groove under the track surface. The signals
induced in the two coils were subtracted, and when the point halfway
between two coils was vertically above the cable the resulting control signal was zero, whereas a displacement of this point with respect to the cable, lead to control signals which caused the steering wheel to guide the vehicle back to zero control signal.
The throttle of the engine was controlled by an electric motor. The
throttle could be brought to increase or decrease at a constant rate,
or stay unchanged. By means of loops in the track the throttle was
controlled so that the vehicle accelerated during the first half of each straight part of the track and retarded during the second half and was running at constant speed in the curves. The velocity in the
curves was 15-20 km/h and at the midpoint of the straight sections 35-40 km/h. The acceleration was slightly different when running
east-wards from running westeast-wards due to the inclination of the runaway towards the centre of the airfield. The tangential force between the wheel and the road surface was, however, most probably uninfluenced by this inclination.
The motion pattern was checked on two occasions by recording the speed on,a plotter, which gave the relation between speed and time around the loop. The relation between acceleration and displacement calculated from this curve showed that the acceleration was essentially zero in the curves and varied en-the straight parts mainly in the interval 0.5-1 m/s2 or 0.05-0.1 g. The values of acceleration calculated appear-ed to vary rather at random and quite considerably, and therefore an estimate of the average is quite uncertain, but a reasonable average for the straight sections is 0.05 g or 0.5 m/s2 both acceleration and retardation. The slight influence of the slope of the track could be seen in the calculated values. The acceleration 0.05 g corresponds to
a friction coefficient of 0.05,which is much smaller than is
experien-ced on ice. This friction force can be neglected in comparison with
forces which occur on acceleration from rest and during braking in
real traffic. In other words the runs on the test track can be consi-dered as constant speed runs when considering the forces acting in
the contact area between the wheel and the road surface. The vehicle
ran counter clockwise in the loop throughout the test.
In order to avoid hazards which could fiercly disturb the traffic on the airport very rigorous safety measures had been taken. Thus the ignition was interrupted and the vehicle was braked at electrical power failure or if the vehicle deviated more than one metre from its average position relative to the steering cable. The loop was surround-ed by a wall of straw bales anchorsurround-ed to a fixsurround-ed steel wire through the centre of the bales. The vehicle could therefore run 24 hours per day without supervision. It was stopped once per day for fuelling. An extra fuel tank had been provided for this purpose. The track was cleared from snow and ice continuously by brushing and bkardx Iugby'means of urea. This was done when considered necessary by ocular inspection. The track did in this way stay moist exCept during long periods of no precipitation and low temperature.
WEAR MEASUREMENT
Two methods for measurement of wear were tried, geometric profiling and radiometric absorption measurement.'The latterzmethod was included because it was independent of the influence of frost heave.
Geometric profiling
Profiling was first done by using a 4.8 m straight edge resting on
references whose lower ends had been driven down to 5 cm depth at the
edges of the track. It was considered that the references should then follow the frost heave, which was expected to be considerable due to the su boil naterial. Variations in frost heave from point to point along the profile could, however, not be compensated for in this way. Profiling after a month of running showed considerable and rather irregular profile changes, which were considered a result of uneven frost heave. The wear which had occurred, appeared to the eye as an irregularity superimposed upon the profile change measured. Since,
however, the wheel track was quite narrow, only a few decimetres,
and the frost heave profile was of rather long wave length it was considered possible to get an acceptable wear profile by using
ferences immediately at the edges of the wheel track and to make a large
number of profile measurements right across the wheel track only. By determination of several such profiles on each test section a statis-tical smoothing of the irregular frost heave could be achieved.
In this way ten profiles on each test section were measured,the pro-file width across the wheeltrack being 40 cm and depth measurements being taken at 25 mm interval. . Two types of references were tested, nails driven into the road surface to such a depth that the nail head
rested on the road surface, and metal cylinders which were driven down
to such a depth that the upper end was flush with the road surface, the bottom of the cylinders serving as reference levels. For profile
measurement a dial indicator was used, and an L-shaped reference beam,
50 cm of length. The cross bar of the L-shaped beam.was used for keep-ing the dial indicator vertical. Two types of such profilometers were
tested (figure 7), one of them had holes at each point of measurement
for guiding the dial indicator rod whereas the other had 15 dial in-dicators mounted in fixed positions. The 25 mm interval allowed in the
latter case only the use of rather small diametre indicators, and
their range was only three mm. The former alternative was therefore
used to a larger extent, although it was more tedious. Since it could be suspected, that the nails moved or the nail heads were worn by the test vehicle, the cylinder alternative for references was tried. A
comparison between measurements using the two methods gave, however,
no differences in the profiles. On the other hand on several occasions nails had been sheared off, probably by snow removal vehicles.
For occasional sampling of a more detailed profile a motor driven pro-filometer7designed by the Road Research Institute for rugocity
measure-ment35was used. Its use was, h0wever, too time consuming for routine measurements. A profile recorded by means of this profilometer is shown
in figure 8.
Radiometric profiling
Radiometric profiling was meant to be carried out by determination of the radiation intensity from radioactive preparations located at a pro-per depth under the road surface. Point shaped and filament shaped VTI Report Nr 3 A.
radiating sources were contemplated, but it was decided that in the latter case the' profile could not be uniquely determined without very strict collimation. Point sources were therefore used.
When a radiation detector is placed on the road surface after wear an increasing intensity is registered due to two effects, wear of material and decrease in distance between preparation and detector. The latter effect is, however, neglected in comparison with the former if the specific absorption is high enough. Since the individual pre-parations must be placed at a minimum of 3 metres distance from each other in order not to disturb one another during measurement, they must be laid down at a considerable longitudigal displacement. The la-teral displacement was made 5 cm in the wheel track and 10 cm off the
wheel track. The measurements were made only at one wheel track. The
profile measured in this way was due to the longitudinal displacement rather a diagonal than a cross profile. Since the vehicle could not be brought to run along an ideal straight line this longitudinal dis-placement caused great potential error in the wear profile.
The measurements were made by AB Isotopteknik using the isotope Ir 192. It should be pointed out that the safety precautions prescribed for the use of radioactive preparations are extremely rigorous, e.g. the area has to be closed to the public. The use of the method on regular roads is therefore not practicable in Sweden. The radiation on the road is completely harmless, but there is always a risk that the prepa rations can be dug up and then be disastrous.
RESULTS
The wear profile was evaluated by computation of the profile area. Since the wear was considerably more concentrated than in real road traffic determination of the profile shape is of lesser interest. Normalisation of the profile area was done by computation of the spe-cific wear, SPS, defined as the weight of material removed per million vehicle Pilometres. This quantity has the advantage of being indepen-dent of the distribution of wear across the width of the road. It varies somewhat with the number of vehicle passages, because wear, VTI Report Mr 3 A.
VTI
especially of new pavements, normally increases non~lineary with the number of vehicle passages. The maximum depth was 5-10 mm, of fig. 8. The profile areas measured by geometric profiling and by the radioac~ tive methodanxaof the order of magnitude hundredsof square millimet~ res. The radiometric method gave quite a large variation between the different test sections, and the values agreed badly with those ob-tained by geometric profiling on some of the sections. Since only one profile could be measured on each section no measure of the variation within each section could be obtained. But the geometric profiling, which comprised ten profiles per test section, gave a better
possibi-lity of an analysis of the variation, which was also much less than in radiometric profiling. The final evaluation was therefore based exclusively on the geometric profiling. The reason for the great variation in radiometric determination of wear has not been fully established, but it was considered mainly a result of the large longi-tudinal displacement between the preparations. Since the preparations
were laid before the start of the run, and the wheel tracks were not
ideally linear, the distribution of the preparations across the track profile was quite uneven. The number of preparations per test section which actually showed wear was therefore quite low.. The variation of the individual intensity measurements was, however, quite small and equivalent to fractions of mm of wear depth.
The result of the measurements after the first year (50,000 circuits) and the second year (100,000 circuits) are shown in table 6. It is
seen that the order of sequence with respect to SPS-value is the same
both seasons except in the sections laid with Topeka and Topeka with
coated chippings, whose order of sequence was reversed. The SPS-value
of the different pavements is further practically the same after 50,000 circuits as after 100,000 circuits. It is therefore reasonable that this would have been the case if sections 4 and 5 had been
trafficked both seasons, that is the sections with asphaltic concrete including coated chippines and the asphaltic concrete Ab 16.
The reversed order of sequence of the pavements Topeka with and
with-out coated chippines can in all probability be ascribed to the diffi-culty in attaching the chippings to the base pavement. Chippings which Report Mr 3 A.
are not properly attached will get loose at the beginning of the runs.
The experience of manufacture of pavements of this type was scarce
when the pavements were laid (autumn 1968), and further the laying was done late in the autumn, when the air temperature was comparatively low (ca 800). The period between laying of the base pavement and the rolling is quite critical. In the first autumn three pavements with coated chippings were laid altogether, one of which was the above
mentioned Topeka. The other two (sections 4 and 5 with HAb 12 t and
Ab 12 t as base pavement) failed completely and had to be replaced during the second year as was indicated above. The coated chippings in the pavements, which were originally laid on sections 4 and 5, could occasionally be removed bymeans of a pen knife. The difficulty in attaching the chippings to the pavement is probably different with
different base pavements. Topeka mixture contains more binder and has
a different gradation in containing a larger proportion of fines than AC-mixtures, and further the filler/binder content is higher in Topeka mixture. These circumstances contribute to facilitating the attachment of coated chippings to the Topeka mixture base.
If wearing courses performed with and without tar precoatine are coma pared,i&L HAb 12t and Ab 12 t, it is noted that the SPS-values were smaller after tar pre-coatine. The wear was higher in pavements with the softer bitumen. The reasonable explanation for this is the higher hardness of the mortar containing the harder binder and thicker binder films, which can give a higher resistance against water penetration to the aggregate surfaces. In mixtures based on hard bitumen the ef-fect of tar pre-coatinq is less but significant.
If the pavement types Topeka, hard bitumen apshaltic concrete and soft bitumen asphaltic concrete are compared, considerable differences in SPS-value is observed, almost a factor of two between the highest and lowest values. The specially composed asphaltic concrete Ab 16 shows
the same SPS-value as HAb 12 t.
For investigation of the correlation between the results from the road
machine and the test track slabs were taken from the test track, two
slabs from each test section, which were then tested in the road
machine. The slabs were taken out in the autumn of 1970 from areas
which had not been worn by the vehicle. The results from the runs in the road machine after 50,000 and 100,000 circuits are shown in table 7. In this table the pavements are arranged in order of sequence ac-cording to increasing wear.
. o .o I
The runs were made at an air temperature between 0 and 5 C, under water spraying and at a periferal speed of the studded wheels of
35 km/h. The wheel load was 525 kg.
From the results it is seen that the order of sequence of the pavements was the same at 50,000 and 100,000 circuits with the exception of
HAb 8 t with coated chippings and Topeka. Each pavement showed a dif-ference in SPS between 50,000 and 100,000 circuits. As was mentioned earlier this difference in SPS was unimportant when running on the test track. This difference in development of SPS could be the result of the fact that in the road machine the runs were made continously up to 100,000 circuits at a decreasing SPS~va1ue. On the test track on
the other hand there was no traffic during seven months between the
two seasons. In this experiment the SPS:value decreased during each season but at the beginning of the second season the value was higher than it was at the end of the first season. This can be a consequence of-the deterioration which is observed to occur in untrafficked asphal' tic pavements.
The SPS-values in table 6 and 7 show that the wear was greater in the road machine than on the test track. This is among other things a re-sult of the higher wheel load in the road machine. The stud action can also : mr other reasons have been more violent in the road machine than on the test track. It should also be observed that the slabs show a higher SPS-value than corresponding pavements, tested earlier in the road machine (special report 83), these pavements being made in the road machine. This can also be the consequence of the deterioration of untrafficked asphaltic pavements.
The correlation between SPS of different pavements after 100,000 cir-cuits on the test track and in the road machine is closely linear with
the same order of sequence between the pavements, fig. 9. The
ll sponding relation after 50,000 circuits, fie. 10, is not so good. This can he a consequence of the difficulties mentioned above to attach the chippines to the base pavement.
PORTLAND CEMENT CONCRETE
A slab, 1x1 m, wee incorporated in section 4 after 12,500 circuits and was followed up to 100,000 circuits, that is the slab was traf-ficked by 87,500 wheel passages. Profiline was made along three 1% nes which gave an average SPS of 29. The wear was in this case great-er during the second season than during the first one.
CONCLUSIQNS
In conclusion the Bromma experiment confirms that the wear resistance is favoured by a hieh content of course aggregate (especially in the surface of the pavement) and high binder content and hard binder. The use of rolled-in coated chippings requires certain conditions of the base pavement, which in the Bromma experiment were fulfilled only by the
Topeka mixture. Tar pre-coating of the material increased the wear resistance especially when using soft binders. The wear of Pertland cement concrete havement was less than the wear of bituminous pave-ments used in this experiment.
The measurement of studded tyre wear is most conveniently done by
geo-metric profiling, although it is important, that when working on a
frost heaving suhhase, measures have to be taken to compensate for
frost heave and irregularity in frost heave. The radiometric method as it was used in the Promma experiment gave too much uncontrolled variation to the applicable. The advantage of the method is its freedom from influence of frost heave, on the other hand radiation hazard will strongly limit its use on regular roads.
The order of sequence between different bituminous pavements with respect to wear is the same in the road machine as in regular ve-hicle traffic. The magnitude of wear can, however, not be compared quantatively.
12. Definition of terms
A135: 80 pen bitumen A120: 200-250 pen bitumen T60: e v t 30 tar
80 HAb 12 t = 80 kg per square metre of hard bitumen (A135) asphaltic concrete, maximum particle size 16 mm9 dense graded. Other similar denomi nations are composed analogously.
Ab instead of HAb refers to the softer grade bitumen (A120).
Topeka: gap graded asphaltic concrete based on hard bitumen (A135) and in the
present case maximum aggregate size 12 mm.
' CC: coated chippings
Table 1
Specifications of pavements laid in autumn 1968. _... ma . . r.
;
§ 80 Topeka
E 80 HAb 12 t
3
60 Ab 12 t
:Pavement I tar- g s tar- ;
;
é
; 12 16 ;
pte-
12 16 g
épre~ ; 12 16 5
f
g
i
E
coated '
E
coated_i
zwmw-
+"
r
3
.
1
r
I
gSection no
g 1
g 8
g 2
g 3
:4
'7
g 6
* 5
jBitumen type
3 A 135 . A 135 § A 135 g A 135 §A 135 A 120 § A 120 A 120 g
g content in E Q T i E i . i weight Z E 7.5 2 7.8 t 7.0 i 6.8 i7.2 6.2 6.0 6.2
ETar
type
i
g
g
i T 60
E
T 60
i
content in ;
%
é
E
a
;
weight 2 ;
i
g
g 0.5
g
1
0.5
,
é 3' § 2 éBitumen for CC I § § g 3 i E3
type
:
5 A 135 5
g
{A 135 g
1 A 135 i
content in i g E i i i p E iweight 2
s
3 1.3
g
2
11.3
3
é
: 1.3
i
,2-w
v
3
1
i
f
3
3
z
0
i
Table 2Analyzed composition of pavements laid in 1968
3
; 80 Topeka
! 80 HAb 12 t
i
60 Ab 12 t
3 f ! CC 2 itar~ ,CC ; .tar- iCC
: g 5 12 16 : Epre- §12rl6 : §pre- 512-16 ' g ; 3coated g E Ecoated i Section no ; 1 E 8 { 2 E 3 :4 f7 i 6 i5 . i ; § 3 3 l 5 5 Bltumen type 1 A 135 g A 135 2 A 135 3 A 135+ .A 135 SA 120 5 A 120+ jA 120
. i
E
i
1 T 60
f
5
f T 60
content In f é 3 2 g i jweight 2
5 7.7
g 7.9
2 6.5
6.9
i6.9
:6.0
§ 6.1
:6.0
2 E é Aggregate for CC i g Q I g 9 'strength
§
g
f
'
3
g
E
.
'
index
;
g 1
f
:1
g
g
51
{Air voids
; 1.8
i 2.1 E 5.0
g 2.9
g3.2
26.3
g 4.8
§S.9
I - . ' - -mThe bulk density was measured by radiometric method after calibration against the paraffin method.
l3.
Table 3
Specification of pavements laid in autumn 1969
Pav ment
80 HA!) 8 t
E 80 Ab 161)
8 CC 12-16 tar pre~coated Section no 4 5 Bitumen type A 135 A 120 content in weight Z 7.7 5.0 Tar type content in T 60 weight Z 0.5
Bitumen for CC type A 135
content in
weight Z 1.3
1) Special grading, cf fig 5.
Table 4
Analyzed composition of pavements laid in 1969
P j t 80 HAb 8 t 80 Ab 161)
avembn CC 12*16 tar pre-coated
"Section no 4 5
Bitumen type A 135 A lZO/T 60
content in weight % 6.8 4.7 Aggregate strength index 1 Aggregate for CC strength index Air voids 4.1 g 5.2
1) Special grading, cf fig 5. ,
The bulk density was measured by radiometric method after calibration against the paraffin method.
14
Table 5. Characteristics of the vehicle
First year Axle load: front 550 kg
rear 810 kg
Tyres: Trelleborg T-251, 6.4-15/6
Studs: Secomet 144 per tyre in six lines Stud protrusion: new tyres 1.8 - 2.1 mm
at tyre change 1.8 - 1.9 mm
Second year
Axle load: front 720 kg
rear 1000 kg
Tyres: Goodyear A-S dubb, 6.40-15/6
Studs: Secomet 132 per tyre in four lines Stud protrusion: new tyres 1.7 ~ 2.0 mm
at tyre change 0.8 - 1.9 mm
The tyres were both years normally changed after 12 000 - 18 000 circuits on the test track.
Table 6
SPswvalues, Bromma Track,
... i . .._..~... 50,000 passages 7... a w. 100,000 passages - mu mamzmwa, i --~.. g.
1)
Table 7Special grading, cf fig 5.
Values of slabs from the Bromma Track,
LPavement SPS Pavement SPS
Topeka 40 Topeka with CC 12-16 37
Topeka with CC 12-16 48 Topeka 41
HAb 12 t tar premcoated 48 HAb 12 t tar pre-coated 50 Ab 161) tar pre-coated 55 ~"m
HAb 12,t 55 HAb 12 t 57
Ab 12 t tar pre-coated 63 Ab 12 t tar pre-coated 66 HAb 8 t with CC 12~l6 64 ~
-Ab 12 t with CC 12-16 81 Ab 12 t with CC 12-16 81
50,000 circuits 100,000 circuits
VTI Report Nr 3 A.
Special grading, of fig 5.
gment
SPS
Pavement
SPS
Topeka with CC 12-16 76 TOpeka with CC 12-16 58
iHAb 8 t with cc 12-16
94
Topeka
76
Topeka 96 HAb 8 t with CC 12-16 78
Ab 161) tar pre-coated 110 Ah 161) tar pre~coated 82 HAb 12 t tar pre-coated 110 HAb 12 t tar pre~coated 93
HAb 12 t 119 HAb 12 t 94
Ab 12 t tar prevcoated 135 Ab 12 t tar pre-coated 112
Ah 12 t 177 Ab 12 t I 157
1)
.. 1. .. . -m ~. vw. n . . I' ms . . m -. -15.39 m
16 Kl." M \ 3' I /' LY <0 .« E r\ <3 (:3 (NH Ln 3' N w_ Mm _Jr M": q-in.
Fig. 1. Outline 0f test loop at Bromma airport.
Section Pavament Plate bearing va1u=, kgfcm
number {bQCCifiC lead/deflection)
1 Tupeka 2 ,&
2 hAb 12 t 1.8 , 5'
3 hAb 12 t with tar pr%~coated aggregate 16,4
4 HAb 12 t with r011 i~iu coatedchippings 12,2
3 Ab 12 t with rolled~in coatEd chippiugs 23,3
6 Ab 12 t with tar pre~coated aggregate 33,7
7 Ab 12 t. 15,1
8 Tcpeka with reliedwin coated chippings 13,3
During the secmnd vear the pavaments on sectigns 4 an:4 5 were different. See text.
i <7 we uii "W r . . LLJ EIQ MZG!G $:H2Gf L3 x :iuius rn m sr'm ( I f, r ; w 7 2 Hi : 3119 31L} 3;} at}, .10 if} {0 W M h §
zoo
3- 3 tv
:
§ { f a 90 .. , A. -c g s a : m : é 3 3 U A. a w m- ~ ~ .. O f x. 5 5 CL. 2 q _ * E .._. - V -TE 5 3>
. L-.. - ...mE
-w M M-_,*.~..m-..m. U 3 , C. E . (n H 4,». "D C o -kL, 30
Q.) 3 . C M . .. . 0- i( § _ .5 :
- ,
a
. r
A: T 'r x : 9 9 $3.0 i \'*Tir i;z il r § 7 9r x ,' .msé z?» éiw: -H:;;~H;;: : gin; 11= l I ._ . V ginning' éegfgziéiI, l .
0,03;0075 0,10 035 0,2 0,5 0.405
L0 if: 2
5 4 5
IO :2 20 3Q 49 506E}
0,03:
9,952
0325
0.25
5,3 8 11.3 1-5
,32 "
e34
. {3 Fri maskvidd féir sik ror, mm
Fig 2. Design grading of Topéka aggregate an aggregate for dense graded asphaltic concrete, maximum particle size 12 mm with hard bitumen
(HAb 12 t) and Soft bitumen (an 12 t).
it \r
--
.
\.
.
r
_/
1= «1 77 :w,nn A g w
. l ' La 5 z r' f I. f X . 'r ' 3 j ' Am}. ' 3 \ l m": \m :5 53 . } 40 XX) (U 10 30 j V V "V Ed (D Topeka V // . i \ A k f o r o c e n ? , i g I i : . 3 g . 60 g - W ' . -_ _ '0 g 3 0 § 3 C o-- by L . - . . . W u _.__ .n- w _~ N-.- _. H - ~ - ._E
BAD 12 t
.-
>;
ig
! I ' - y- _. ._i__ ' u- m _ w -m HO g 3 U E i v r 1 5 i ) C} "sf ~ - ~ - u. - if. .._;,.. _ w ... .M - M _,-_,_.-, - WWW. w-L w J fl E: Ab 1.- t65 (>(} ., - * .w - _ - u_1 w _ _ g uhh~M,_W, __w*~-_muawVmw_nm,uwm.~. _
D L a ,
é
. i2 Ig . P
:0 _ ~ ~ - M - w - _ «wmjw. .. .1...
-vim g dggguxj f .O igéo
L0 L5 2
3 1+ 5;
f iOi ii 20 :3 ansaao
5.6 a :1, 36
52
{54
Ci rm moskvidd far Sé z Gr. m
:5 3 U ! £3 r'\a U} 1 .» 7 0-6.3.3.? 1.4.5; .3: Jltl ill; . p 9 h v k [N 01g 2 as measured agtér aggrautlon
and 51g Ofa greg te referrad t0 ine'i t 1
I w .-~ .w x. .._ f" ,1 V...
:g (SELLLuuh
v
V
.. t ; .. .. .1 H. A, g +7 I u $1.: £39.. 35313. «.wxumwgnriw 1 1 " " E P I? V :m b "I j I A. 'f e m! 0 5'7 ."1 a " ,' "3 'é 1} Ky I -Jg a . M 3", h r} W x... ' 0.9.15. . .. : . . A J! v 4. \ l} . , a» L} a n . » m y I...) .x: w... ,J 2.} 1.11.» Silt)-«xw .r... . .. J M 1' } M M ,u q . 5L, « 7.: 7a. 4. .. J vs? . I '3 a' m m u w v 1 2172 VI» 5.. a , .. ¥ .5 v4% . r . " I \ 9 I K xi b l i i ., I V I , I 5+ V in.. .) 3l .. L» a»gawk I .. .uuuA -o .. A, V 3... UP ". 9 1 I/ p 53 ill»), \q I. _ .., . P3 M. m, , .. A n. L M2 (a nu. . Ask LT!
I .3 .
7 v Hy. 9.3%.»?! n L llztlrlnvllig VHSQleS . $91): 5~IZVE£ILKE i a .3 u (i
2 kt... m .2; >31: 4 ,htk f iv r1. , 3. w y E )3 .:z .s . m . .w .p ,x z . d .m , 3 ; _ x .2. w x s v ,2 . » .. . . a u .21 .. .n . W. . . I; .i. I. \f! , s u , .l. f... . . . .. A , . .w A . T. x .. .. w m . h i . a. g . a . t ,, . . 1 m . I . «Va. \ . . . A? .,. . v .. 2k ..., u . K . .11. .va o R. "r r (a . . q... u}. W V» .. u. a « _ J... \ N \r. L 8 x... . . . y , x hf : \ . w , . .. H m.» w ... f 0.. £1... ,y it; . . u .. .1. . \ .m . (it; . V .3 . w . L X... . , .A . ¢ . a I w . wk.» .4 1 ~. rs». . .. w , w , . 11.- v.3 , a u .. .. ,e. .a 1:. m m w. . . H .2... , . 4:1 LE. V n . M m. .. .n r L . I -1. Yuk » , I.2. . A . A 3%.! «)~ .x . J i... a. i . it. » . t 4 .. . x... w 5 1.1.5 V y. _ . no . Y. La r. .. )1 In m . «I. i... .m .L a" ~ «71 y .. I 5| , _4 1.: « s. D . I: .. .. / . . rm ,. {a . . . . .1} , . - w .W W V C. u may... m h . . U H ~l.. x} _ ... Js u . . . v .é . .m . u u. C V ~ . M r _ L 1 .V-b 4 w .m \ u . n» I.. .. M .. u m w. ._ u. 93 ! " :3 99 *" ' . K. . :11. . , 31 I W W I '». = i \ J » . M * M M M ~. :. JJ "* "" ~M
r WJ .1.. 2 x :3 A...» )v L12 1 , 4 r \« W M . Ig ua na -1 . #- 5.'v1.x. Ru? I w L J ._ . p «9 . .. ,. u* "i . W W N " ' ,_ C ' \ . $ \ 1 , 1 W I . nah . g fww a ( .. 3:, x .r ..M . . ,. . . m. v . 4. . v. 4 t K. raw4 . M {T 2 n J Uh V 5...}! x... .4 » t.:..\ .2! i A: 1-, 1;. m}. r .A E m w..qu {MM an m ! My!!! [.91. PM. u all. .. .. d x nq -w. g u... n. {lr u I -\. :3 1? 2. ) Re ;.
w «m g ». man. an.» . N... I» : 1 1 . z. u , 1 ~ rxw.4.1 y),,. V h ku l; -... L. ... "x 4 " A'L
ti s i p s 5 »
Fig. 7. 7Hial gauge profilometers used for wear measurements on
the test loop
VTI Report Nr 3 A.
v. .i. Re po rt Nr 3 A. Refemnce 1185.3; head W w . 4 . . . . at
A c m e -«w m q «I : u d z" 1:55,:- ; ":1; t: 1., 31L .0" -x[1 x .. ,g.1 h.-E.2 a y. nw. w. 3 W m n u inK : uwwn | I,
VTI Report Nr 3 A. H F x. 3-,: . . s. » . 3 .t i s ) y. . .. K w . i n n m. H 5 » a wn m wc w r m . .. I .1 3. . I: v n f. .x, u g N I 1 E " 1 .no C'l a an. m»: tun-0M m " i «I! u m «N .mJ a: ~3 1. .v k m I t ) 3! . ,. a a m ,.L.. . é
%
:3
fr . :6 p i F r. 1 3 3*13, 1 -;' u" k, 1 » L. ; :u-x { I I"c-7 ) i J i; ati "f 326
REFERENCES
(1). B. Wehner: "Beanspruéhung von Strassenoberfl chen dutch
Winter-reifen mit Spikes . Strasse und Autobahn 7/1964, pages 254-257. (2). IVA Transportforskningskommission, utredningsrapport nr 13, 1963:
"Den elektroniska v gen".
(Royal Academy of Engineering Sciences, Report nr 13, 1963: "Den elektroniska'végen")