http://www.diva-portal.org
Postprint
This is the accepted version of a paper published in Archives of gerontology and geriatrics (Print). This paper has been peer-reviewed but does not include the final publisher proof-corrections or journal pagination.
Citation for the original published paper (version of record):
Gransjön Craftman, Å., Johnell, K., Fastbom, J., Westerbotn, M., von Strauss, E. (2016)
Time trends in 20 years of medication use in older adults: Findings from three elderly cohorts in Stockholm, Sweden.
Archives of gerontology and geriatrics (Print), 63: 28-35 https://doi.org/10.1016/j.archger.2015.11.010
Access to the published version may require subscription. N.B. When citing this work, cite the original published paper.
Permanent link to this version:
Time trends in 20 years of medication use in older adults: Findings from
three elderly cohorts in Stockholm, Sweden
Åsa Gransjön Craftman Kristina Johnell
Johan Fastbom
Margareta Westerbotn Eva von Strauss
Abstract
New drugs and expanded drug indications are constantly being introduced. Welfare states strive to provide equity in drug treatment for all of its citizens and today´s healthcare systems spend financial resources on drugs for the elderly in a higher rate than for any other age group. Drug utilization in elderly persons has an impact in health and wellbeing in older people.
The purpose of the research
It was to describe the changes in medication use including people aged 78 years and over regardless of residence and other characteristics over 20 years.
Materials and methods.
The study population consisted of 4,304 participants in three population-based cross-sectional surveys conducted in the Kungsholmen area of central Stockholm, Sweden. The participant’s current drug utilization was reviewed by physicians following standardized protocols. Data were statistical analyzed. Logistic regression models were used to estimate odds ratios and 95% confidence intervals for use of analgesics and psychotropic drugs in the cohorts of 2001 and 2007, controlling for age, gender, education and cognition.
The principal results and major conclusions.
Results shows that the prevalence of medication use and polypharmacy in older adults has increased dramatically the late 1980s to the 2000s in central Stockholm, Sweden. In
particular, the use of analgesics increased significantly, while some drug groups decreased, i.e. antipsychotics. Women used more medication than men in all three cohorts. Older adults living in service buildings used the largest amount of drugs in 1987, whereas those living in institutions were the most frequent users in 2001 and 2007.
1
INTRODUCTION
The aging of the populations started several decades ago and is now a global phenomenon.1 The Organisation for Economic Co-operation and Development [OECD] reported in 2013 that, for the first time, average life expectancy exceeded 80 years across OECD countries.2 With ageing follows increased prevalence of medical conditions that require treatment of large population groups.3 There is a strong association of multi-morbidity, defined as
coexistence of a number of chronic diseases in the same individual, with increasing age.4New drugs and expanded drug indications are constantly being introduced.5, 6 Welfare states strive to provide equity in drug treatment for all of its citizens7 and today´s healthcare systems spend financial resources on drugs for the elderly in a higher rate than for any other age group.
Use of prescription medications continues to grow as a result of an increasing demand for medications available to treat chronic ageing related diseases.2,8 In Sweden more than 40% of the population aged 77+ years use more than 5 drugs concurrently.9 Concurrent use of many drugs (polypharmacy)10 is common in older adults11 and is a risk factor for adverse drug reactions and drug-drug interactions (DDIs).8,11-13 In addition, due to altered pharmacokinetics and pharmacodynamics in old age, elderly patients are particularly sensitive to drugs and at increased risk of adverse drug reactions.14-16 Polypharmacy have also proven to be associated with unplanned re-hospitalisation.17,18
Pain is particularly common in older adults affecting more than half of the older population, and up to 80% of nursing home residents.19 Helme and Gibson indicate that pain is a result of degenerative disease coupled with leg and foot disorders, and that older women have higher prevalence rates of pain then coeval men.20 Further, higher somatic disease burden contributes to higher severity of mood symptoms and late-life depression.21 Impairments and other
consequences of somatic disease increase the risk of depression, which is most evident among adults aged between 60 to 70 years.22 It has been suggested that in 2020, depression will be second to heart disease as measured by disability-adjusted life years.23 Linjakumpu et al24 have reported the use of psychotropics as most prevalent among women aged 85+ years. Cumming and Le Couteur25 stated that all types of psychotropics were associated with at least a 50% increased risk of all hip fractures. With advancing age, regardless of gender, older adults continues to live in their own home while suffering from daily pain, the concomitant use of analgesic and psychotropic drugs will become even more prevalent.26
2
The objectives of the present study were to explore changes in medication use, particularly with respect to polypharmacy and the use of analgesics and psychotropics, over a period of 20 years among three cohorts of older adults aged ≥ 78 years, including persons living in their own homes or in institutions.
3
METHODS
Study Population and Study Design
The study population consisted of 4,304 participants in three population-based cross-sectional surveys conducted in the Kungsholmen area of central Stockholm, Sweden: the Kungsholmen Project (KP) in 1987 and the Swedish National study on Aging and Care in Kungsholmen (SNAC-K) in 2001 and 2007 (Figure 1).
KP was a community-based cohort study on aging and dementia targeting all inhabitants in the Kungsholmen district aged ≥75 years in October 1987 (born in 1912 or earlier), living either at home or in institution (baseline n=1,810). The project design has been described in detail elsewhere.27
The Swedish National study on Aging and Care (SNAC) is a national longitudinal study on aging and care, ongoing in four different geographical areas of Sweden. Participants were randomly selected from the population of adults aged 60+ years living at home or in institution in the Kungsholmen district in 2001 (baseline n=3,363).28 Data derived from structured interviews by trained nurses, clinical examinations by physicians, and
psychological testing, all following standardized protocols.27,28
Data were derived from KP baseline in 1987-89, SNAC-K baseline in 2001-03, and SNAC-K follow-up in 2007-09. As the KP included people aged ≥75 years, only participants from SNAC-K in the same age range were included. As it took approximately two years to examine the population at each survey, people aged 77 to 79 years would be included in the 78-year age group; people aged 80 to 82 years would be included in the 81-year age group etc.
Studies were approved by the Ethics Committee of the Karolinska Institutet and the Regional Ethical Review Board in Stockholm, Sweden. All participants (or a proxy in case of
cognitively impaired persons) provided written informed consent.
Study Variables
All variables were collected during the examination and/or through an interview with the participant’s next-of-kin or a close informant.
4
Living situation included living at home (living alone or together with someone), in service
building (individual apartments with communal facilities staffed around the clock), or in institution.
Cognitive function was measured by the Mini-Mental State Examination (MMSE)29
administered by registered nurses or by physician. The test gives a maximum of 30 points, where cognitive impairment was defined as having a score below 25.30
Medication use was collected by the physician. Participants were asked to bring a list of
current regularly and as needed used drugs. Drug prescriptions and medical containers were inspected where possible. Both prescribed and over-the-counter drugs were recorded. Drugs taken daily or at regular intervals were defined as being in regular use. When information could not be provided (e.g., due to cognitive impairment), a relative or a close informant supplied information. For persons living in institution information on drug utilization was collected from medical records. Drugs were classified according to the Anatomical
Therapeutic Chemical (ATC) Classification system, as recommended by the World Health Organization.31 We analyzed the use of drugs, and in particular analgesics (N02A-B) and psychotropics (N05A-C and N06A). Polypharmacy was defined as concurrent use of five or more drugs.32
Statistical Methodology
Differences between participants in the three surveys in sociodemographic characteristics, living situation, and cognition, were compared using chi-square tests for categorical variables and analysis of variance for continuous variables. Age- and gender-specific prevalence figures for medication use (number of medications) were calculated. Ninety-five percent confidence intervals (95% CIs) were computed based on binomial distribution.33 Logistic regression models was used to estimate odds ratios (ORs) and 95% confidence intervals (CIs) for use of analgesics and psychotropic drugs in the SNAC-K cohorts of 2001 and 2007, controlling for age, gender, education and cognition. The KP cohort of 1987 was used as reference category. IBM SPSS Statistics 22.0 for Windows (IBM, SPSS Inc., Chicago, IL, USA) was used for the statistical analyses.
5
RESULTS
There were no significant age or gender differences between participants and non-participants within any of the three cohorts. There was a significantly higher participation rate in the earliest cohort in 1987 than in the cohorts 2001 and 2007 (p <0.001); 78.4% and 65.0% and 69.3% respectively. There was a disparity between the three cohorts in drop out due to death or refraining from participation (Figure 1).
Insert Figure 1 about here
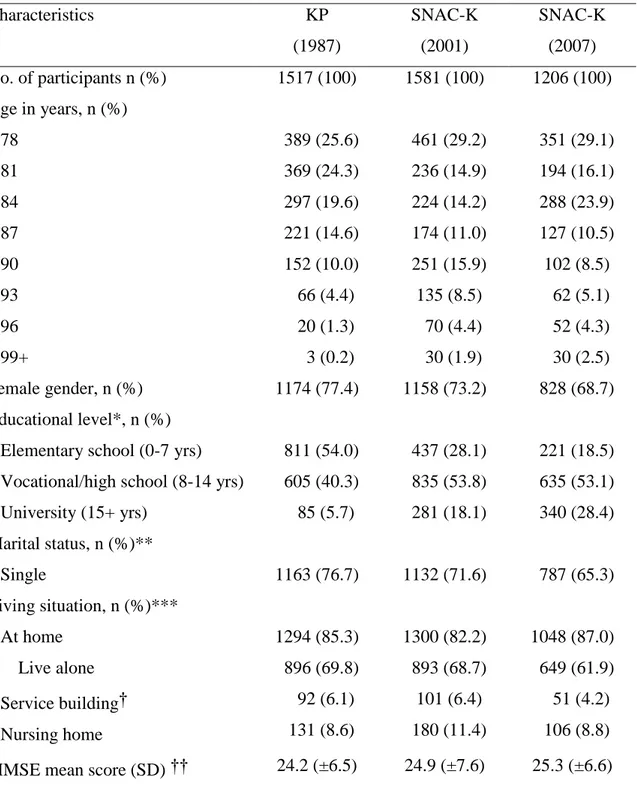
SNAC-K participants of 2001 and 2007 were older than the KP participants of 1987 (p< 0.001), Table 1. The proportion of participants aged 90+ years was 20.4%, 30.7% and 15.9% in the three cohorts, respectively. Majority of participants were women (77.4% in 1987, 73.2% in 2001 and 68.7% in 2007), with a larger proportion of women in the cohort of 1987 as compared to 2007 (p <0.001).
In 1987, almost 77% of the participants were single/widowers; the corresponding figure for 2007 was 65% (p <0.001). Thus, more people lived alone at home in 1987 as compared to 2007 (69.8% vs 61.9%) (p=0.05). There was a tendency to continue living at home in 2007 as compared to 1987 where more people were living in service buildings (4.2% vs 6.1%).
Educational level increased significantly; in 1987, 5.7% had gone to university compared to 28.4% in 2007. The 1987 cohort had lower educational level than the other two cohorts 2001 and 2007 (p <0.001), and was significantly more cognitively impaired (MMSE below 25), 29.0% vs 24.0% and 22.4% (p <0.001). There were significant differences in cognitive impairment between genders in the three cohorts (p <0.001); the proportion of men with cognitive impairment was 24.8% in 1987, 13.7% in 2001 and 16.7% in 2007. The corresponding figures for women were 30.2%, 27.8% and 25.0%.
Insert Table 1 about here
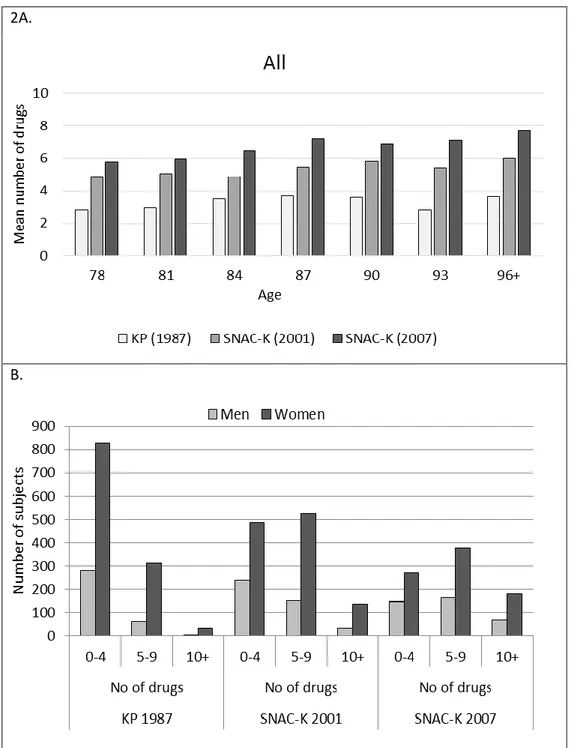
Medication use increased for both genders in all age groups from 1987 to 2007 (p <0.001); in the age group 78 years from 2.8 drugs in 1987 to 5.8 drugs in 2007, and corresponding figures for the age group 96+ years was 3.6 and 7.7, Figure 2. Highest number of drugs taken by an
6
individual was 15 (a woman) in 1987, 23 (a woman) in 2001 and 27 (a man) in 2007. Women used more drugs than men in all three cohorts (p <0.001).
Insert Figure 2 about here
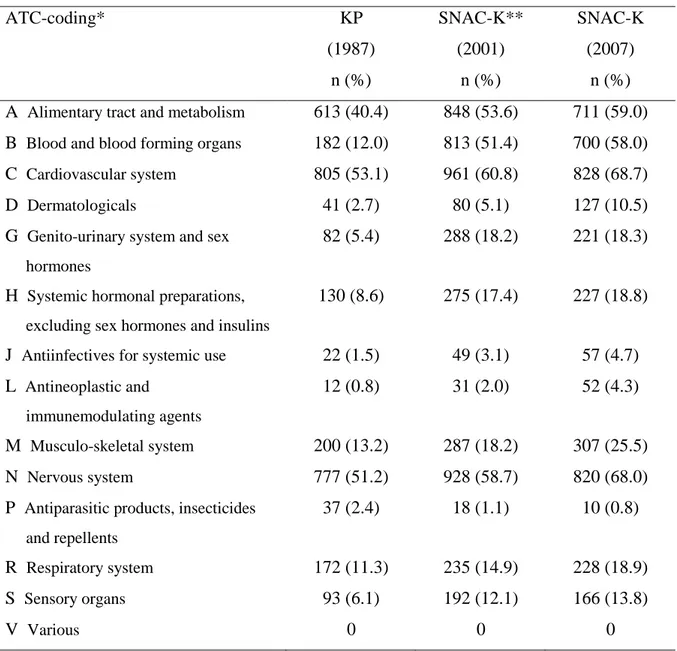
Overall (1987, 2001 and 2007), drugs for the cardiovascular system were most frequent (53.1%, 60.8% and 68.7% respectively), followed by drugs for the nervous system (51.2%, 58.7% and 68.0%) and the alimentary tract and metabolism (40.4%, 53,6% and 59.0%), Table 2. Number of drugs increased from 1987 to 2007 in all ATC groups except for antiparasitic products, insecticides and repellents. Largest increase (46.0%) was for blood and blood forming organs drugs, followed by alimentary tract and metabolism drugs (18.6%), nervous system drugs (16.8%), cardiovascular drugs (15.6%), genito-urinary system drugs and sex hormones (12.9%), musculo-skeletal system drugs (12.3%), and systemic hormonal preparations (10.2%).
When analyses were stratified by gender, blood and blood forming organs drugs still
accounted for the largest increase over 20 years (56.3% for men and 41.8% for women). For men followed cardiovascular drugs (20.3%), genito-urinary system drugs and sex hormones (17.9%), nervous system drugs (16.0%), musculo-skeletal system drugs (16.0%), and alimentary tract and metabolism drugs (14.8%). The corresponding for women was alimentary tract and metabolism drugs (21.2%), nervous system drugs (19.1%),
cardiovascular drugs (14.0%), systemic hormonal preparations (12.0%), musculo-skeletal system drugs (11.1%), and genito-urinary system drugs and sex hormones (10.9%). ATC groups with an increase of less than 10% are not reported. No participants used drugs in ATC group various.
Insert Table 2 about here
Gender specific use of medication (mean number of drugs) in 1987 was 2.6 (±2.2) for men and 3.4 (±2.6) for women, Table 3. Corresponding figures in 2001 was 4.5 (±3.4) and 5.5 (±3.4), and in 2007 6.1 (±4.0) and 6.6 (±3.9).
Prevalence of polypharmacy increased from 27.0% in 1987 to 53.9% in 2001, and 65.3% in 2007 (p <0.001). For those living in institutions, the mean number of drugs almost tripled
7
between 1987 and 2007, from 3.4 to 10.3, and polypharmacy increased from 24.4% to 95.3%. Corresponding figures for those living in service buildings were 4.2 to 8.3 and 44.6% to 82.4%.
People living at home used the lowest number of drugs (p <0.001), nevertheless the mean number of drugs doubled from 3.1 in 1987 to 5.9 in 2007, and polypharmacy increased from 26.0% to 61.5% (p <0.001).
Insert Table 3 about here
After adjusting for age, gender, education and cognition, the odds of using analgesics and psychotropic drugs were significantly higher in 2007 compared to 1987, with an OR (95% CI) of 3.3 (2.8-4.0) and 1.3 (1.1-1.6) respectively (Table 4). Use of antipsychotics (ATC code N05A) decreased in both genders, from 4.4% for men in 1987 to 2.9% in 2007; and for women from 7.2% to 3.6% (p=0.01). Use of anxiolytics (N05C) decreased in women from 16.4% in 1987 to 13.8% in 2007 (p=0.06). There was a significant increase in use of
antidepressants (N06A); from 0.6% for men in 1987 to 11.4% in 2007 (p=<0.001), and 1.5% to 16.3% for women (p< 0.001). Women increased use of hypnotics/sedatives (N05C), from 28.2% in 1987 to 37.1% in 2007 (p< 0.001). Overall, only women had significantly higher use of psychotropic drugs in 2001 and 2007 as compared to 1987, although there was a tendency for men.
Both genders had significantly higher use of analgesics in 2001 and 2007 as compared to 1987 (the ORs with 95% CIs for men in 2001 was 1.4 (0.9-2.1) and in 2007 3.0 (2.1-4.4); the corresponding figures for women were 1.6 (1.4-2.0) and 3.4 (2.7-4.1). During 1987 to 2007, women had a significant increase in use of both minor analgesics (N02B) (from 17.0% to 51.4%) and opioids (from 9.5% to 14.5%) (p <0.001), whereas men only had an increase in minor analgesics (from 11.7% to 33.1%) (p <0.001).
Split analysis by cognition (MMSE 0-24 vs 25-30) showed no significant differences in use of analgesics between cognitively impaired and cognitively intact elderly. However, there was a dramatic increase in use of analgesics over the time period (23.6% and 22.9% in 1987 vs 48.5% and 44.9% in 2007). Cognitively impaired elderly used significantly more
8
use of psychotropics, from 42.5% in 1987, 57.9% in 2001, and 64.1% in 2007. The corresponding figures for cognitively intact elderly were 37.2%, 37.1%, and 36.6%.
Cognitively intact elderly primarily used hypnotics, whereas cognitively impaired elderly used hypnotics, sedatives and antidepressants. Use of antipsychotics had decreased in
cognitively impaired elderly by almost 33% from 1987 to 2007, whereas use of sedatives and hypnotics had almost doubled, and use of antidepressants had increased from 2.7% in 1987 to 28.1% in 2007.
9
DISCUSSION
We investigated time trends in medication use over 20 years (from 1987 to 2007) in three cohorts of older adults aged 78+ years. Main findings are:
1. Medication use, including polypharmacy, increased significantly for both genders and all age groups. Women used more drugs than men;
2. Drugs for cardiovascular system were most frequent, followed by drugs for nervous system, and alimentary tract and metabolism. Drugs for blood and blood forming organs accounted for the largest increase in medication use;
3. Use of analgesics increased in both genders, whereas only women had a significantly higher use of psychotropic drugs;
4. Older adults living in service buildings used the largest amount of drugs in 1987, whereas those living in institutions were the most frequent users in 2001 and 2007.
A 20-year increase in medication use in older adults
Increased prevalence of medication use in older adults can be explained by increase of chronic diseases, multi-morbidity and parallel development of new pharmaceuticals. It may also relate to lack of clinical trials enrolling older people with multi-morbidity,5,6,34 leading to potential overconsumption of drugs in aging. Studies have suggested Franchi6,34 that the impact of specific evidence-based clinical guidelines for explicit disease diagnosis may contribute to increased medication use, and thereby the presence of polypharmacy, as they state the benefits of an individual medicine for a specific disease. Thus, clinical guidelines may not be adapted to complex drug treatment of frail older persons suffering from multiple diseases.35 Revised clinical guidelines in prevention of cardiovascular disease in Sweden state that consideration must be given to the persons age and comorbidity in a holistic view of the aging body.36 Qato et al37 found that the prevalence of overall medication use remained stable, but the rate of polypharmacy increased.
Use of drugs according to ATC groups
Drugs for cardiovascular system were most frequent, followed by drugs for nervous system. Presence of polypharmacy in older adults with a history of stroke can be explained by multiple medications used to treat hypertension, and by comorbidities related to stroke, such as diabetes, hypercholesterolemia, and coronary heart disease.38 Egger et al has shown that older adults (aged 75+ years) were prescribed more drugs with a high potential for DDIs, especially drugs used for the treatment of arrhythmias and heart failure, than younger
10
patients.39 Our findings showed that the largest increase in drug utilization was for blood and blood forming organs. This is mainly due to increase of the aging population, an increasing prevalence of chronic heart diseases and of risk factors for atrial fibrillation, such as diabetes mellitus.40
In agreement with a previous Swedish study,9 both genders had a significantly higher use of analgesics in 2007 as compared to 1987. An increasing trend of opioid utilization has also been reported from the United States.41 This may refer to several factors like aggressive pharmaceutical marketing, awareness of the under treatment of pain and introduction of pain management guidelines, and introduction of new analgesics.42,43 In our study, the odds of using analgesics and psychotropics were significantly higher in 2007 compared to 1987, even after adjusting for sociodemographic factors and cognition. Use of antipsychotics decreased while the use of antidepressants increased, indicating that recent efforts to increase the quality of medication use in older adults, based on the National Board of Health Indicators, have been efficient. According to a Finnish study,8 every fourth elderly person was using analgesics and psychotropics concomitantly. The combined use was related to multi-morbidity, more
frequent with advancing age irrespective of gender and most prevalent among the frailest older adults (aged 85+ years). In our study, women increased their use of hypnotics, sedatives, opioids, and minor analgesics. There was a tendency also for men, who had an increased use of minor analgesics. Franchi et al6 reported increase in medication use of analgesics and psycho-analeptics, but also in the number of prescription claims and packages per individual, even though the number of active substances per year remained stable over time. This was addressed to change in chronic treatment.6
Gender differences in medication use
Women generally used more drugs than men, in particular analgesics and psychotropics.44 Morbidity or disability was not included in the analyses, but earlier studies from our group have shown that women aged 85+ years have a higher disability incidence and higher morbidity prevalence than coeval men.45 Previous research also suggests that women report poorer self-assessed health, in particular overall physical health. In contradiction, Koopmans and Lamers46 did not find gender to be related to an increased utilization of health care, even if women had higher levels of specialized health care utilization due to somatic morbidity and mental distress.
11
Medication use according to living situation
Older adults living in service building used the largest amount of drugs in 1987, whereas in 2001 and 2007 those living in institutions used the most medication, including polypharmacy. A recent review 47 reported unsatisfactory review of inappropriate drug prescribing in nursing homes. As the most frail and sick older adults live in nursing homes, they are exposed to risk factors due to inappropriate drug prescribing, DDI and polypharmacy.48
Could selection bias due to differences in attrition and populations characteristics have affected the results?
There was significantly higher participation rate in the earliest cohort in 1987 than in the cohorts 2001 and 2007. There was also disparity in cause of drop out between the three cohorts, as more people had refrained from participation in 2001 and a higher percentage had died before participation in 2007. We do not believe this has biased the results as we report higher medication use in both 2001 and 2007 as compared to 1987. On the contrary, it strengthens our results as these differences rather would be expected to lead to
underestimation of medication use. Higher proportion of the study population was aged 90+ years in 2001 and 2007 as compared to 1987. This could be a limitation since age itself
predicts higher medicine use. Also the educational level increased significantly over the years, and earlier studies have shown that educational level has an impact on medicine use, and that low educated women have a higher risk of polypharmacy and DDI.7,47,49 However the higher education level may also contribute to the use of new medications.54
Methodological considerations
To our knowledge, no previous study has investigated medication use in older adults covering 20 years. The strength of this study is the use of three population-based cohorts and, in
contrast to other studies, included all inhabitants, whether they were living at home or in nursing homes. The same research team with the same expertise conducted all three cohort surveys, using the same study design and assessment tools.
However, our study also has potential limitations of which some have been discussed above, such as disparity in cause of drop out and educational level between the cohorts, and a higher proportion of the very old in the last two cohorts as compared to the first cohort. Furthermore, this being inner city populations with a higher socioeconomic status than in Sweden in
12
Data derived from three cross-sectional investigations without the possibility of identifying potential causalities; however, this study was based on three assessments over a study period of twenty years; thus providing a strong evidence of time trends in medication use. Being part of longitudinal studies, there are excellent future opportunities to explore any processes involved in the increased medication use over time.
CONCLUSIONS
Prevalence of medication use and polypharmacy in older adults has increased dramatically in both genders from the late 1980s to the 2000s in central Stockholm, Sweden. In particular, the use of analgesics increased significantly, while some drug groups decreased, i.e.
antipsychotics. Women used more medication than men in all three cohorts (1987, 2001 and 2007). Older adults living in service buildings used the largest amount of drugs in 1987, whereas those living in institutions were the most frequent users in 2001 and 2007.
13
ACKNOWLEDGMENTS
We thank all the members of the project study groups in KP and SNAC-K for data collection and management.
The SNAC, (www.snac.org) is financially supported by the Ministry of Health and Social Affairs, Sweden, the participating County Councils and Municipalities, and the Swedish Research Council for Health, Working Life and Welfare (Forte). In addition, specific grants were obtained from Sophiahemmet University, The Sophiahemmet Foundation for Clinical Research and King Gustaf V and Queen Victoria’s Freemasons Foundation.
Conflicts of Interest: For all authors nothing to declare.
Author contributions
Study concept, design and interpretation of data: Craftman, von Strauss, Johnell and Fastbom. Statistical analysis: Craftman and von Strauss. Drafting of the manuscript: Craftman and von Strauss. Critical revision of the manuscript: Johnell and Fastbom.
14
REFERENCES
1. Christensen K, Doblhammer G, Rau R, Vaupel JW. Ageing populations: the challenges ahead. Lancet 2009;374(9696):1196-1208.
2. OECD. Health at a Glance 2013: OECD Indicators. Paris2013.
3. Fors S, Lennartsson C, Agahi N, Parker MG, Thorslund M. [Interview study on the living conditions of the very old. Elderly acquire more health problems, but they manage
everyday life better]. Lakartidningen 2013;110(32-33):1403-1405.
4. Barnett K, Mercer SW, Norbury M, Watt G, Wyke S, Guthrie B. Epidemiology of multimorbidity and implications for health care, research, and medical education: a cross-sectional study. Lancet 2012;380(9836):37-43.
5. Nobili A, Franchi C, Pasina L, et al. Drug utilization and polypharmacy in an Italian elderly population: the EPIFARM-elderly project. Pharmacoepidemiol Drug Saf 2011;20(5):488-496.
6. Franchi C, Tettamanti M, Pasina L, et al. Changes in drug prescribing to Italian community-dwelling elderly people: the EPIFARM-Elderly Project 2000-2010. Eur J Clin Pharmacol 2014;70(4):437-443.
7. Haider SI, Johnell K, Ringback Weitoft G, Thorslund M, Fastbom J. Patient educational level and use of newly marketed drugs: a register-based study of over 600,000 older people. Eur J Clin Pharmacol 2008;64(12):1215-1222.
8. Linjakumpu T, Hartikainen S, Klaukka T, Veijola J, Kivela SL, Isoaho R. Use of medications and polypharmacy are increasing among the elderly. J Clin Epidemiol 2002;55(8):809-817.
9. Haider SI, Johnell K, Thorslund M, Fastbom J. Analysis of the association between polypharmacy and socioeconomic position among elderly aged > or =77 years in Sweden. Clin Ther 2008;30(2):419-427.
10. Gnjidic D, Hilmer SN, Blyth FM, et al. Polypharmacy cutoff and outcomes: five or more medicines were used to identify community-dwelling older men at risk of different adverse outcomes. J Clin Epidemiol 2012;65(9):989-995.
11. Johnell K, Fastbom J. Comparison of prescription drug use between community-dwelling and institutionalized elderly in Sweden. Drugs & Aging 2012;29(9):751-758.
12. Guthrie B, McCowan C, Davey P, Simpson CR, Dreischulte T, Barnett K. High risk prescribing in primary care patients particularly vulnerable to adverse drug events: cross sectional population database analysis in Scottish general practice. BMJ 2011;342:d3514.
15
13. Haider SI, Johnell K, Thorslund M, Fastbom J. Trends in polypharmacy and potential drug-drug interactions across educational groups in elderly patients in Sweden for the period 1992 - 2002. Int J Clin Pharmacol Ther 2007;45(12):643-653.
14. Fick DM, Cooper JW, Wade WE, Waller JL, Maclean JR, Beers MH. Updating the Beers criteria for potentially inappropriate medication use in older adults: results of a US
consensus panel of experts. Arch Intern Med 2003;163(22):2716-2724.
15. Fux R, Greiner D, Geldmacher M, Morike K, Gleiter CH. Multiple drug prescribing by general practitioners in a German region: Implications for drug interactions and patient safety. Int J Clin Pharmacol Ther 2006;44(11):539-547.
16. Shi S, Morike K, Klotz U. The clinical implications of ageing for rational drug therapy. Eur J Clin Pharmacol 2008;64(2):183-199.
17. Wimmer BC, Dent E, Bell JS, et al. Medication Regimen Complexity and Unplanned Hospital Readmissions in Older People. Ann Pharmacother 2014;48(9):1120-1128. 18. Wimmer BC, Dent E, Visvanathan R, et al. Polypharmacy and Medication Regimen
Complexity as Factors Associated with Hospital Discharge Destination Among Older People: A Prospective Cohort Study. Drugs & Aging 2014;31(8):623-630.
19. Gibson SJ. IASP global year against pain in older persons: highlighting the current status and future perspectives in geriatric pain. Expert Rev Neurother 2007;7(6):627-635. 20. Helme RD, Gibson SJ. The epidemiology of pain in elderly people. Clin Geriatr Med
2001;17(3):417-431.
21. Hegeman JM, de Waal MW, Comijs HC, Kok RM, van der Mast RC. Depression in later life: A more somatic presentation? J Affect Disord 2014;170C:196-202.
22. Verhaak PF, Dekker JH, de Waal MW, van Marwijk HW, Comijs HC. Depression, disability and somatic diseases among elderly. J Affect Disord 2014;167:187-191. 23. Chapman DP, Perry GS. Depression as a major component of public health for older
adults. Prev Chronic Dis 2008;5(1):A22.
24. Linjakumpu T, Hartikainen S, Klaukka T, Koponen H, Kivela SL, Isoaho R. Psychotropics among the home-dwelling elderly--increasing trends. Int J Geriatr Psychiatry 2002;17(9):874-883.
25. Cumming RG, Le Couteur DG. Benzodiazepines and risk of hip fractures in older people: a review of the evidence. CNS Drugs 2003;17(11):825-837.
26. Hartikainen S, Mantyselka P, Louhivuori-Laako K, Enlund H, Sulkava R. Concomitant use of analgesics and psychotropics in home-dwelling elderly people-Kuopio 75 + study. Br J Clin Pharmacol 2005;60(3):306-310.
16
27. Fratiglioni L, Viitanen M, Backman L, Sandman PO, Winblad B. Occurrence of dementia in advanced age: the study design of the Kungsholmen Project.
Neuroepidemiology 1992;11 Suppl 1:29-36.
28. Lagergren M, Fratiglioni L, Hallberg IR, et al. A longitudinal study integrating
population, care and social services data. The Swedish National study on Aging and Care (SNAC). Aging Clin Exp Res 2004;16(2):158-168.
29. Folstein M, Folstein S, McHugh P. Mini-Mental State': a practical method for grading cognitive state of patients for the clinicians . J Psychiatr Res 1975;12:189-198.
30. Fratiglioni L, Grut M, Forsell Y, et al. Prevalence of Alzheimer's disease and other dementias in an elderly urban population: relationship with age, sex, and education. Neurology 1991;41(12):1886-1892.
31. WHO Collaboration Centre for Drug Statistics Methodology. ATC/DDD Index 2014. 2013. Accessed 02 April, 2014.
32. Haider SI, Johnell K, Weitoft GR, Thorslund M, Fastbom J. The influence of educational level on polypharmacy and inappropriate drug use: a register-based study of more than 600,000 older people. J Am Geriatr Soc 2009;57(1):62-69.
33. Armitage P, Berry G. Statistical methods in Medical Research. Oxford: Blackwell Scientific; 1987.
34. Van Spall HG, Toren A, Kiss A, Fowler RA. Eligibility criteria of randomized controlled trials published in high-impact general medical journals: a systematic sampling review. JAMA 21 2007;297(11):1233-1240.
35. Tinetti ME, Bogardus ST, Jr., Agostini JV. Potential pitfalls of disease-specific
guidelines for patients with multiple conditions. N Engl J Med 2004;351(27):2870-2874. 36. Medical Products Agency. [Prevention of atherosclerotic cardiovascular disease with
drugs - treatment recommendation.] Att förebygga aterosklerotisk hjärt-kärlsjukdom med läkemedel – behandlingsrekommendation. Läkemedelsverket. 2014;25(5):20-33.
37. Qato DM, Alexander GC, Conti RM, Johnson M, Schumm P, Lindau ST. Use of prescription and over-the-counter medications and dietary supplements among older adults in the United States. JAMA 2008;300(24):2867-2878.
38. Chobanian AV, Bakris GL, Black HR, et al. Seventh report of the Joint National
Committee on Prevention, Detection, Evaluation, and Treatment of High Blood Pressure. Hypertension 2003;42(6):1206-1252.
17
39. Egger SS, Ratz Bravo AE, Hess L, Schlienger RG, Krahenbuhl S. Age-related differences in the prevalence of potential drug-drug interactions in ambulatory dyslipidaemic patients treated with statins. Drugs & Aging 2007;24(5):429-440. 40. Friberg J, Buch P, Scharling H, Gadsbphioll N, Jensen GB. Rising rates of hospital
admissions for atrial fibrillation. Epidemiology 2003;14(6):666-672.
41. Mazer-Amirshahi M, Mullins PM, Rasooly I, van den Anker J, Pines JM. Rising opioid prescribing in adult U.S. emergency department visits: 2001-2010. Acad Emerg Med 2014;21(3):236-243.
42. Olsen Y, Daumit GL, Ford DE. Opioid prescriptions by U.S. primary care physicians from 1992 to 2001. J Pain 2006;7(4):225-235.
43. Haasum Y, Fastbom J, Fratiglioni L, Kareholt I, Johnell K. Pain treatment in elderly persons with and without dementia: a population-based study of institutionalized and home-dwelling elderly. Drugs & Aging 2011;28(4):283-293.
44. Johnell K, Weitoft GR, Fastbom J. Sex differences in inappropriate drug use: a register-based study of over 600,000 older people. Ann Pharmacother 2009;43(7):1233-1238. 45. von Strauss E, Aguero-Torres H, Kareholt I, Winblad B, Fratiglioni L. Women are more
disabled in basic activities of daily living than men only in very advanced ages: a study on disability, morbidity, and mortality from the Kungsholmen Project. J Clin Epidemiol 2003;56(7):669-677.
46. Koopmans GT, Lamers LM. Gender and health care utilization: the role of mental distress and help-seeking propensity. Soc Sci Med 2007;64(6):1216-1230.
47. Grace AR, Briggs R, Kieran RE, et al. A Comparison of Beers and STOPP Criteria in Assessing Potentially Inappropriate Medications in Nursing Home Residents Attending the Emergency Department. J Am Med Dir Assoc 2014;15(11):830-834.
48. Haasum Y, Fastbom J, Johnell K. Institutionalization as a risk factor for inappropriate drug use in the elderly: a Swedish nationwide register-based study. Ann Pharmacother 2012;46(3):339-346.
49. Parsons C, Johnston S, Mathie E, et al. Potentially inappropriate prescribing in older people with dementia in care homes: a retrospective analysis. Drugs & Aging 2012;29(2):143-155.
18
TABLE 1: Characteristics of participants in the KP cohort (1987) and the SNAC-K cohorts (2001 and 2007) Characteristics KP (1987) SNAC-K (2001) SNAC-K (2007) No. of participants n (%) 1517 (100) 1581 (100) 1206 (100) Age in years, n (%) 78 389 (25.6) 461 (29.2) 351 (29.1) 81 369 (24.3) 236 (14.9) 194 (16.1) 84 297 (19.6) 224 (14.2) 288 (23.9) 87 221 (14.6) 174 (11.0) 127 (10.5) 90 152 (10.0) 251 (15.9) 102 (8.5) 93 66 (4.4) 135 (8.5) 62 (5.1) 96 20 (1.3) 70 (4.4) 52 (4.3) 99+ 3 (0.2) 30 (1.9) 30 (2.5) Female gender, n (%) 1174 (77.4) 1158 (73.2) 828 (68.7) Educational level*, n (%)
Elementary school (0-7 yrs) 811 (54.0) 437 (28.1) 221 (18.5) Vocational/high school (8-14 yrs) 605 (40.3) 835 (53.8) 635 (53.1) University (15+ yrs) 85 (5.7) 281 (18.1) 340 (28.4) Marital status, n (%)** Single 1163 (76.7) 1132 (71.6) 787 (65.3) Living situation, n (%)*** At home Live alone Service building† Nursing home 1294 (85.3) 896 (69.8) 92 (6.1) 131 (8.6) 1300 (82.2) 893 (68.7) 101 (6.4) 180 (11.4) 1048 (87.0) 649 (61.9) 51 (4.2) 106 (8.8) MMSE mean score (SD) †† 24.2 (±6.5) 24.9 (±7.6) 25.3 (±6.6)
Abbreviations: KP=Kungsholmen Project; SNAC-K=Swedish National study on Aging and Care in Kungsholmen.
* missing education for 16 persons (KP); missing education for 28 persons (2001); missing education for 10 persons (2007); ** missing marital status for 1 person (2001); missing marital status for 1 person (2007); *** missing living situation for 1 person (2007);
† individual apartments with communal facilities with medically-skilled staff. Usually there are also a restaurant, a day center, and activity rooms in the building; †† missing MMSE score for 1 person (2007).
19
TABLE 2: Drug utilization according to the ATC system in the KP cohort (1987) and the SNAC-K cohorts (2001 and 2007)
ATC-coding* KP (1987) n (%) SNAC-K** (2001) n (%) SNAC-K (2007) n (%) A Alimentary tract and metabolism 613 (40.4) 848 (53.6) 711 (59.0) B Blood and blood forming organs 182 (12.0) 813 (51.4) 700 (58.0) C Cardiovascular system 805 (53.1) 961 (60.8) 828 (68.7)
D Dermatologicals 41 (2.7) 80 (5.1) 127 (10.5)
G Genito-urinary system and sex hormones
82 (5.4) 288 (18.2) 221 (18.3)
H Systemic hormonal preparations, excluding sex hormones and insulins
130 (8.6) 275 (17.4) 227 (18.8)
J Antiinfectives for systemic use 22 (1.5) 49 (3.1) 57 (4.7) L Antineoplastic and
immunemodulating agents
12 (0.8) 31 (2.0) 52 (4.3)
M Musculo-skeletal system 200 (13.2) 287 (18.2) 307 (25.5)
N Nervous system 777 (51.2) 928 (58.7) 820 (68.0)
P Antiparasitic products, insecticides and repellents
37 (2.4) 18 (1.1) 10 (0.8)
R Respiratory system 172 (11.3) 235 (14.9) 228 (18.9)
S Sensory organs 93 (6.1) 192 (12.1) 166 (13.8)
V Various 0 0 0
Abbreviations: KP=Kungsholmen Project; SNAC-K=Swedish National study on Aging and Care in Kungsholmen.
* Anatomical Therapeutic Chemical (ATC) Classification System
1 TABLE 3: Drug utilization by residential setting in the KP cohort (1987) and the SNAC-K cohorts (2001 and 2007)
Drug utilization Living conditions
All At home Service building Nursing home
KP 1987 n=1517 n=1294 n=92 n=131 Mean no of drugs (SD) 3.2 (±2.6) 3.1 (±2.6) 4.2 (±2.8) 3.4 (±2.3) Median no of drugs 7.5 7.5 5.5 6.0 Polypharmacy* 409 (27.0%) 336 (26.0%) 41 (44.6%) 32 (24.4%) SNAC-K 2001** n=1581 n=1300 n=101 n=180 Mean no of drugs (SD) 5.2 (±3.5) 4.9 (±3.4) 6.3 (±3.7) 6.9 (±3.2) Median no of drugs 10.5 10.0 8.0 8.0 Polypharmacy* 846 (53.9%) 638 (49.1%) 67 (66.3%) 141 (78.3%) SNAC-K 2007 n=1206† n=1048 n=51 n=106 Mean no of drugs 6.4 (±3.9) 5.9 (±3.7) 8.3 (±4.0) 10.3 (±4.0) Median no of drugs 11.0 9.5 8.0 11.0 Polypharmacy* 788 (65.3%) 645 (61.5%) 42 (82.4%) 101 (95.3%) Abbreviations: KP=Kungsholmen Project; SNAC-K=Swedish National Study on Aging and Care in Kungsholmen.
* concurrent utilization of five or more drugs.
** missing information on drug utilization for 11 persons in SNAC-K 2001. † missing living situation for 1 person (2007).
1 TABLE 4: Prevalence (per 100 population) and odds ratios (ORs) with 95% confidence intervals (CIs) of utilization of analgesics and psychotropic drugs in the KP cohort (1987) and the SNAC-K cohorts (2001 and 2007)
No. of Prevalence (95% CI) OR (95% CI)
cases Crude Crude Adjusted*
Analgesics Men KP 1987 55 16.0 (12.2-19.9) 1.0 (Ref.) 1.0 (Ref.) SNAC-K 2001 81 19.1 (15.4-22.9) 1.2 (0.9-1.8) 1.4 (0.9-2.1) SNAC-K 2007 125 33.2 (28.4-37.9) 2.6 (1.8-3.7) 3.0 (2.1-4.4) Women KP 1987 296 25.2 (22.7-27.7) 1.0 (Ref.) 1.0 (Ref.) SNAC-K 2001 417 36.0 (33.2-38.8) 1.7 (1.4-2.0) 1.6 (1.4-2.0) SNAC-K 2007 426 51.4 (48.0-54.8) 3.1 (2.6-3.8) 3.4 (2.7-4.1) Total KP 1987 351 23.1 (21.0-25.3) 1.0 (Ref.) 1.0 (Ref.) SNAC-K 2001** 498 31.5 (29.2-33.8) 1.5 (1.3-1.8) 1.6 (1.4-1.9) SNAC-K 2007 551 45.7(42.9-48.5) 2.8 (2.4-3.3) 3.3 (2.8-4.0) Psychotropics Men KP 1987 92 26.8 (22.1-31.5) 1.0 (Ref.) 1.0 (Ref.) SNAC-K 2001 122 28.8 (24.5-33.2) 1.1 (0.8-1.5) 1.2 (0.9-1.7) SNAC-K 2007 116 30.8 (26.1-35.4) 1.2 (0.9-1.7) 1.3 (0.9-1.8) Women KP 1987 496 42.2 (39.4-45.1) 1.0 (Ref.) 1.0 (Ref.) SNAC-K 2001 543 46.9 (44.0-49.8) 1.2 (1.0-1.4) 1.2 (1.0-1.4) SNAC-K 2007 400 48.3 (44.8-51.7) 1.3 (1.1-1.5) 1.3 (1.1-1.6) Total KP 1987 588 38.8 (36.3-41.2) 1.0 (Ref.) 1.0 (Ref.) SNAC-K 2001** 665 42.1 (39.6-44.5) 1.1 (1.0-1.3) 1.2 (1.0-1.4) SNAC-K 2007 516 42.8 (40.0-45.6) 1.2 (1.0-1.4) 1.3 (1.1-1.6)
Abbreviations: KP=Kungsholmen Project; SNAC-K=Swedish National Study on Aging and Care in Kungsholmen.
*Adjusted for age, gender, education, and cognition (MMSE); ** missing information on drug utilization for 1 man and 10 women in SNAC-K 2001.
2 FIGURE 1. Study population, drop out according to cause and examined participants in the KP cohort (1987) and the SNAC-K cohorts (2001 and 2007).
3
2A.
B.
Abbreviations: KP=Kungsholmen Project; SNAC-KK=Swedish National Study on Aging and Care in Kungsholmen.
FIGURE 2. Prevalence of drug utilization (mean number of drugs) by age and gender (2A), and frequency distribution of total number of drugs (2B), in the KP cohort (1987) and the SNAC-K cohorts (2001 and 2007).