1
A NOVEL APPROACH FOR DIAGNOSING ROAD SAFETY ISSUES
USING AUTOMATED COMPUTER VISION TECHNIQUES
Tarek Sayed, Ph.D., P.Eng.
Professor, Department of Civil Engineering, University of British Columbia 6250 Applied Science Lane, Vancouver, BC, Canada V6T 1Z4
E-mail: tsayed@civil.ubc.ca Mohamed H. Zaki, Ph.D.
Post-Doctoral Fellow, Department of Civil Engineering, University of British Columbia 6250 Applied Science Lane, Vancouver, BC, Canada V6T 1Z4
E-mail: mzaki@civil.ubc.ca Jarvis Autey, MSc.
Research Assistant, Department of Civil Engineering, University of British Columbia, 6250 Applied Science Lane, Vancouver, BC, Canada V6T 1Z4
E-mail: jarvisa@interchange.ubc.ca
ABSTRACT
The use of traffic conflicts for safety diagnosis has been gaining acceptance as a surrogate for collision data analysis. The traffic conflicts approach provided better understanding of collision contributing factors and the failure mechanism that leads to road collisions. This paper demonstrates an automated proactive safety diagnosis approach for vehicles, pedestrian and cyclists using video-based computer vision techniques. Traffic conflicts are automatically detected and several conflict indicators such as Time to collision (TTC) are calculated based on the analysis of the road-user positions in space and time. Additionally, spatial violations are detected based on the non-conformance of road users to travel regulations. Several case studies are described. The first case study deals of the safety analysis of a newly installed bike lane at the southern approach of a heavy volume Bridge in Vancouver, British Columbia. The results showed a high exposure of cyclists to traffic conflicts. Practical solutions to address the safety issues at the location were presented. The second case study deals with a major signalized intersection where concerns were raised regarding the high conflict rate between vehicles and pedestrians as well as an elevated number of traffic violations (i.e., jaywalking) at the intersection. Conflicts and violations were identified and pedestrian safety countermeasures were presented. The third case study deals with a before-after (BA) safety evaluation of a newly proposed design for channelized right-turn lanes at intersections. The new design, termed “Smart Channels”, decreases the angle of the channelized right turn to approximately 70 degrees. The results of the evaluation show that the implementation of the right-turn treatment has resulted in a considerable reduction in the severity and frequency of merging, rear-end, and total conflicts. Overall, the three case studies demonstrate the considerable potential of using video-based computer vision techniques for automated road safety analysis based on traffic conflicts.
2
costly. Video sensors are now advocated as alternative data collection procedure, solving many issues in the manual data collection and providing a more reliable and efficient way to capture, store and analyze traffic information. The accurate estimation of exposure as well as other quantities fundamental to road safety analysis, e.g. severity of a traffic interaction, can greatly benefit by analyzing road users' positions in space and time, i.e. trajectories [4].Video data is supported with practical computer vision applications (CV) to aid in the analysis of traffic scenes.
This paper demonstrates an automated proactive safety diagnosis approach for vehicles, pedestrian and cyclists using video-based computer vision techniques. Traffic conflicts are automatically detected and several conflict indicators such as Time to collision (TTC) are calculated based on the analysis of the road-user positions in space and time. Additionally, spatial and temporal violations are detected based on the non-conformance of road users to travel regulations. Three case studies are described. The first case study deals of the safety analysis of a newly installed bike lane at the southern approach of a heavy volume Bridge in Vancouver, British Columbia and practical solutions to address the safety issues at the location were presented. The second case study deals with a major signalized intersection in Vancouver where concerns were raised regarding the high conflict rate between vehicles and pedestrians as well as an elevated number of traffic violations (i.e., jaywalking) at the intersection. Conflicts and violations were identified and pedestrian safety countermeasures were presented. The third case study deals with a before-after (BA) safety evaluation of a newly proposed design for channelized right-turn lanes at intersections. The new design, termed “Smart Channels”, decreases the angle of the channelized right turn to approximately 70 degrees.
2 THE VIDEO ANALYSIS APPROACH
The safety analysis is performed using a video analysis procedure using computer vision, developed at the University of British Columbia. The video analysis system automatically detects, classifies, and tracks road users and interprets their movement. For road safety applications, the proposed approach relies on the building of two databases: a trajectory database, where the results of the video processing module are stored, and an interaction database, where all interactions between road users within a given distance are considered, and for which various conflict indicators can be automatically computed. Identifying road-users
3
behavior, traffic violations, traffic conflicts and measuring other traffic parameters can be achieved through mining these databases [4] .
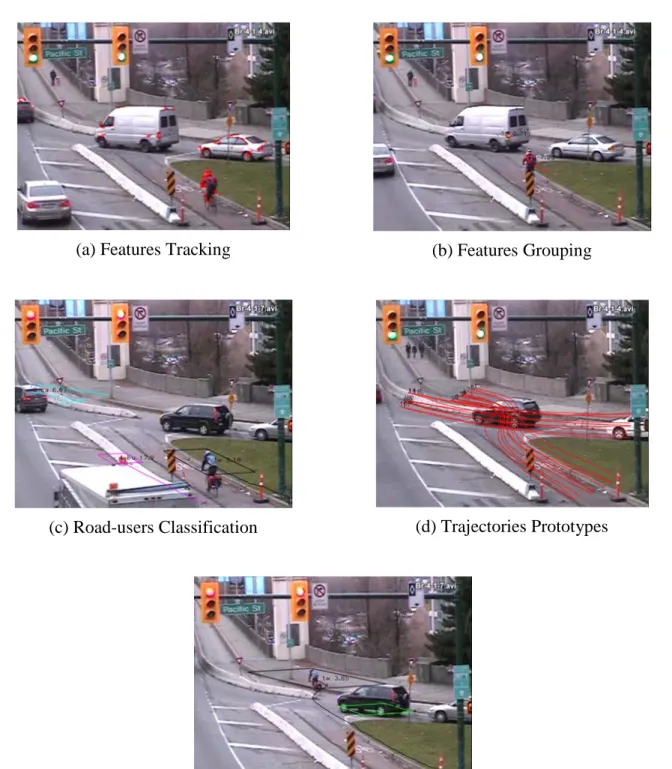
Road-Users Detection: The automated video analysis relies on computer algorithms to differentiate between features of road users and features that are part of the environment [5]. Features are identified and tracked using an implementation of the Kanade-Lucas-Tomasi Feature Tracker algorithm [5]. Feature-based tracking identify distinguishable features (e.g. window corners, bumper edges) on the moving object. (See Figure 1.a). Since a moving object can have multiple features, the next step is to group the features, using spatial and temporal cues. (See Figure 1.b). The subsequent step in the road-users detection is the road-users classification. The objects trajectories hold features that reveal the structure of the traffic movements and provide important clues to the characteristics of the road-users (e.g. pedestrian ambulation, cyclist pedaling, maximum speed). Such information provides a basis for a classification decision procedure (See Figure 1.c). The road-users tracking and classification accuracy were presented in [6] and [7] where tracking error was reported to be satisfactory low.
Camera Calibration: The positional analysis of road users requires accurate estimation of the camera parameters. Camera calibration is the process of determining the homography matrix of a camera angle, and is necessary for tracking vehicles in the camera image and relating these tracks to positions in the real-world. Each calibration process begins with the user annotating features in the camera image and in an aerial, orthographic image of the intersection. Details of the adopted mixed-feature camera calibration approach are presented in [8].
Safety Analysis: The adapted safety analysis provides an operational interpretation to automatically capture the traffic conflicts between road-users. The implementation relies on matching the trajectories to prototypical trajectories from the full set of previously learned motion patterns [4]. (See Figure 1.d). The prototypes provide a set of predicted future positions with associated probabilities of occurrence. Conflicts between road-users can then be determined by evaluating if any of these future positions coincide spatially and temporally with other road-users (See Figure 1.e). Details of the procedure are explained in [4]..
In this paper, the measure of proximity is Time to Collision (TTC). TTC is continually calculated between conflicting road-users. The minimum TTC, is then extracted from this set to indicate the maximum severity of this interaction. In this paper, only traffic events with associated minimum TTC of less than 3 seconds are considered for the safety evaluation. This value was selected based on the work in [3]. Other conflict indicators are also used to capture different proximity aspects. Post-Encroachment Time (PET) [9] is defined as the time difference between the moment an offending road user leaves an area of potential collision and the moment of arrival of a conflicted road user possessing the right of way. PET is considered as a suitable safety measure between turning vehicles and pedestrians [7].
4
(a) Features Tracking (b) Features Grouping
(c) Road-users Classification (d) Trajectories Prototypes
(e) Event Detection
5
3 CASE STUDY 1: DIAGNOSING SAFETY ISSUES OF
VEHICLES-BICYCLES INTERACTIONS USING AUTOMATED COMPUTER VISION
ANALYSIS
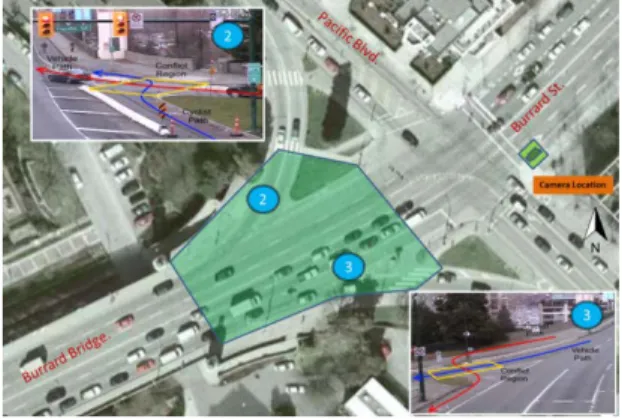
The intersection analyzed in this study was selected because of perceived high rate of conflicts between vehicles and cyclists. Figure 2 illustrates the conflicts regions for typical trajectories of the road-users. Right-turning vehicles in the ramp should yield for bicycles travelling southbound to the Burrard Street Bridge. However, the current configuration limits the available sight distance leading to severe conflicts. For the northbound approach of the intersection, a large portion of northbound cyclists will go off ramp onto another bike lane. Yet, some cyclists will have to cut through the vehicles right-turn lane in order to take the through lane towards Burrard Street.
Figure 2. Possible Conflicts Regions for Vehicles-Bicycles Interactions
4 SUMMARY OF FINDINGS
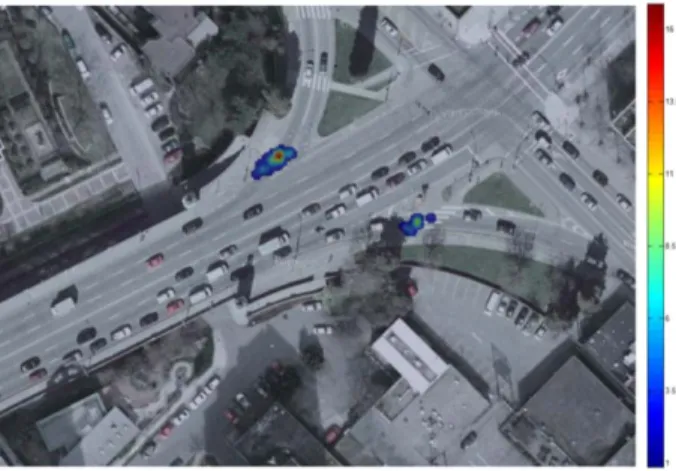
Traffic conflicts between vehicles and bicycles at both approaches of the intersection are automatically identified. Conflict analysis includes identifying conflict frequency, severity and location (conflict points). Distribution of the vehicle-bicycle conflicts (with a minimum TTC smaller than 3 seconds) by heat mapping is shown in Figure 3. Those conflicts considered of high severity were carefully analyzed leading to recommended safety countermeasures as will describe later.
6
Figure 3: Conflicts Frequency Heatmaps (Conflicts/m2) for the Burrard & Pacific Intersection
Tables 1 shows a breakdown of the number of cyclist-vehicle conflicts by type and severity. For southbound traffic, the majority of the conflicts are between vehicles non-conforming to the yielding signage and the cyclists arriving from the Burrard Street bike lane and crossing towards the Burrard Bridge bike lane. This is attributed likely to the limited sight angle for the drivers who in most cases are not aware to the arrival of cyclists. Out of the 229 cyclists, 72 were in conflicts with vehicles as shown in Table 1, that is 31.44 percent of the cyclists. On the northbound approach, according to Table 1, 35 cyclists were in conflicts that 23 percent of cyclists traveling northbound. It is worth mentioning that only out of 149 cyclists; only 39 chose to travel on the bike lane crossing the vehicles heading to Burrard Street, while the remaining majority (110) chose an alternative safer path by going straight on the sidewalk.
The analysis of important events such as conflicts led to the proposal of some recommendations that can act as safety countermeasures. One recommendation is better signage and road markings. Cyclists crossing area should be clearly strip marked to indicate that vehicles should not stop in this area.
Table 1: Cyclist-Vehicle Conflicts for Burrard & Pacific Intersection
Conflicts
Southbound Bikes and Right-turn Vehicles (Camera angle 2)
Northbound Cyclists and Right-turn (Camera angle 3)
TTC range # Events # Events
0-1 seconds 34 19
1-2 seconds 23 16
2-3 seconds 15 0
7
Case Study 2: Application of Computer Vision to the Diagnosis of Pedestrian
Safety Issues
The intersection analyzed in this study was selected because of a perceived high rate of conflicts between vehicles and pedestrians [10]. The site in the study is a busy eastside downtown intersection located at East Hastings and Main Streets as shown in Figure 4. There are several factors that affect safety at this location, including a high pedestrian volume with considerable crossing violations and jay walking. Four camera angles were selected for this location. Camera position 1 focused on area to the immediate east of the intersection, with the camera pointed southwards. The main movements observed in the scene are the eastbound through and northbound right turning vehicles (Figure 4). Two conflict types were considered in this view: northbound right turn vehicles with east-west crossing pedestrians and eastbound through vehicles with north-south crossing pedestrians. Camera position 2 pointed southwards to cover the south west segment of the intersection, capturing pedestrian crossings with southbound traffic at the southward crossing along Hastings Street. This camera position also captured conflicts between north-south pedestrians on the western crossing along Main St. with eastbound traffic. Camera position 3 complements the previous position by capturing the remaining part of the pedestrian western crossing along Main St. It also covers the western segment of the northern pedestrians crossing along Hastings St. Camera position 4 captures the mid-block pedestrian’s violations (jaywalking).
5 SUMMARY OF FINDINGS
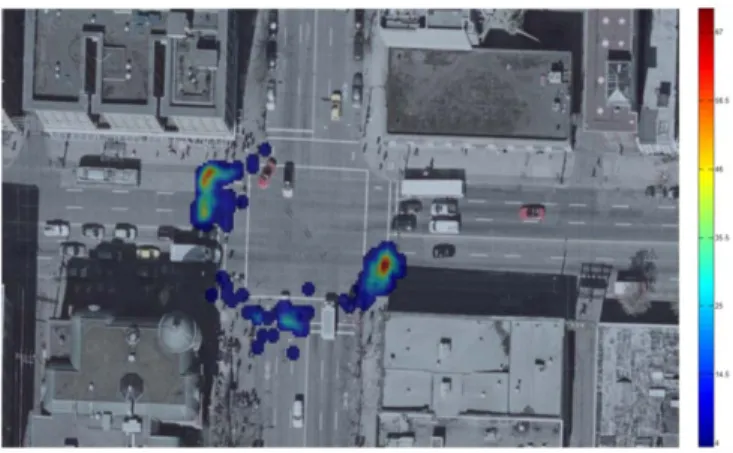
Traffic conflicts between vehicles and pedestrians at the intersection were automatically identified. The heat map in Figure 5 shows the intensity of the vehicle-pedestrian conflicts at the intersection (conflicts/m2). Safety diagnosis is supported with an automated pedestrian violations (jaywalking) detection mechanism.
8
Figure 4: East Hastings St. and Main St. Intersection
It is observed that the majority of conflicts occur between right-turning or left turning vehicles and crossing pedestrians. Each of these turning movements can legally be undertaken during the pedestrian’s walk phase, provided pedestrians are given the right of way. All of the pedestrian conflicts occur due to either vehicles ignoring the pedestrian’s right of way, or pedestrians entering the crosswalk after the walk phase. Pedestrians crossing in the east approach are involved in frequent conflicts. Eastbound right turning vehicles and north bound pedestrians also frequently interact at the curb, when pedestrians first step into the crosswalk. Note that the left turn movement from the Northern approach is prohibited. From Camera location 2, it is observed that southbound right turning vehicles coming from the western approach on Hastings Street have a high occurrence of conflicts. More frequent than right turning pedestrian conflicts, left turning pedestrian interactions produce a number of severe conflicts as shown in Figure 5. As left turning vehicles have few available gaps, they often make their turn without first checking for clearance. A number of instances also occur when pedestrians enter the crosswalk near the end of the phase and conflict with late left turning vehicles. Similar conflicts patterns were observed from Camera Location 3, where turning vehicles were in conflicts with late crossing pedestrians. Figure 6.a shows the hourly variations in conflicts frequency throughout the day. To further understand the severity of conflicts between pedestrians and turning vehicles, PET is calculated for the detected events (See Figure 6.b). PET calculations show the high risk for pedestrians when they are in a conflicting situation with vehicles [7].
The subsequent step in the safety analysis is to identify violating pedestrians. This is performed by comparing the pedestrian tracks against a given set of prototypes tracks representing standard pedestrian movements’ patterns. Any significant disagreement between both sequences of positions is interpreted as evidence that the given track represents the
9
movement of a road user performing a traffic violation. The matching relies on an LCSS similarity measure between the movement prototypes and the trajectories to make decision about the violation detection [11]. Results showed a high level of jaywalking by pedestrians was detected in the mid-block region (33 percent of pedestrians are crossing illegally). As expected, the westbound approach has an increasing number of violations. In fact, according to an earlier study [10] this segment was identified as the highest pedestrian collision-prone area in Greater Vancouver.
Figure 5: Pedestrian-Vehicle Conflicts Frequency Heatmap
(a) Conflicts (with calculable TTC) Frequency Hourly Variation for the Intersection
10
(b) Distributions of the PET for the combined set of events at the intersection Figure 6: Conflicts Distributions
Case Study 3: Before-After safety evaluation of right-turn “Smart Channels”
In 2009, the British Columbia Ministry of Transportation and Highways started a pilot project to evaluate the safety performance of Smart Channels. The Smart Channels (Figure 7) design has recently been proposed as an alternative right- turn design with a higher level of pedestrian crossing safety. The goal is to reduce the pedestrian crossing distance which can lead to shorter distance exposure, shorter signal cycles, and reduced potential for pedestrians to be in conflict with vehicles. The benefits also extend to vehicle-vehicle interactions since the new approach angle affords drivers a better view of the traffic stream they are to merge with.
Three channelized right-turn lanes in Penticton, BC, were converted to Smart Channels in the summer of 2010. The treatment locations, Duncan, Warren and Green Avenues, are all cross streets to the major thoroughfare, Channel Parkway. At all three locations no dedicated merging lane was provided on the highway; vehicles were required to merge at the end of the channelized right, immediately downstream of the intersection. Turning vehicles were instructed to yield to highway traffic by installed “yield” signage. The realignment treatment, shown in Figure 7, decreased the angle of the channelized right between the termination of the right-turn lane and Channel Parkway. The yield signage remained for the right-turn lane.
Data was gathered two days before and two days after at the three locations, as well as at a control site. A control (comparison) site at the intersection of West Bench Hill Road and Eckhardt Avenue was studied in addition to the treatment sites to account for changes in accident causal factors beyond the treatments. The effects observed at the treatment sites were then compared to those at the control site. At the treatment intersections, one camera was used to gather video data of the merging section, while a second camera was focused on the queue of vehicles waiting to turn right.
11
Figure 7: The treatment locations, Duncan, Warren and Green Avenues
Summary of Findings
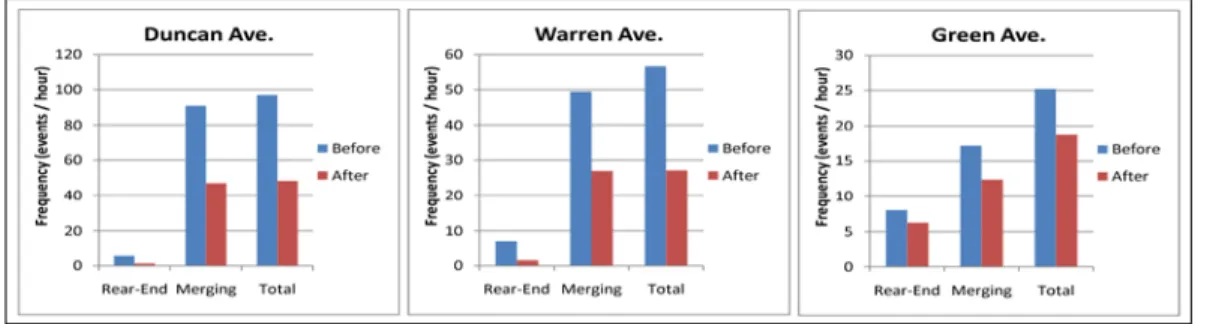
TTC conflict indicator was used in the study for conflict identification. Comparison is then made with the control site to account for non-treatment conflict causal factors. The intersections of Duncan Avenue and Warren Avenue show consistent improvements between the two intersections: reductions of approximately 75 percent in rear-end conflicts, 45 percent in merging, and 50 percent in total conflicts. Reductions in conflicts at the Green Avenue intersection were less dramatic, ranging from 22 percent to 28 percent (Figure 8).
Figure 8: The frequency and cumulative distributions of conflicts at the treated intersection before and after the treatment
In BA traffic safety applications, the conditions pre- and post-treatment at the site are compared to the conditions at a set of control or reference sites over a similar time period. The Treatment Effects for Duncan and Warren Avenues show an AHC reduction of approximately 55 percent for total conflicts. Green Avenue had a Treatment Effect of a reduction in AHC of approximately 35 percent for total conflict types. Over all three treatment sites a reduction of 67 percent, significant at the 90th percentile was observed. Merging and total conflicts were reduced by 48 percent and 51 percent respectively, both significant at the 99th percentile.
12
This paper presented application of a proactive safety diagnosis procedure where video analysis is employed to automatically identify and analyses serious events such as traffic conflicts and violations. The procedure was applied to the safety analysis of a newly installed bike lane at the entrance of the southern approach of a major Bridge in Vancouver, British Columbia. The results showed a high exposure of bicycles to traffic conflicts. The study also presented potential countermeasures to address the safety issues at the location. The paper also demonstrated the safety evaluation of a location considered to be high risk for pedestrian crossing in Vancouver downtown. The diagnosis identified the safety concerns at this site by locating the most dangerous segments in the intersection. The diagnosis also revealed an estimation of the jaywalking rate at the facility. Generally, two recommendations can be offered at this intersection for improving pedestrian safety. The first includes measures to provide higher level of safety for the crossing pedestrians such as signal changes, construction of pedestrian refuge islands, and potentially prohibiting left turns. The second is increasing the level of enforcement and to reduce pedestrian non-conforming crossing behaviour including jay walking. The experimental results presented in this paper also demonstrated the usefulness of using computer vision techniques for traffic conflicts analyses in BA safety evaluation. The third case study deals with a BA safety evaluation of a newly proposed design for channelized right-turn lanes at intersections. The results of the evaluation show that the implementation of the right-turn treatment has resulted in a considerable reduction in the severity and frequency of merging, rear-end, and total conflicts.
Further development is desired along the analysis procedure. That includes further enhancement and adoption of more accurate road-users tracking and classification. Other developments include the calculation of other severity indicators (e.g., gap-time) to provide more cues for the underlying level of safety of the facility and to set a connection to other safety standard indicators like collision frequency [13]. Future work will also include evaluation of the practicality of the proposed approach can only be achieved through the thorough applications to additional case studies sites.
13
BIBLIOGRAPHY
[1] A. Tarko, G. Davis, N. Saunier, T. Sayed and S. Washington, "Surrogate measures of safety," TRB White Paper , 2009.
[2] F. Amundsen and C. Hydén, "Proceedings of the First Workshop on Traffic Conflicts," in
Lund Institute of Technology, 1977.
[3] T. Sayed and S. Zein, "Traffic conflict standards for intersections," Transportation Planning
and Technology, vol. 22, p. 309–323, 1999.
[4] N. Saunier, T. Sayed and K. Ismail, "Large Scale Automated Analysis of Vehicle Interactions and Collisions," Transportation Research Record: Journal of the
Transportation Research Board, vol. 2147, pp. 42-50, 2010.
[5] N. Saunier and T. Sayed, "A Feature-Based Tracking Algorithm for Vehicles in Intersections," in Third Canadian Conference on Computer and Robot Vision, 2006.
[6] M. H. Zaki and T. Sayed, "Automated Classification of Road-User Movement Trajectories," in CSCE International Transportation Specialty Conference, Edmonton, AB, 2012.
[7] K. Ismail, T. Sayed and N. Saunier, "Automated Analysis Of Pedestrian-vehicle Conflicts: A Context For Before-and-after Studies.," Transportation Research Record: Journal of
Transportation Research Board, vol. 2198, pp. 52-64, 2010.
[8] K. Ismail, T. Sayed and N. Saunier, "A Methodology for Precise Camera Calibration for Data Collection Applications in Urban Traffic Scenes," Canadian Journal of Civil
Engineering, vol. 40, no. 1, pp. 57-67, 2013.
[9] J. Archer, "Methods for the Assessment and Prediction of Traffic Safety at Urban Intersections and their Application in Micro-simulation Modelling," Ph.D Thesis, Royal Institute of Technology, Sweden, 2004.
[10] J. Cinnamon, N. Schuurman and S. Hameed, "Pedestrian Injury and Human Behaviour: Observing Road-Rule Violations at High-Incident Intersections," PLoS ONE, vol. 6, no. 7, 2011.
[11] M. Zaki, T. Sayed, K. Ismail and F.Alrukaibi, "Use of Computer Vision to Identify Pedestrians' Nonconforming Behavior at Urban Intersections,," Transportation Research
Record: Journal of the Transportation Research Board, vol. 2279, pp. 54-64, 2012.
[12] J. Autey, T. Sayed and M. Zaki, "Safety Evaluation Of Right-turn Smart Channels Using Automated Traffic Conflict Analysis," Accident Analysis and Prevention, vol. 45, pp. 120-130, 2012.
[13] K. El-Basyouny and T. Sayed, "Safety performance functions using traffic conflicts," Safety