ISSN 0347-6049
i V//särtryck
126 1988
Collective risk but individual safety
Kåre Rumar
Reprint from Ergonomics, 1988, Vol. 31, No. 4, 507-518
v, Väg-och Trafik-
Statens väg- och trafikinstitut (VT!) * 581 01 Linköping
ERGONOMICS, 1988, VOL. 31, NO. 4, 507 518
Collective risk but individual safety
KARE RUMARSwedish Road and Traffic Research Institute,
Linköping, Sweden
Keywords: System risk; User safety; Driver models; Driver behaviour. Everybody attempting to reduce road accidents knows that participation in road traf c presents one of the major everyday risks for many people. Road traf c authorities may use carefully assessed risks in their ght against road accidents. These risk measures may be used to relate traffic problems to nancial resources. But, too often, objective risk measures are not used rationally. Why not?
One of the main reasons is that the public and individual drivers do not accept countermeasures based on these risk indices. They do not understand the motives for repressive measures. This public reaction is something that politicians must be, and are, sensitive to. It seems as if drivers are irrational. But are they really?
Here we are facing one of the most dif cult problems of road safety work. Most individual drivers and other road users do not experience the risks evidenced by accident statistics. Individual levels of perceived risk are low. But that is also true for certain experienced risks, e.g. lightning. The main problem is probably that individual drivers have inadequate, or even positive, feedback (reward, reinforcement) of their unsafe behaviour. Thus they falsely think they have full control of what is happening in traffic. They are aware of risks, but they believe
they can avoid most of them. Others, who are not as skilled, become involved and
it is these people whose behaviour is re ected by the accident statistics. They themselves are safe and run no risk. If that is the experience and opinion of most drivers, how can we motivate them to behave more safely?
1. Transport goals
The evolution from an agricultural to an industrial society has, to a large extent, been made possible by an enormous improvement in transport efficiency. The ability to move raw material from distant sources to factories, to move products from factories and farms to consumers, to move workers from their homes to workplaces and back again, is the basis for this revolution. But it also means that we have become very dependent on transport. Society would not function without it. Therefore it is quite natural that transport-related activities constitute a large proportion of the gross national product in developed countries: about 15%. '
Consequently the primary goals for transport are ef ciency and effectiveness of mobility. We want to move large quantities of goods and people large distances in a short time. But transport also has certain secondary goals. We do not accept transport at any price. We want to minimize its negative effects. We require a certain amount of economy and safety and we do not accept too many negative environ-mental effects. The goals of transport are thus:
(1) Transport effectiveness (2) Transport economy (3) Transport safety
508 K. Rumar
This simpli ed description of the goals of transport applies at both the societal and the individual-user levels. For any transport politician, one of the most dif cult political problems is to weigh these goals against each other. It is dif cult, because all four goals are attractive and because almost every activity, every decision, affects all four goals; but in different directions. Every individual driver is faced with the same problem; but he is normally not fully aware of it. He makes decisions such as whether to drive, when to drive, which way to drive and perhaps most important, how fast to drive. All these decisions could be seen as resulting from the conscious or unconscious weighing of the above four goals.
The weight given to each of these goals and the internal rank-ordering of the three secondary goals varies at both the societal and the individual level. For example: in developing countries the predominant problem is to reach a reasonable level of effectiveness. There are of course economic problems, but very few weighting problems. In developed countries the primary goal is, of course, the same, but weighting among the other four goals is an important problem in its own right.
Among driver groups, the effectiveness goal probably has the highest relative weight for young male drivers. Elderly drivers may give the economy goal a relatively higher weight and female drivers seem to give relatively higher weight to the safety goal. For professional drivers, who sit in their vehicles much longer, comfort may be rated more important. But the ranking of these goals also varies over time for
individual drivers. In some situations, e. g. when the driver is late for a meeting, the
time goal is very important. In other situations, e.g. when there is a shortage of petrol, the economy goal gets a relatively high weighting.
2. Transport system risk
Another way of expressing the safety goal is to specify an acceptable transport risk. On the aggregated, e. g. national level, this could be done in terms of the probability of accidents or the consequences of accidents, normally both, e.g. the probability of fatal or serious injury. Transport risk at the individual level means, in theory, the same thing, but in reality, to the individual road user, it is something quite different.
Let us look at the international road safety situation from a risk point of view. In order to get a risk measure we need both the frequency of the relevant accidents and the frequency with which the relevant activity occurs. The most reliable accident measure is probably the number of persons killed in road traffic in e.g. a year. No doubt this measure still contains several sources of systematic error: more in some countries than in others. But there is nothing better available. A reliable international measure of risk exposure available in most countries is even harder to nd. The number of kilometres driven per annum is a good measure, but is only available in some countries. The number of cars in a country is certainly one of the better and generally available measures of exposure to risk.
If we use these two measures (International Road Federation 1985) to ask the somewhat unusual question: how many cars are needed in various countries to kill a person every year, then we get the following rounded up values (table 1) that, in spite of several errors due to other differences can be said to be a kind of national road system risk measure.
There are several things that are striking in this table. First, the huge differences in risk level especially between the three groups of nations with different levels of motorization. Second, the very large risks per car that exist in the developing
Collective risk but individual safety 509
Table 1. Number of cars needed to kill a person every year in countries with different levels of motorization.
Sweden 4500
USA 4000
England 3500 > 30 cars per 100 inhabitants
Germany 3000
France 2500
Greece 1000
Hungary 1000 ~ 10 cars per 100 inhabitants
Portugal 1000
Venezuela 700
Korea 125
Kenya 100
Ethiopia 75 <l car per 100 inhabitants
Pakistan 60
Nigeria 35
countries. In Nigeria, every 35th car kills a person every year! Third, the considerable level of risk consistency among countries with a similar extent of motorization.
This is an example of a very rough use of accident statistics. With more re ned methods, many countries now analyse their road-traf c risk situation in detail. The risk level is calculated for various road user groups, road types, vehicle types, traf c situations, weather conditions, time of the year and of the day, etc. The gures are used to rank the countermeasure priorities and to allocate resources for the various measures.
3. Driver risk
In most countries, traf c situations that have been shown to have a very high risk level are not dealt with. Sometimes this can be rationally explained as being due to the fact that the possible countermeasures would have an unacceptable effect on other transport goals. But normally it seems to be due to the fact that politicians and the other decision makers nd the proposed countermeasures unacceptable to the public. Does this mean that the individual road user is irrational and does not accept sound arguments?
Not necessarily. His reactions are probably quite logical and natural. Table 1 can also be used to illustrate the problem from the individual driver s viewpoint. It can be used to show that the risks that look quite high at the aggregated level really look very low at the individual level. The average driver in highly developed countries would have to drive for several thousand years before he gets killed, or he kills another person. Even in the developing countries a person would have to drive for a hundred years before killing someone. To the individual driver such risk levels are perceived to be zero, or very close to zero.
And that is the situation viewed from the statistical, aggregated and random risk level. Calculated that way, no activity in life is without risk. And driving is an everyday activity which corresponds to many other everyday activities in the respect that we do not carry them out under a continuous threat, under a conscious calculation of risks; in the sense of the probability of being hurt. Every individual, in his own opinion, normally drives safely, without any real risk. For the individual the target value of risk is zero.
510 K. Rumar
Furthermore, several studies show that most drivers hold the opinion that accidents are not a random effect, but result from lack of skill. They also believe that their own skill is considerably higher than that of the average driver (Svensson 1981). In other words, every driver has control of his risk level and, since his own skill is unusually high, his risk is virtually zero. A good demonstration of this is the fact that, if Swedish drivers are asked if they are afraid of something in traf c, the majority answer collision with moose ! From an aggregated point of view that risk is very low, but it is a situation which drivers understand to be beyond their control. In all other situations they believe they have full control of their risk level. In other words, they perceive that they successfully meet their target risk value of zero.
4. Driver models
In the history of road traffic accident research there are several phases, summarized in table 2.
The role given to the driver, the human factor, has changed, from innocent (God, destiny) to the main cause (accident proneness) to innocent (victim of system complexity) to part of the system (a link in the chain). Presently, it is generally agreed that human characteristics and human limitations should be the basis for the design of roads, vehicles, the traf c control system and the rules. But in order to be able to do that we have to have an adequate description of how man behaves in traf c, i.e. what characteristics he has. We need models of road user behaviour.
The level of sophistication of such theories and models is comparatively low. There seem to be two main approaches, with several variants of each:
(1) Perceptual models (2) Cognitive models.
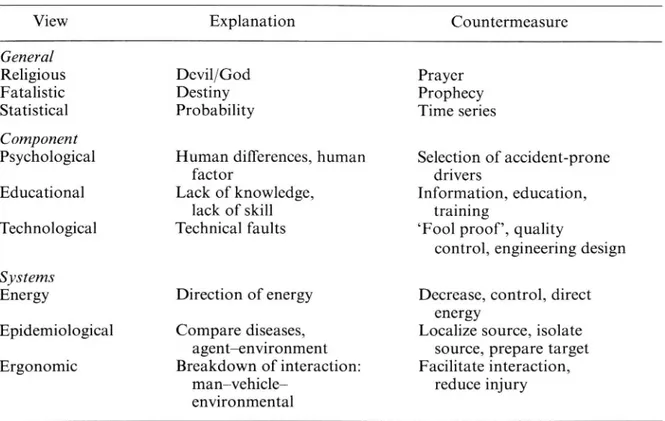
Table 2. Evolution of paradigms in accident research (after Gunnarsson 1985).
View Explanation Countermeasure
General
Religious Devil/God Prayer
Fatalistic Destiny Prophecy
Statistical Probability Time series
Component
Psychological Human differences, human Selection of accident-prone
factor drivers
Educational Lack of knowledge, Information, education,
lack of skill training
Technological Technical faults Fool proof , quality
control, engineering design Systems
Energy Direction of energy Decrease, control, direct
energy
Epidemiological Compare diseases, Localize source, isolate agent environment source, prepare target Ergonomic Breakdown of interaction: Facilitate interaction,
man vehicle
Collective risk but individual safety 511 Earlier perceptual models put much emphasis on thresholds, absolute as well as relative. The main problems for these schools of thought were detection, interpret ation and visual performance. In other words, acquisition of information. They explained accidents as being an effect of inadequate information. These models had no real place for the concept of risk. A typical countermeasure was selection out of individuals with information acquisition problems.
Earlier cognitive models concentrated on the limited human capacity to process information. Typical problems were reaction times, channel capacity, decision making. In these models the concept of risk was one of the factors that played a role in the cognitive process that resulted in a decision. Accidents were explained as an effect of inappropriate information processing. Driving was looked upon almost as a problem-solving task. Typical countermeasures were training, education and information.
Later models tried to combine these two approaches but, in general, they still tended to be very mechanistic. The driver was seen as a receiver and processor. Information was described in bits and chunks. One of the chunks was risk. Simple driving tasks like negotiating a curve or going through an intersection will, in these terms, become very complicated at the descriptive level.
Today, both approaches still exist. But the cognitive one has included social and motivational aspects, thereby becoming much more human and exible. One of the important social values is target risk the risk levels that road users are accepting (Wilde 1982). Good exponents of motivational models are Näätänen and Summala
(1976). &
Perceptual models have taken on a more ecological view, in uenced primarily by Gibson. Instead of asking what is going on in the head, the primary question is what the head is the inside of. In the dynamic complexity of reality, most of the information necessary for immediate decisions is available. Problems arise when we take away important information (night traf c), introduce unfamiliar information (high speed), or distort information (curved rear-view mirrors). The concept of risk has no real place in such models. It is rather a question of perceived dif culty, or lack of information. An example of this type of model is provided by Lee and Lishman (1977)
The difference between these two types of models is gradually becoming smaller and smaller. The cognitive supporters tend to claim that the acquisition of infor-mation and the treatment of inforinfor-mation are really two levels in the process. Other-wise it is hard to explain the speed with which driver decisions are carried out. The perceptual supporters have to admit that the consciously controlled driver tasks and the driver learning situation, in particular, contain much of a cognitive character. Otherwise it would be dif cult to explain the hesitation and the decision problems of learner drivers.
5. Driver behaviour
Can these models predict driver behaviour in general and driver risk behaviour speci cally? If not, they cannot be falsi ed and consequently not tested. It seems to me they cannot. At best they offer post hoc explanations of driver behaviour that has been observed. Or they can explain aggregated accident data. But this is not enough. This does not generate new ideas, new hypotheses. So let us look for other models. Probably we cannot use any existing general psychological theories or models. The speci c dynamic tasks of a driver require a speci c and unique model, which so far
512 K. Rumar
remains to be speci ed. Maybe the important behavioural uniqueness of driving is its combination of consciously controlled (cognitive) and unconscious, automatic (per-ceptual) behaviour?
What separates experienced drivers from beginners does not seem to be their capacity to detect and estimate potential danger. Studies by Johansson (1982) indicate that the pure estimation of dif culty or risk is almost as good for the beginner as for the expert. However, the latter might carry out most of the driving task automatically, which leaves him plenty of capacity for deciding which observations he has to handle consciously and for observation, prediction and consideration of more dif cult situations. To the beginner, all tasks have to be carried out under conscious control.
It is probably not only the proportion of the driving that is carried out under conscious or automatic control that separates the experienced from the inexperienced driver. Another important question is how the switching between these two modes is performed, i.e. when? speed? accuracy?, etc.? Could it be the feeling of risk, or of threat, that causes the switching from automatic to conscious control?
Spolander (1983) describes a driver model with two main components: capacity to register the situation (basically perceptual and automatic);
capacity to handle the situational demands (basically cognitive and conscious). Evans (1985) mentions as the two main factors in uencing traf c safety:
human infrastructure (basically cognitive and conscious); engineering infrastructure (basically perceptual and automatic).
There seem to be three types of information on the basis of which driver decisions are carried out: (1) present situation, (2) memory of previous corresponding situ ations and, (3) expectations of how the situation will develop. Decisions in traf c often have to be made on the basis of predicted events, rather than in real time. Road traf c has a considerable inertia that requires predictions. Otherwise driver behaviour would be very jerky and speed would be very slow. These predictions may, of course, be more or less accurate. They will usually be less accurate the less experience a driver has, both of traf c situations and of his own capacity to handle those situations. The purpose of information acquisition is probably to a very large extent to check the predictions. Also, predictions are needed in order not to overload the system when traf c conditions are very demanding.
During driving, very few drivers actually consider the probability of being injured. Mostly they consider themselves to be well on the zero side of the limit. They might get close to that limit in special situations (e.g. late for a ight) or when it is quite clear that a mistake has been made (e.g. when overtaking). But it must be a rare exception that drivers consciously and deliberately pass the limit. Therefore it is much more in agreement with common sense to talk about safety margins than to talk about risk estimation. The safety margin is always considered to be greater than zero, while the risk estimation is negative.
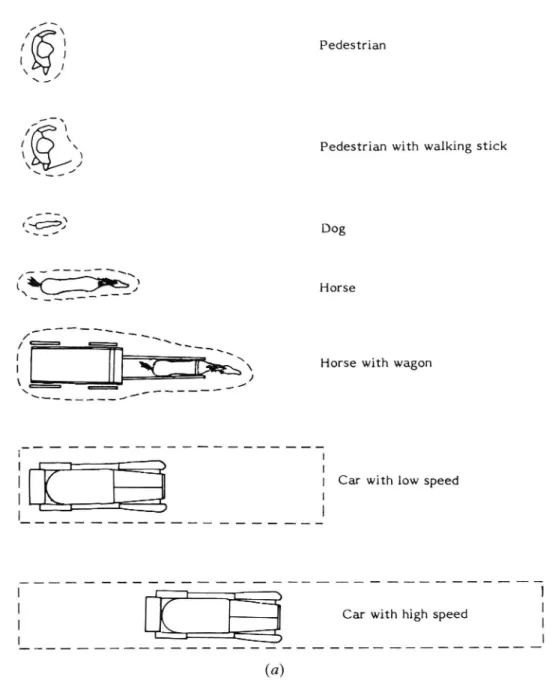
But what is the safety margin operationally? Hardly the simple time and distance separation measures that have been used so far. One hypothesis could be that the prediction of the situation is the basis for the perceived safety margin. Another hypothesis could be that it is the point of no return , when a driver can no longer do anything about the situation himself, that determines the value of the safety margin. The ideas put forward by several authors about a perceived area of safe driving are in line with these thoughts. (See gure 1.) For an experienced driver, this eld of safe
Collective risk but individual safety 513 driving is an automatic function. When something gets close to it he perceives a threat, a risk, and switches to conscious control.
6. Countermeasure effects
In principle, the effects of an accident countermeasure could be of three types (Evans 1985)
engineering (full effect), e.g. daylight running lights? (Rumar 1981). This used to be the normal prediction. It was not until we started using good follow-up methods that we realized it was exceptional rather than normal.
economic (partial effect), e.g. studded tyres (Rumar et al. 1976). This effect is described e.g. by Blomquist (1986).
risk constancy (no effect), e.g. traf c signals (Short et al. 1982). The most well-known of the advocates for this theory is Wilde (1982).
But how is it possible to produce such different effects? Is it in any way a re ection of driver perception, or evaluation of risk?
Probably not. In driving, just as in any other activity, it is quite natural that we try to optimize our behaviour, that is, we attempt to bene t from all four above-mentioned goals. The economic effect is normally our aim and studies seem to indicate it is also the most common effect. But if we cannot perceive any immediate effect of a countermeasure (e.g. daylight running lights) then behaviour is not in uenced and the effect will be of the engineering type. If on the other hand we perceive the effect of the countermeasure as much stronger than it really is, we might change our behaviour too much and the effect might be risk constancy.
7. Empirical examples
Let us take a few short examples to demonstrate the difference between collective and individual risk and the reaction and behaviour of the individual.
One of the most common causes of accidental injury in everyday life is slipping and falling (Strandberg and Lanshammar 1981). This is quite evident from national occupational and hospital statistics, but the individual does not see it that way, with the possible exception of elderly persons. Walking is an activity over which we feel we
have full control. Thus there is clear statistical risk, but the individual does not
experience it while walking.
One of the best established correlations with accident and injury risk is that with speed (Nilsson 1981). But these correlations are all on the aggregated level. The individual driver normally does not agree that speed contributes to accidents. Speed limits are probably the most violated of all laws. From the individual s point of view, speed becomes an important factor in accidents only when it is extremely excessive.
We know from aggregated accident statistics that the risk of driving at night is about three times that of daylight driving. But most individuals still consider night driving more comfortable and less risky. They feel comfortable and in full control of the situation. Thus speeds at night are normally higher than daylight speeds.
In-depth accident studies show that late detection of other road users is a very common explanation given for collisions. In spite of this, individual road users nd it almost ridiculous to have to switch on their headlights during daylight in order to improve vehicle conspicuousness. But statistical follow-up studies have shown this countermeasure to be very effective (Rumar 1981).
514 K. Rumar // \ l Pedestrian
| © I
* / f \( QX Pedestrian with walking stick
\ 1/ (\01 D 0 g / » Km ; Horse / _ =_ _ & , _ __ ) | |
| Car with low speed
|
|
Figure 1. Illustrations of the old ideas of a subjective dynamic eld, (a) psychophysical eld (Sylwan 1919), (b) eld of safe driving (Gibson & Crooks 1938), that, depending on speed, direction and stability surrounds all moving objects.
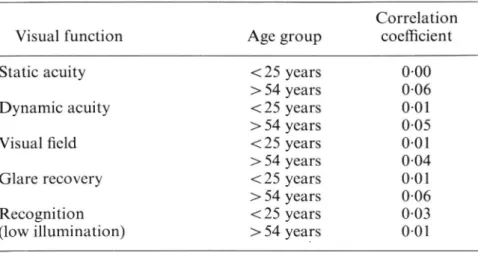
There are also examples of the opposite relationship between objective and subjective risk, i.e. where individuals perceive risk to be greater than it actually is. For example: vision is no doubt the most important input channel for drivers and it is usually expected that poor vision will be associated with increased accident involve ment. Yet the correlation coef cients obtained between some common visual scores and accident rate are amazingly low (see table 3). Presumably this is because most individuals with some visual de ciency know about it and behave accordingly, . compensating for their handicap.
The elderly driver is a special case of handicap compensation. Looking at the performance decrement that occurs as a result of aging, the increase in accident risk with increased age should be much higher than it really is (Rumar 1986). Presumably
Collective risk but individual safety 515
this is because the elderly driver is normally quite aware of his problems and avoids the critical situations which exacerbate them. However, he cannot avoid them all, all the time. Therefore the aggregated accident risk of old drivers is higher than that of middle-aged drivers. But it is not as high as that of young drivers. The latter illustrates the opposite problem: a group of individuals who do not recognize their handicaps.
The nal example is provided by Sweden s experience when the rule of the road was changed from left to right hand driving. Many people, including experts, predicted a blood-bath. But drivers realized that this situation was dif cult and potentially dangerous and consequently they changed their behaviour. During that year (1967), Sweden s accident gures were lower than the preceding and following ten years!
516 K. Rumar
Table 3. Account of some correlation coef cients obtained between performance and accident rate (Davison 1978).
Correlation
Visual function Age group coef cient
Static acuity < 25 years 000
> 54 years 006
Dynamic acuity <25 years 001
> 54 years 0-05
Visual eld < 25 years 001
> 54 years 0-04
Glare recovery < 25 years 001
> 54 years 006
Recognition < 25 years 0-03
(low illumination) > 54 years 0-01
8. Conclusions
Based on compiled accident statistics, authorities rightly consider road traf c dangerous. They try to improve safety and design traf c rules using aggregated accident statistics and calculations of average objective risk.
Individuals look at traf c from another perspective. Their personal risk level is very low. They believe they have full control of traf c situations and they feel safe: they do not understand the need for constraint and thus have no motivation to follow the rules. It is proposed that risk estimation plays a very small part in this process, mainly because drivers usually get no feedback about risk. Even if they sense risk initially (and that is quite common among learners), this feeling is soon extinguished due to lack of feedback.
Present driver models and present psychological theories do not seem to be able to predict actual driver behaviour and they do not generate new hypotheses which can be tested. Such models and hypotheses are urgently needed.
Theoretically calculated effects of accident countermeasures are normally reduced by road users natural motivation to use traf c system changes to their own advantage (utility, economy or risk compensation).
What we need is a countermeasure philosophy that is based on knowledge about factors in uencing individual driver behaviour, employing models that can be used to generate hypotheses on methods of in uencing individual road-user behaviour. The detection model behind the daylight running lights countermeasure seems to exemplify this need (Rumar 1981).
9. References
BLOMQUIST, G., 1986, A utility maximization model of driver traf c safety behaviour. Accident
Analysis and Prevention, 18, 371 375.
DAVISON, P. A., 1978, The role of drivers vision in road safety. Lighting Research and
Technology, 10, 125 139.
EVANS, L., 1985, Factors controlling traf c crashes. General Motors Research Publication
GMR-5122, Warren, Michigan, USA.
GIBSON, J. J. and CROOKS, L. E., 1938, A theoretical eld analysis of automobile driving.
American Journal of Psychology, 51, 453 471.
GUNNARSSON, S. O., 1985, The paradigm of accident research. (In Swedish.) Department of Traf c Planning, Technical University of Gothenburg, Sweden. Report 1986: 2.
Collective risk but individual safety 517
INTERNATIONAL ROAD FEDERATION IRF, 1985, World Road Statistics 1980 1984.
JOHANSSON, R., 1982, Relation between subjective and objective accident risk. (In Swedish.) TFD Report 1982: 9, Stockholm, Sweden.
LEE, D. N., and LISHMAN, R., 1977, Visual control of locomotion. Scandinavian Journal of Psychology, 18, 224 230.
NILSSON, G., 1981, The effects of speed limits on tra ic accidents in Sweden. OECD Symposium on the Effect of Speed Limits on Tra ic Accidents and Transport Energy Use, Dublin. NÄÄTÄNEN, R., and SUMMALA, H., 1976, Road user behaviour and traf c accidents (North
Holland Publishing Company, Amsterdam).
RUMAR, K., 1981, Daylight running lights in Sweden. SAE Congress, Detroit, USA. Technical Paper 810191.
RUMAR, K., 1986, Age and road user behaviour. 4th Nordic Congress of Tra ic Medicine, Esbo, Finland.
RUMAR, K., et al. 1976, Driver reaction to a safety measure studded tires. Human Factors, 18, 443 454.
SHORT, M. S., et al., 1982, Effects of traffic signal installations on accidents. Accident Analysis and Prevention, 14, 135 145.
SPOLANDER, K., 1983, Drivers accident risks a model tested on men and women. (In Swedish.) Swedish Road and Traf c Research Institute, Linköping, Sweden, Report 268.
STRANDBERG, L., and LANSHAMMAR, H., 1981, The dynamics of slipping accidents. Journal of Occupational Accidents, 3, 153 162.
SVENSSON, O., 1981, Are we all less risky and more skillful than our fellow drivers? Acta Psychologica, 47, 143 148.
SYLWAN, C., 1919, Traf c safety on streets and roads. (In Swedish.) In: Industritidningen Norden (Stockholm, Sweden), pp. 50, 357 362.
WILDE, G., 1982, The theory of risk homeostasis implications for safety and health. Risk Analysis, 2, 209 255.
Revised manuscript received 10 September 1987.
Tous ceux qui s efforcent de réduire les accidents de la route savent que la présence dans le trafic routier représente pour beaucoup de personnes le plus important risque journalier. Les responsables de la circulation routiere peuvent utiliser des evaluations tres nes du risque pour lutter contre 1 accidentabilité. Ces evaluations peuvent également servir a relier les problemes de traf c au co ts nanciers. Mais, trop souvent, les evaluations objectives du risque ne sont pas utilisées rationnellement. Pourquoi?
Une des raisons principales est que ni la communauté, ni le conducteur isolé, n acceptent des contre-mesures basées sur ces indices de risque. Ils ne comprennent pas la nécessité des mesures répressives. Les responsables politiques sont sensibles å cette réaction. C est comme si les conducteurs étaient irrationnels. Mais le sont-ils réellement?
Lå nous affrontons un des plus délicats problémes de la Sécurité routiere. La plupart des conducteurs et autres usagers ne vivent pas l expérience du risque dont témoignent les statistiques d accidents. Les niveaux individuels de perception du risque sont bas. Mais ceci est aussi vrai pour d autres risques vécus (p. ex. l éclair lors d un orage). Le probléme principal est sans doute lié au fait que les conducteurs font l expérience d un effet rétroactif inadéquat ou méme positif (récompense, renforcement) concernant leur comportement dangereux. Ils sont ainsi amenés å penser, de maniére fallacieuse, qu ils ont l entier contröle de ce qui arrive dans le trafic. Ils sont conscients des risques, mais pensent qu ils peuvent éviter la plupart. D autres, pensent-ils, qui ne sont pas aussi expérimentés, se trouvent impliqués dans les dif cultés et ce sont ceux-la dont le comportement est re été dans les statistiques d accidents. Eux-mémes sont en sécurité et ne courent aucun risque. Si ceci est le vécu et l opinion de la plupart des conducteurs, comment réussair å les motiver pour un comportement non dangereux?
Jeder, der versucht Verkehrsunfälle zu reduzieren, weiB, daB die Teilnahme am
StraBenverkehr eine der groBten täglichen Risiken fiir viele Menschen darstellt. StraBenverkehrsbehörden können vorsichtige Abschätzungen der Risiken in ihrem Kampf gegen die Verkehrsunfälle benutzen. Diese RisikomaBstäbe können benutzt werden, um
518 Collective risk but individual safety
Verkehrsprobleme mit iinanziellen Mitteln in Beziehung zu bringen. Aber zu oft werden objektive RisikomaBstäbe nicht rational genutzt. Warum nicht?
Einer der wesentlichen Griinde ist, daB die Öffentlichkeit und der einzelne Autofahrer
GegenmaBnahmen, die auf diesen Risikokennwerten beruhen, nicht akzeptieren. Sie verstehen die Motive fiir repressive MaBnahmen nicht. Politiker miissen fiir die Reaktion der Öffentlich-keit sensibel sein, und sie sind es. Es scheint, als seien Autofahrer unverniinftig. Aber sind sie es wirklich?
Hierin erkennen wir eines der schwierigsten Probleme der Verkehrssicherheitsarbeit. Die meisten Autofahrer und anderen Verkehrsteilnehmer am Individualverkehr erfahren nicht die
Risiken, die durch die Unfallstatistiken beweisen werden. Die Höhe des vom Einzelnen
wahrgenommenen Risikos ist gering. Das gilt jedoch auch fiir gewisse erfahrene Risiken, z.B. Blitzschlag. Das wesentliche Problem ist wahrscheinlich, daB die meisten individuellen Fahrer eine nicht angemessene, oder sogar positive Riickkoppelung (Belohnung, Verstärkung) ihres
unsicheren Verhaltens erfahren. Auf diese Weise denken sie fälschlicherweise, sie hätten die volle Kontrolle iiber das, was im Verkehr passiert. Sie sind sich der Risiken bewuBt, glauben
aber, die meisten davon verrneiden zu können. Andere Verkehrsteilnehmer, die weniger geiibt sind, werden betroffen, und die Unfallstatistiken spiegeln deren Verhalten wider. Sie selbst sind demgegeniiber sicher und gehen fiir sich selbst kein Risiko ein. Falls das die Erfahrung der
meisten Fahrer ist, wie können wir sie dazu motivieren, sich sicherer zu verhalten?
iäååääållläéäé'tw öÅlååfé? biäååääiåfxwåbnbiå < (DA/7 cc & otjäåfå Sää/U ') x
äw oeäezåéäofwåoääääååäéäåääiäämååäå%%LtUxäé äääåC&#äéocmauzäwRädäEääéäämäåäwewmämcå50Lat,
Uxamaämäm%E%m©mäutmmwcamtwteäao%aaaemo
äuémw oMEä äåääwåäåäcmawUxäåémädåmäååwÅMÄwa Beäéoäwmwäwääééwbäwocwäåwämwa%ääääeatäacäwhä Äåäwbwfäåoåäådååwcäwäömäåéo%%K%5&©#o zCcäädåääåääwåeäääääw omääLtméoEbwääåäewwwå %&måwkäädäääämäéhéUzäégätäwo%%Uxäwwemvswwgwo Läbzhdéöå©&%0z7,Wåä,ååmeåtwäeoiåäääuäéäwäwéä åöåäääåwÄEWÄätM£©74 FNvä(%%,%%)éåofwéiåTäåoL
t afi ewm%$m%émé tfmée of ofméoUx M ¢é afm5
#,Ux7©&&A£%EH5C&#eåéååcrmeo&%wäwewwwääåwäämå åbänéo%wää#$&%ämä%ämewwcmGGAäeäéo&éåäääåcUxä %%ääwo%mmäåaäwéäåwåäeååcäaäaw,eoåäåmäåaéäömé &%%åäöwémdäöbtåäwwbo