Assessment of Risk Factors and Biomarkers Associated
With Risk of Cardiovascular Disease Among Women Consuming
a Mediterranean Diet
Shafqat Ahmad, PhD; M. Vinayaga Moorthy, PhD; Olga V. Demler, PhD; Frank B. Hu, MD, PhD; Paul M Ridker, MD, MPH; Daniel I. Chasman, PhD; Samia Mora, MD, MHS
Abstract
IMPORTANCE Higher Mediterranean diet (MED) intake has been associated with lower risk of cardiovascular disease (CVD), but limited data are available about the underlying molecular mechanisms of this inverse disease association in human populations.
OBJECTIVE To better characterize the relative contribution of traditional and novel factors to the MED-related risk reduction in CVD events in a US population.
DESIGN, SETTING, AND PARTICIPANTS Using a prospective cohort design, baseline MED intake was assessed in 25 994 initially healthy US women in the Women’s Health Study who were followed up to 12 years. Potential mediating effects of a panel of 40 biomarkers were evaluated, including lipids, lipoproteins, apolipoproteins, inflammation, glucose metabolism and insulin resistance, branched-chain amino acids, small-molecule metabolites, and clinical factors. Baseline study information and samples were collected between April 30, 1993, and January 24, 1996. Analyses were conducted between August 1, 2017, and October 30, 2018.
EXPOSURES Intake of MED is a 9-category measure of adherence to a Mediterranean dietary pattern. Participants were categorized into 3 levels based on their adherence to the MED. MAIN OUTCOMES AND MEASURES Incident CVD confirmed through medical records and the proportion of CVD risk reduction explained by mediators.
RESULTS Among 25 994 women (mean [SD] age, 54.7 [7.1] years), those with low, middle, and upper MED intakes composed 39.0%, 36.2%, and 24.8% of the study population and experienced 428 (4.2%), 356 (3.8%), and 246 (3.8%) incident CVD events, respectively. Compared with the reference group who had low MED intake, CVD risk reductions were observed for the middle and upper groups, with respective HRs of 0.77 (95% CI, 0.67-0.90) and 0.72 (95% CI, 0.61-0.86) (P for trend < .001). The largest mediators of the CVD risk reduction of MED intake were biomarkers of inflammation (accounting for 29.2% of the MED-CVD association), glucose metabolism and insulin resistance (27.9%), and body mass index (27.3%), followed by blood pressure (26.6%), traditional lipids (26.0%), high-density lipoprotein measures (24.0%) or very low-density lipoprotein measures (20.8%), with lesser contributions from low-density lipoproteins (13.0%), branched-chain amino acids (13.6%), apolipoproteins (6.5%), or other small-molecule metabolites (5.8%).
CONCLUSIONS AND RELEVANCE In this study, higher MED intake was associated with
approximately one-fourth relative risk reduction in CVD events, which could be explained in part by known risk factors, both traditional and novel.
JAMA Network Open. 2018;1(8):e185708. doi:10.1001/jamanetworkopen.2018.5708
Key Points
Question Is the Mediterranean diet (MED) associated with lower risk of cardiovascular disease (CVD) events in a US population, and, if so, what are the underlying mechanisms?
Findings In this cohort study of 25 994 US women, higher baseline MED intake was associated with up to 28% relative risk reduction in CVD events. For the MED-CVD risk reduction, biomarkers of inflammation, glucose metabolism and insulin resistance, and adiposity contributed most to explaining the association.
Meaning Higher MED intake was associated with approximately one-fourth relative risk reduction in CVD, which could be explained in part by known risk factors, both traditionally measured and novel ones.
+
Supplemental contentAuthor affiliations and article information are listed at the end of this article.
Introduction
Modification of overall dietary patterns rather than individual dietary attributes are proposed as a more effective approach for cardiovascular disease (CVD) prevention and intervention.1
Based on clinical trial evidence,2,3
prospective cohort studies,4-6
recommendations of the American Heart Association7
and the 2015-2020 Dietary Guidelines for Americans,8
a Mediterranean diet (MED) pattern is associated with prevention of CVD, even in non-Mediterranean populations.
Two European randomized clinical trials conducted in Mediterranean countries examined a MED intake intervention vs a control diet and found significant reductions in clinical CVD events. In the Lyon Diet Heart trial, 605 French men with a first myocardial infarction (MI) were randomized to MED intervention vs American Heart Association Step 1 control diet, resulting in 50% to 70% lower relative risk of recurrent CVD.9
Most of the measured intermediate CVD biomarkers (including traditional lipids) were similar between the study groups.10
Subsequently, the Prevención con Dieta Mediterránea (PREDIMED) trial found that a MED intervention enriched with nuts or extra-virgin olive oil reduced first CVD events by 30% compared with a control low-fat diet in a high-risk Spanish primary prevention population.2,3
The MED in this Spanish population at increased risk for CVD was associated with favorable changes in several CVD risk factors, including reduced levels of oxidized low-density lipoproteins (LDL) and triglycerides (TG), increases in high-density lipoproteins (HDL), and improvements in blood pressure, insulin sensitivity, and circulating inflammatory molecules,11 but it is unclear which of these favorable changes may mediate the MED benefit on CVD event reduction. No significant weight reduction was observed in either 3 months or 1 year of intervention in the PREDIMED study.11,12
Recently, the PREDIMED study’s original findings3
have been retracted and republished,13
although the republished results are consistent with the previously reported findings for MED benefit.
No randomized trials of MED intervention have been conducted in the United States for clinical outcomes. Observational studies in US populations have reported that a 20-percentile higher MED intake was associated with 9% relative risk reduction in CVD events in short-term follow-up of up to 4 years.14
It is uncertain whether MED intake protects against CVD events in US populations over the long term.
Furthermore, the precise mechanisms through which MED intake is associated with reduction in long-term risk of CVD events are not well understood. Therefore, we aimed to (1) examine whether higher MED intake was associated with lower CVD event risk in a US population of initially healthy individuals with long-term (>10 years) follow-up, and (2) better characterize and quantify the relative contribution of a panel of 40 traditional and novel factors to the MED-associated risk reduction in CVD events.
Methods
Study Population
Our study followed the Strengthening the Reporting of Observational Studies in Epidemiology (STROBE) reporting guideline for cohort studies. The study population is derived from the Women’s Health Study, as reported previously.15-17
Briefly, 39 876 female health professionals aged 45 years or older and free from CVD at baseline (1991-1995) were randomized to either to low-dose aspirin or vitamin E. In the Women’s Health Study, 28 345 female participants provided baseline blood samples. For the current analyses, we included 25 994 participants, after excluding participants with missing information for any biomarkers (n = 1614) or MED intake assessed from semiquantitative food-frequency questionnaires (n = 737). To assess the dietary pattern, a validated semiquantitative food-frequency questionnaire including 131 food items was administered to study participants at baseline.18
Demographic information was collected from baseline questionnaires asking about history of hypertension, use of postmenopausal hormone therapy, smoking, physical activity, alcohol consumption, and family history of premature MI, among others. Self-reported weight and height were reported, and body mass index (BMI) was
calculated. Systolic and diastolic blood pressures were also reported at baseline. All participants provided written informed consent, and the study protocols were approved by the Partners Institutional Review Board, Boston, Massachusetts.
MED Score
The MED score ranges from 0 to 9, with a higher score representing better adherence to the MED.19 Scoring is based on 9 components of MED intake, with 1 point given if intake is above the food-frequency questionnaire’s study median intake for vegetables (excluding potatoes), fruits, nuts, whole grains, legumes, fish, and the ratio of monounsaturated fatty acids to saturated fatty acids; for alcohol intake, 1 point was given if intake ranged from 5 to 15 g/d (otherwise 0 points were given); for red and processed meats, 1 point was given if the intake was below the study-specific median (otherwise 0 points were given). For the current analyses, we categorized the participants according to 3 levels of MED (scores of 0-3, 4-5, and 6-9).
Ascertainment of Cardiovascular Events
The primary end point for the current analyses was incident CVD,20
defined as medical record– confirmed first events of MI, stroke, coronary arterial revascularization, and cardiovascular death. Coronary and stroke events were also examined separately. Because baseline measures of MED intake attenuate with time, we considered our primary analyses with a maximum follow-up of 12 years from baseline, which also corresponded to approximately half the follow-up time. Secondary analyses were performed in the sample with a median (interquartile range) follow-up of 21.4 (19.2-22.1) years.
Blood Collection and Measurement of Biomarkers
At baseline, blood samples were collected in EDTA tubes, which were centrifuged and stored at −170°C until analyses were performed. Glycated hemoglobin (HbA1c) was quantified with an immunoturbidometric assay (Roche Diagnostics). High-sensitivity C-reactive protein (hsCRP) and lipoprotein(a) (Lp[a]) were assayed by turbidimetric immunoassays using the Hitachi-911 analyzer (Roche Diagnostics) with reagents and calibrators from Denka Seiken.15
Total cholesterol, HDL cholesterol (HDL-C), and LDL-C were measured enzymatically using tests from Roche Diagnostics and Genzyme. Levels of TG were enzymatically measured (Roche Diagnostics) with correction for endogenous glycerol. Apolipoprotein (apo) B100and apo AI were quantified using turbidometric assays (DiaSorin). Soluble intracellular adhesion molecule 1 (ICAM-1) was measured using enzyme-linked immunosorbent assay (R&D Systems). Fibrinogen was measured using an turbidimetric immunoassay (Kamiya Biomedical). Creatinine was measured using a rate-blanked method based on Jaffe reaction (Roche Diagnostics). Homocysteine was enzymatically measured through the Hitachi-917 analyzer (Roche Diagnostics) using the calibrators and reagents from Catch, Inc.
Nuclear Magnetic Resonance Spectroscopy Biomarkers
Lipoprotein subfraction particles (concentration and size) for LDL, HDL, and very low-density lipoproteins (VLDL) as well as several circulating small-molecule metabolites were measured by targeted nuclear magnetic resonance (NMR) spectroscopy.21-23
All NMR spectroscopy measures were performed using H-NMR (400 MHz) LipoProfile-IV (LipoScience [now LabCorp]), including branched-chain amino acids (BCAA [valine, leucine, isoleucine]); citrate21
; glycoprotein acetylation, which reflects the aggregated level of several glycosylated acute phase proteins and is a measure of inflammation24
; lipoprotein insulin resistance index and insulin resistance diabetes risk factor index, which are insulin resistance scores and include subfractions of triglyceride-rich lipoproteins, HDL particles, and LDL particles; short-term diabetes risk factor index, which predicts short-term diabetes incidence25
; and 5-year diabetes risk factor index, which correlates with impaired insulin resistance and insulin secretion.26
Statistical Analysis
Cox regression models were used to compute hazard ratios (HRs) with corresponding 95% confidence intervals using the lowest category (MED score, 0-3) as the reference. Two-sided P < .05 was considered as significant. Tests for linear trends were performed using the median value for each of the MED groups. Biomarkers that were not normally distributed (TG, hsCRP, Lp[a], and
homocysteine) were log transformed.
To test whether biomarkers satisfied criteria for potential mediators, we followed the steps defined by Baron and Kenny.27
We first tested the significance of the association of MED intake with CVD, and then retested the association in a separate model with each potential mediator. Models were adjusted for the confounders age, randomized treatment assignment, and energy intake (Table 1 and Table 2). Next, we evaluated the magnitude of the change in the HRs for the highest vs lowest MED intake group, with and without adjustment for each mediator (Table 3 and Table 4). A larger change in the HR toward the null implies a larger mediating effect of the risk factor on the association between MED intake and reduction in CVD events. Then, on an a priori basis, we grouped together a set of variables that are generally considered to be potential confounders rather than mediators (smoking [never, former, and current], menopausal status, postmenopausal hormone use, exercise, and parental history of MI). We included this set of variables together with age, randomized treatment, and energy intake in a single model, referring to this as the basic model. Also on an a priori basis, we grouped other risk factors generally considered to be potential mediators into sets on the basis of their pathophysiological effects. For example, to analyze the combined effects of traditional
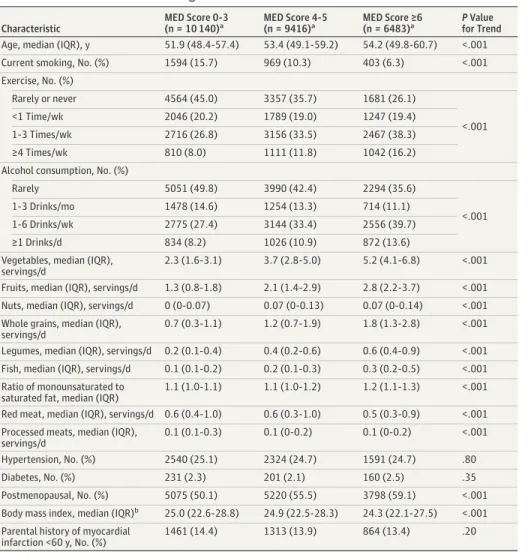
Table 1. Baseline Characteristics According to MED Intake
Characteristic MED Score 0-3 (n = 10 140)a MED Score 4-5 (n = 9416)a MED Score ≥6 (n = 6483)a P Value for Trend Age, median (IQR), y 51.9 (48.4-57.4) 53.4 (49.1-59.2) 54.2 (49.8-60.7) <.001
Current smoking, No. (%) 1594 (15.7) 969 (10.3) 403 (6.3) <.001
Exercise, No. (%) Rarely or never 4564 (45.0) 3357 (35.7) 1681 (26.1) <.001 <1 Time/wk 2046 (20.2) 1789 (19.0) 1247 (19.4) 1-3 Times/wk 2716 (26.8) 3156 (33.5) 2467 (38.3) ≥4 Times/wk 810 (8.0) 1111 (11.8) 1042 (16.2)
Alcohol consumption, No. (%)
Rarely 5051 (49.8) 3990 (42.4) 2294 (35.6)
<.001
1-3 Drinks/mo 1478 (14.6) 1254 (13.3) 714 (11.1)
1-6 Drinks/wk 2775 (27.4) 3144 (33.4) 2556 (39.7)
≥1 Drinks/d 834 (8.2) 1026 (10.9) 872 (13.6)
Vegetables, median (IQR), servings/d
2.3 (1.6-3.1) 3.7 (2.8-5.0) 5.2 (4.1-6.8) <.001
Fruits, median (IQR), servings/d 1.3 (0.8-1.8) 2.1 (1.4-2.9) 2.8 (2.2-3.7) <.001 Nuts, median (IQR), servings/d 0 (0-0.07) 0.07 (0-0.13) 0.07 (0-0.14) <.001 Whole grains, median (IQR),
servings/d
0.7 (0.3-1.1) 1.2 (0.7-1.9) 1.8 (1.3-2.8) <.001
Legumes, median (IQR), servings/d 0.2 (0.1-0.4) 0.4 (0.2-0.6) 0.6 (0.4-0.9) <.001 Fish, median (IQR), servings/d 0.1 (0.1-0.2) 0.2 (0.1-0.3) 0.3 (0.2-0.5) <.001 Ratio of monounsaturated to
saturated fat, median (IQR)
1.1 (1.0-1.1) 1.1 (1.0-1.2) 1.2 (1.1-1.3) <.001
Red meat, median (IQR), servings/d 0.6 (0.4-1.0) 0.6 (0.3-1.0) 0.5 (0.3-0.9) <.001 Processed meats, median (IQR),
servings/d
0.1 (0.1-0.3) 0.1 (0-0.2) 0.1 (0-0.2) <.001
Hypertension, No. (%) 2540 (25.1) 2324 (24.7) 1591 (24.7) .80
Diabetes, No. (%) 231 (2.3) 201 (2.1) 160 (2.5) .35
Postmenopausal, No. (%) 5075 (50.1) 5220 (55.5) 3798 (59.1) <.001
Body mass index, median (IQR)b 25.0 (22.6-28.8) 24.9 (22.5-28.3) 24.3 (22.1-27.5) <.001 Parental history of myocardial
infarction <60 y, No. (%)
1461 (14.4) 1313 (13.9) 864 (13.4) .20
Abbreviations: IQR, interquartile range; MED, Mediterranean diet.
a
The MED score is based on 9 components of MED intake. A higher score represents better adherence to the MED, ranging from 0 to 9. For the current analysis, we categorized the participants according to 3 levels of MED (group 1 [lowest]: MED score 0-3; group 2: MED score 4-5; and group 3 [highest]: MED score 6-9). P values apply across 3 levels of MED. bCalculated as weight in kilograms divided by height
Table 2. Baseline Biomarker Levels According to MED Intake
Biomarker
Median (IQR)a
P Value for Trend
MED Score 0-3 MED Score 4-5 MED Score ≥6
Blood pressure, mm Hg Systolic 125.0 (115.0-135.0) 125.0 (115.0-135.0) 125.0 (115.0-125.0) .82 Diastolic 80.0 (70.0-80.0) 80.0 (70.0-80.0) 80.0 (70.0-80.0) .02 Lipids, cholesterol, mg/dL LDL 121.8 (100.9-144.4) 121.3 (101.1-144.2) 121.0 (100.4-144.9) .83 HDL 51.2 (42.7-61.4) 52.5 (43.7-62.9) 53.6 (44.6-64.3) <.001 Triglycerides 118.0 (84.0-173.0) 118.0 (83.0-174.0) 117.0 (83.0-169.0) .001 Total 207.0 (183.0-234.0) 208.0 (184.0-235.0) 209.0 (184.0-236.0) .03 Lipoproteins, mg/dL Lipoprotein(a) 10.4 (4.3-32.1) 10.8 (4.6-33.3) 10.8 (4.4-33.1) .04 Apolipoprotein AI 147.7 (131.1-166.2) 149.7 (133.3-168.4) 151.8 (134.9-170.7) <.001 Apolipoprotein B100 100.2 (84.1-120.9) 99.7 (83.4-120.5) 99.7 (83.9-120.7) .87
LDL particles and size
LDL particle concentration, nmol/L 1566.0 (1330.0-1840.0) 1567.0 (1330.0-1838.0) 1569.0 (1327.0-1835.0) .99
LDL particle size, nm 20.9 (20.6-21.2) 20.9 (20.6-21.2) 20.9 (20.6-21.2) .003
HDL particles and size
HDL particle concentration, μmol/L 24.2 (21.8-26.8) 24.4 (22.1-27.1) 24.6 (22.2-27.2) <.001
HDL particle size, nm 8.9 (8.6-9.2) 8.9 (8.7-9.2) 8.9 (8.7-9.2) <.001
VLDL measures
TRL particle concentration, nmol/L 167.2 (132.2-208.6) 166.7 (129.7-208.9) 165.3 (129.2-207.4) .09
TRL particle size, nm 42.5 (38.6-48.1) 42.6 (38.6-47.9) 42.4 (38.5-47.6) .02
Glycemic
Hemoglobin A1c, % of total hemoglobin 5.00 (4.8-5.2) 4.99 (4.8-5.2) 5.00 (4.8-5.2) .25
Glucose metabolism and insulin resistanceb
Lipoprotein insulin resistance index score 41.0 (21.0-62.0) 40.0 (20.0-61.0) 38.0 (20.0-58.0) <.001 Insulin resistance diabetes risk factor score 33.0 (15.0-54.0) 32.0 (15.0-52.0) 29.0 (13.0-49.0) <.001 Short-term diabetes risk factor index score 49.0 (42.0-53.0) 49.0 (40.0-53.0) 48.0 (40.0-52.0) <.001
5-y diabetes risk factor index score 46.0 (31.0-63.0) 45.0 (29.0-61.0) 42.0 (28.0-59.0) <.001
Inflammation
High-sensitivity C-reactive protein, mg/L 2.1 (0.8-4.5) 2.0 (0.8-4.3) 1.8 (0.8-4.0) <.001
Fibrinogen, mg/dL 351.4 (307.3-405.0) 350.8 (308.3-401.5) 347.4 (305.2-398.4) .001
Soluble intercellular adhesion molecule 1, ng/mL
345.6 (302.2 (400.2) 342.1 (300.7-393.1) 337.8 (297.7-384.8) <.001
Glycoprotein acetylation, μmol/L 385.0 (340.0-433.0) 382.0 (339.0-429.0) 379.0 (335.0-424.0) <.001 Branched-chain amino acids, μmol/L
Total branched-chain amino acids 404.0 (351.0-465.0) 400.0 (349.0-460.0) 397.0 (348.0-455.0) <.001
Valine 221.0 (193.0-253.0) 220.0 (193.0-250.0) 218.0 (192.0-248.0) .004 Leucine 132.0 (111.0-156.0) 131.0 (110.0-154.0) 131.0 (110.0-154.0) .003 Isoleucine 51.0 (40.0-65.0) 50.0 (38.0-63.0) 49.0 (38.0-62.0) <.001 Small-molecule metabolites Citrate, μmol/L 94.0 (79.0-110.0) 94.0 (79.0-111.0) 93.0 (78.0-110.0) .05 Creatinine, mg/dL 0.7 (0.6-0.8) 0.7 (0.6-0.8) 0.7 (0.6-0.8) .43 Homocysteine, μmol/L 10.7 (8.8-13.2) 10.3 (8.6-12.7) 10.2 (8.6 (12.4) <.001
Abbreviations: HDL, high-density lipoprotein; IQR, interquartile range; LDL, low-density lipoprotein; MED, Mediterranean diet; TRL, triglyceride-rich lipoprotein; VLDL, very low-density lipoprotein.
SI conversion factors: To convert HDL and LDL cholesterol to mmol/L, multiply by 0.0253; triglycerides to mmol/L, multiply by 0.0113; lipoprotein(a) to μmol/L, multiply by 0.0357; apolipoprotein AI and Apolipoprotein B100to g/L, multiply by 0.01; hemoglobin A1cto proportion of total hemoglobin, multiply by 0.01; C-reactive protein to nmol/L, multiply by 9.524; fibrinogen to μmol/L, multiply by 0.0294; and creatinine to μmol/L, multiply by 88.4.
a
We categorized the participants according to 3 levels of MED (scores of 0-3, 4-5, and 6-9).
bFive-year diabetes risk factor index, insulin resistance diabetes risk factor, short-term diabetes risk factor index, and lipoprotein insulin resistance index are scored on a scale of 1 to 100, with higher numbers indicating higher risk.
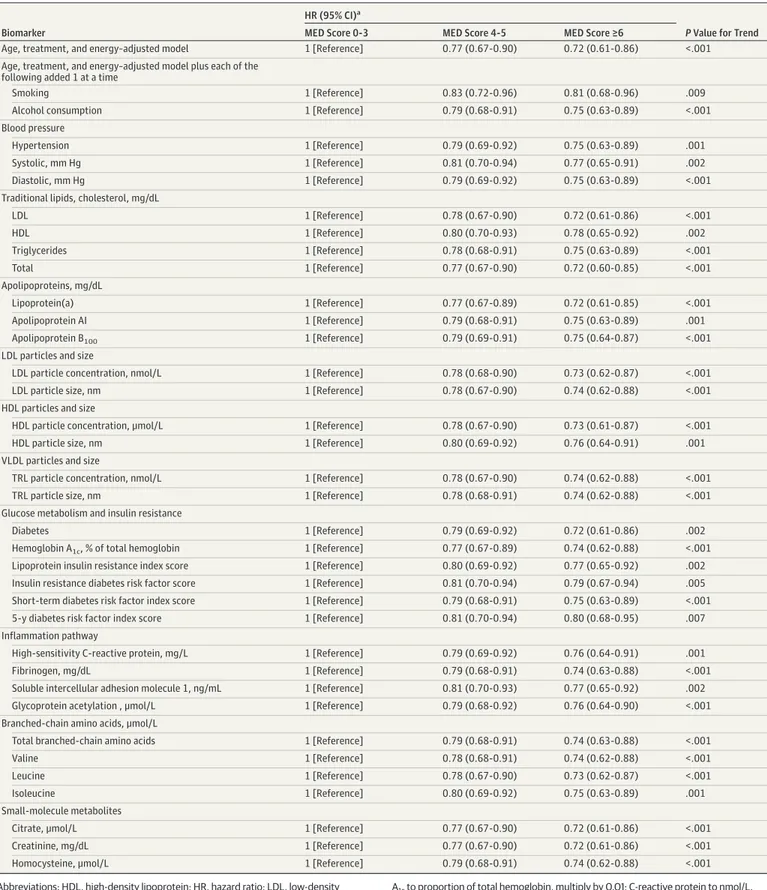
Table 3. Association of MED Intake With Cardiovascular Disease Events (12-y Follow-up) After Adjustment for Cardiovascular Disease Risk Factors
Biomarker
HR (95% CI)a
P Value for Trend
MED Score 0-3 MED Score 4-5 MED Score ≥6
Age, treatment, and energy–adjusted model 1 [Reference] 0.77 (0.67-0.90) 0.72 (0.61-0.86) <.001
Age, treatment, and energy–adjusted model plus each of the following added 1 at a time
Smoking 1 [Reference] 0.83 (0.72-0.96) 0.81 (0.68-0.96) .009
Alcohol consumption 1 [Reference] 0.79 (0.68-0.91) 0.75 (0.63-0.89) <.001
Blood pressure
Hypertension 1 [Reference] 0.79 (0.69-0.92) 0.75 (0.63-0.89) .001
Systolic, mm Hg 1 [Reference] 0.81 (0.70-0.94) 0.77 (0.65-0.91) .002
Diastolic, mm Hg 1 [Reference] 0.79 (0.69-0.92) 0.75 (0.63-0.89) <.001
Traditional lipids, cholesterol, mg/dL
LDL 1 [Reference] 0.78 (0.67-0.90) 0.72 (0.61-0.86) <.001 HDL 1 [Reference] 0.80 (0.70-0.93) 0.78 (0.65-0.92) .002 Triglycerides 1 [Reference] 0.78 (0.68-0.91) 0.75 (0.63-0.89) <.001 Total 1 [Reference] 0.77 (0.67-0.90) 0.72 (0.60-0.85) <.001 Apolipoproteins, mg/dL Lipoprotein(a) 1 [Reference] 0.77 (0.67-0.89) 0.72 (0.61-0.85) <.001 Apolipoprotein AI 1 [Reference] 0.79 (0.68-0.91) 0.75 (0.63-0.89) .001 Apolipoprotein B100 1 [Reference] 0.79 (0.69-0.91) 0.75 (0.64-0.87) <.001
LDL particles and size
LDL particle concentration, nmol/L 1 [Reference] 0.78 (0.68-0.90) 0.73 (0.62-0.87) <.001
LDL particle size, nm 1 [Reference] 0.78 (0.67-0.90) 0.74 (0.62-0.88) <.001
HDL particles and size
HDL particle concentration, μmol/L 1 [Reference] 0.78 (0.67-0.90) 0.73 (0.61-0.87) <.001
HDL particle size, nm 1 [Reference] 0.80 (0.69-0.92) 0.76 (0.64-0.91) .001
VLDL particles and size
TRL particle concentration, nmol/L 1 [Reference] 0.78 (0.67-0.90) 0.74 (0.62-0.88) <.001
TRL particle size, nm 1 [Reference] 0.78 (0.68-0.91) 0.74 (0.62-0.88) <.001
Glucose metabolism and insulin resistance
Diabetes 1 [Reference] 0.79 (0.69-0.92) 0.72 (0.61-0.86) .002
Hemoglobin A1c, % of total hemoglobin 1 [Reference] 0.77 (0.67-0.89) 0.74 (0.62-0.88) <.001
Lipoprotein insulin resistance index score 1 [Reference] 0.80 (0.69-0.92) 0.77 (0.65-0.92) .002
Insulin resistance diabetes risk factor score 1 [Reference] 0.81 (0.70-0.94) 0.79 (0.67-0.94) .005 Short-term diabetes risk factor index score 1 [Reference] 0.79 (0.68-0.91) 0.75 (0.63-0.89) <.001
5-y diabetes risk factor index score 1 [Reference] 0.81 (0.70-0.94) 0.80 (0.68-0.95) .007
Inflammation pathway
High-sensitivity C-reactive protein, mg/L 1 [Reference] 0.79 (0.69-0.92) 0.76 (0.64-0.91) .001
Fibrinogen, mg/dL 1 [Reference] 0.79 (0.68-0.91) 0.74 (0.63-0.88) <.001
Soluble intercellular adhesion molecule 1, ng/mL 1 [Reference] 0.81 (0.70-0.93) 0.77 (0.65-0.92) .002
Glycoprotein acetylation , μmol/L 1 [Reference] 0.79 (0.68-0.92) 0.76 (0.64-0.90) <.001
Branched-chain amino acids, μmol/L
Total branched-chain amino acids 1 [Reference] 0.79 (0.68-0.91) 0.74 (0.63-0.88) <.001
Valine 1 [Reference] 0.78 (0.68-0.91) 0.74 (0.62-0.88) <.001
Leucine 1 [Reference] 0.78 (0.67-0.90) 0.73 (0.62-0.87) <.001
Isoleucine 1 [Reference] 0.80 (0.69-0.92) 0.75 (0.63-0.89) .001
Small-molecule metabolites
Citrate, μmol/L 1 [Reference] 0.77 (0.67-0.90) 0.72 (0.61-0.86) <.001
Creatinine, mg/dL 1 [Reference] 0.77 (0.67-0.90) 0.72 (0.61-0.86) <.001
Homocysteine, μmol/L 1 [Reference] 0.79 (0.68-0.91) 0.74 (0.62-0.88) <.001
Abbreviations: HDL, high-density lipoprotein; HR, hazard ratio; LDL, low-density lipoprotein; MED, Mediterranean diet; TRL, triglyceride-rich lipoprotein; VLDL, very low-density lipoprotein.
SI conversion factors: To convert HDL and LDL cholesterol to mmol/L, multiply by 0.0253; triglycerides to mmol/L, multiply by 0.0113; lipoprotein(a) to μmol/L, multiply by 0.0357; apolipoprotein AI and Apolipoprotein B100to g/L, multiply by 0.01; hemoglobin
A1cto proportion of total hemoglobin, multiply by 0.01; C-reactive protein to nmol/L, multiply by 9.524; fibrinogen to μmol/L, multiply by 0.0294; and creatinine to μmol/L, multiply by 88.4.
a
We categorized the participants according to 3 levels of MED (scores of 0-3, 4-5, and 6-9). P values across 3 levels of MED were all less than .05.
lipids, we combined total cholesterol, LDL-C, HDL-C, and TG as 1 set. We combined Lp(a), apo AI, and apo B100as 1 set. Fibrinogen, hsCRP, ICAM-1, and glycoprotein acetylation were combined together as 1 set considering their role in inflammation. Diabetes, HbA1c, lipoprotein insulin resistance index, insulin resistance diabetes risk factor index, short-term diabetes risk factor index, and 5-year diabetes risk factor index were combined as the glucose metabolism and insulin resistance set. We considered LDL, LDL particle size and concentration, and apo B100the LDL set, while HDL, HDL particle size and concentration, and apo AI were combined as the HDL set. We combined TG-rich lipoprotein subfraction particle concentration, TG-rich lipoprotein particle size, and TG in the VLDL set. Total BCAA, citrate, creatinine, and homocysteine were combined into the small-molecule metabolite group, and total BCAA was also examined separately. Hypertension and systolic and diastolic blood pressures were combined as the hypertension group. Body mass index was examined separately.
To examine the extent to which each set of risk factors potentially mediated the association of MED intake on incident CVD, we next added these sets, 1 set at a time, to the basic model and examined the magnitude of change in the HRs for the group with the highest MED intake compared with the lowest intake without adjustment (basic model) and with adjustment for each set (adjusted model = basic model + mediator set). The proportion of CVD risk reduction explained by each set of mediators was calculated through the formula (HRbasicmodel − HRadjusted model)/(HRbasic model− 1) × 100%.28,29
As these biomarkers are correlated, their separate contributions can add up to more than 100%. Sensitivity analyses were performed using a counterfactual-framework approach30 through use of the SAS PROC CAUSALMED procedure. The results of both mediation approaches were compared for single mediators using MED as a continuous variable.
Sensitivity analyses were also repeated for the separate end points of coronary heart disease (CHD) and total stroke.
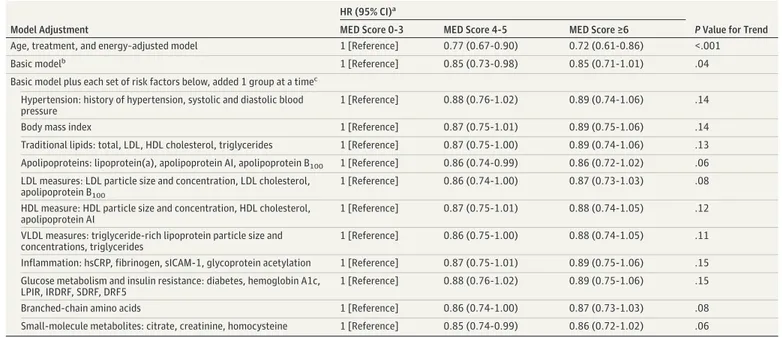
Table 4. Association of MED Intake With Cardiovascular Disease Events After Adjustment for Sets of Potential Mediators
Model Adjustment
HR (95% CI)a
P Value for Trend
MED Score 0-3 MED Score 4-5 MED Score ≥6
Age, treatment, and energy–adjusted model 1 [Reference] 0.77 (0.67-0.90) 0.72 (0.61-0.86) <.001
Basic modelb 1 [Reference] 0.85 (0.73-0.98) 0.85 (0.71-1.01) .04
Basic model plus each set of risk factors below, added 1 group at a timec Hypertension: history of hypertension, systolic and diastolic blood pressure
1 [Reference] 0.88 (0.76-1.02) 0.89 (0.74-1.06) .14
Body mass index 1 [Reference] 0.87 (0.75-1.01) 0.89 (0.75-1.06) .14
Traditional lipids: total, LDL, HDL cholesterol, triglycerides 1 [Reference] 0.87 (0.75-1.00) 0.89 (0.74-1.06) .13 Apolipoproteins: lipoprotein(a), apolipoprotein AI, apolipoprotein B100 1 [Reference] 0.86 (0.74-0.99) 0.86 (0.72-1.02) .06 LDL measures: LDL particle size and concentration, LDL cholesterol,
apolipoprotein B100
1 [Reference] 0.86 (0.74-1.00) 0.87 (0.73-1.03) .08
HDL measure: HDL particle size and concentration, HDL cholesterol, apolipoprotein AI
1 [Reference] 0.87 (0.75-1.01) 0.88 (0.74-1.05) .12
VLDL measures: triglyceride-rich lipoprotein particle size and concentrations, triglycerides
1 [Reference] 0.86 (0.75-1.00) 0.88 (0.74-1.05) .11
Inflammation: hsCRP, fibrinogen, sICAM-1, glycoprotein acetylation 1 [Reference] 0.87 (0.75-1.01) 0.89 (0.75-1.06) .15 Glucose metabolism and insulin resistance: diabetes, hemoglobin A1c,
LPIR, IRDRF, SDRF, DRF5
1 [Reference] 0.88 (0.76-1.02) 0.89 (0.75-1.06) .15
Branched-chain amino acids 1 [Reference] 0.86 (0.74-1.00) 0.87 (0.73-1.03) .08
Small-molecule metabolites: citrate, creatinine, homocysteine 1 [Reference] 0.85 (0.74-0.99) 0.86 (0.72-1.02) .06 Abbreviations: DRF5, 5-year diabetes risk factor index; HDL, high-density lipoprotein;
HR, hazard ratio; hsCRP, high sensitivity C-reactive protein; IRDRF, insulin resistance diabetes risk factor; LDL, low-density lipoprotein; LPIR, lipoprotein insulin resistance index; SDRF, short-term diabetes risk factor index; sICAM-1, soluble intercellular adhesion molecule 1; VLDL, very low-density lipoproteins.
aWe categorized the participants according to 3 levels of MED (scores of 0-3, 4-5 and ⱖ6). P values across 3 levels of MED were all less than .05.
b
Basic model included age, randomized treatment assignment, energy intake, smoking, menopausal status, postmenopausal hormone use, physical activity, and parental history of myocardial infarction before age 60 years. Participants were followed up to 12 years.
cModels were adjusted for the variables in the basic model plus each of the sets of risk factors added 1 group at a time to separate models.
Results
Baseline Characteristics
In the study sample of 25 994 female participants (mean [SD] baseline age, 54.7 [7.1] years), a total of 1030 participants (3.96%) experienced a first CVD event. Participants with low (MED scoreⱕ3), middle (MED score 4-5), and upper (MED score 6-9) dietary MED intake composed 39.0% (10 140), 36.2% (9416), and 24.8% (6438) of the study population and experienced 428 (4.2%), 356 (3.8%), and 246 (3.8%) incident CVD events, respectively. The risk of CVD events decreased with higher baseline MED intake. Compared with the reference group of low MED intake, CVD risk reductions were observed for the middle and upper groups, with respective HRs of 0.77 (95% CI, 0.67-0.90) and 0.72 (95% CI, 0.61-0.86) (P for trend < .001). Women with higher MED intake had a higher intake of vegetables, fruits, nuts, whole grains, legumes, and fish; greater ratio of monosaturated to saturated fat; and lower intake of processed and red meat (Table 1). Higher MED intake was generally associated with more favorable profiles of CVD risk factors and biomarkers (Table 2) with some exceptions. For example, total cholesterol was significantly higher with higher MED intake (median [interquartile range], 209.0 [184.0-236.0]) than in the lower MED intake group (median
[interquartile range], 207.0 [183.0-234.0]) (P = .03), while systolic blood pressure, LDL-C, apo B100, LDL particle concentration, creatinine, and HbA1cwere similar across the groups (P > .05).
Mediation
All factors except 6 met the criteria of Baron and Kenny27
for mediation (Table 1 and Table 2): systolic blood pressure (P = .82), LDL-C (P = .83), apo B100(P = .87), LDL particle concentration (P = .99), HbA1c(P = .25), and creatinine (P = .43) (see Table 2 for median [interquartile range] values with MED scores of 0-3, 4-5, andⱖ6). However, significant inverse association of these 6 parameters with MED intake have been reported previously.31-33
Therefore, we also evaluated the degree of the mediation association of all factors on the association of MED with the outcomes (Table 3 and Table 4).
MED and Risk of CVD
During a maximum follow-up of 12 years (mean [SD], 11.6 [1.5] years), a total of 1030 individuals experienced a first event, including 681 coronary events and 339 strokes. Compared with the reference group of participants with low MED intake, CVD risk reductions were observed for the middle and upper groups, with respective HRs of 0.77 (95% CI, 0.67-0.90) and 0.72 (95% CI, 0.61-0.86) (P for trend < .001) (Table 3). Using the group with MED scores from 0 to 3 as the reference, we observed CVD relative risk reductions of 23% and 28% for groups with scores of 4 to 5 and 6 or greater, respectively, adjusting for age, randomized treatment, and energy intake (Table 3). In separate Cox models that were additionally adjusted with each of the individual biomarkers, 1 at a time, we observed some attenuation of HRs (comparing higher vs lower MED intake) before and after adjustment for most variables except for LDL-C, total cholesterol, Lp(a), citrate, and creatinine (Table 3).
Adjustment for Each Set of Intermediate Biomarkers
on the MED Intake–CVD Association
Next, to determine the extent to which the reduced risk of CVD associated with MED was influenced by potential mediators representing various physiological pathways, each set of mediators was added, 1 set at a time, to the basic model (Table 4). The addition of the hypertension group resulted in an attenuation of the inverse relation, which became nonsignificant (P for trend = .14). Similar results were observed in separate models that adjusted for BMI (P for trend = .14), traditional lipids (P for trend = .13), inflammation (P for trend = .15), glucose metabolism and insulin resistance (P for trend = .15), LDL measures (P for trend = .08), HDL measures (P for trend = .12), VLDL measures (P for trend = .11), and BCAA (P for trend = .08). The addition of apolipoproteins (P for trend = .06) and small-molecule metabolites (P for trend = .06) resulted in smaller attenuation compared with other
lipid-related biomarkers (see Table 4 for HR [95% CI] values with MED scores of 4-5 andⱖ6 vs MED scores of 0-3).
For the separate end points of stroke and CHD, MED intake had stronger inverse association with CHD compared with stroke (eTable 1 in theSupplement), although generally similar patterns were observed.
Proportion of Reduction of CVD Events Explained by Potential Mediators
We estimated the proportion of MED intake reduction in CVD (Figure) that was explained by each set of potential mediators. Inflammation biomarkers made the largest contribution (accounting for 29.2% of the MED-CVD benefit), followed by biomarkers of glucose metabolism and insulin resistance (27.9%), BMI (27.3%), blood pressure (26.6%), traditional lipids (26.0%), and measures of HDL (24.0%) or VLDL (20.8%) metabolism, and, to a lesser extent, LDL measures (13.0%), BCAAs (13.6%), apolipoproteins (6.5%) and small-molecule metabolites (5.8%). We also performed mediation analyses combining all these biomarkers (which are intercorrelated) in 1 model. Compared with the low–MED intake reference group, fully adjusted CVD HRs were 0.88 (95% CI, 0.76-1.02) and 0.89 (95% CI, 0.74-1.06) for the middle- and upper-intake groups, respectively (P for trend = .15), with a total mediation effect of 27.3%.
A generally similar pattern of risk reduction was observed for CHD and stroke risk (eTable 1 and eFigure in theSupplement).
We repeated these analyses using the total follow-up of 21.4 median years and observed materially similar results (eTable 2 in theSupplement). We also compared the reported mediation approach results with the counterfactual framework for single mediators, and the results were similar (eTable 3 in theSupplement).
Discussion
Although MED intake has been associated with the reduced risk of CVD in observational and interventional studies, it is unclear whether MED intake is associated with long-term CVD benefit in US populations, and what would be the underlying biological mechanisms that may mediate this benefit. In the current study conducted in a large initially healthy population of US women, we
Figure. Percentage Reduction in Cardiovascular Disease Events Associated With Mediterranean Diet Explained by Potential Risk Mediators
0 10 15 20 25 30 35
Inflammation
Glucose Metabolism and Insulin Resistance
Reduction, % Body Mass Index
Hypertention
Traditional Lipids
HDL Measures
VLDL Measures
Branched-Chain Amino Acids
LDL Measures
Apolipoproteins
Small-Molecule Metabolites
5
The proportion of the risk reduction for a Mediterranean diet score of 6 or higher (vs the reference group of Mediterranean diet score 0-3) is shown for potential mediators. The percentage mediation effect was calculated through the following formula: (HRbasic model− HRadjusted model)/ (HRbasic model− 1) × 100. The proportions were calculated based on 3 digits, so they might slightly differ from the estimates reported in Table 4. HDL indicates high-density lipoprotein; HR, hazard ratio; LDL, low-high-density lipoprotein; and VLDL, very low-density lipoprotein.
observed that higher MED intake was associated with approximately one-quarter lower risk of CVD events over a 12-year follow-up period. Furthermore, the benefit could be explained in part by known risk factors, both traditional and novel. Inflammation explained the largest proportion (29.2%) of the reduction in CVD, followed by glucose metabolism and insulin resistance (27.9%), BMI (27.3%), blood pressure (26.6%), traditional lipids (26.0%), and measures of HDL (24.0%) and VLDL (20.8%) metabolism, with lesser contributions from LDL, BCAAs, or other biomarkers. In total, these results show that these risk factors explained part of the association, but additional unmeasured factors may also contribute.
Previous studies on intermediate outcomes (but not clinical events) have demonstrated favorable effects of adherence to MED intake on cardiometabolic biomarkers including metabolic syndrome,34
improved insulin resistance,35
lower hsCRP and interleukin-6,36
and glucose metabolism.37
The PREDIMED trial showed that clinical CVD events may be reduced by approximately 30%,3
but the underlying mechanisms related to the protective association of MED intake with CVD is not well defined. Our findings support the role of MED on modifying inflammatory biomarkers, as we estimated that 29.2% of the MED benefit was related to inflammation. A recent study reported that hydroxytyrosol (found in fruits, nuts, legumes, and extra-virgin olive oil) repairs CVD-related oxidative damage and improves blood lipids.38
Likewise, in a substudy of 778 participants in PREDIMED, MED intake was associated with improvements in cellular and circulating anti-inflammatory properties.39
In a 2-year follow up of randomized treatment intervention with MED, Esposito et al36
reported significant improvements in hsCRP and endothelial function compared with the control diet. Dai et al40
also reported that reduced inflammation is an important mechanism linking the intake of MED and lower CVD risk.
We also observed the attenuation of the association of MED intake on cardiovascular risk through pathways related to glucose metabolism and insulin resistance, adiposity, blood pressure, traditional lipids, HDL and VLDL measures, and, to a lesser extent, LDL size and particles, but not LDL or total cholesterol. Similarly, Park et al41
reported that obesity mediates the association between MED intake on insulin resistance and inflammation biomarkers. It has been reported that components of MED, including peanuts and walnuts, can reduce lipids.42
We also observed that 24.0% of the association between MED and reduced CVD was explained by HDL measures. Similarly, in the subsample of the PREDIMED study, MED adherence was associated with increased HDL ability to esterify cholesterol and HDL vasodilatory capacity.43
The beneficial association with MED intake was stronger for CVD and CHD than for total stroke in the current study, but the relative contribution of different mediator groups was comparable. A recent meta-analysis also observed weaker or null association between MED intake and stroke.44
The MED score is based on the published literature and our a priori hypothesis. A diet score involves some level of arbitrary cut points in terms of which components it contains and the assignment of scores to different levels of intake. Although the MED score that we used in the current study is very similar to what has been reported in the literature about the choice of food items, there are some differences. The score used by Trichopoulou et al45
and Pitsavos et al46
also included potato intake, and Trichopoulou et al45
also included dairy products.
The current study has several advantages, including its prospective design, large sample size, detailed information about MED intake and measured biomarkers that range from conventional to novel risk pathways, and the long follow-up.
Limitations
There are several limitations that need to be acknowledged. We cannot rule out the possibility of residual confounding related to unmeasured CVD factors. Dietary intake was assessed through food frequency questionnaires, as self-reported diet intake might lead to exposure misclassification, including underreporting and overreporting, although that would attenuate the MED-CVD
association toward the null. It is possible that some of the covariates, including hypertension, may be influenced by MED intake, which suggests that these variables could be confounders or mediators.
Study participants were US female health care professionals who might have different behaviors than men or higher-risk individuals.
Conclusions
Our results suggest that a proportion of the lower risk of CVD events with MED intake may be accounted for by known factors related to inflammation, glucose metabolism and insulin resistance, BMI, blood pressure, and lipids (in particular HDL and VLDL). Despite this, a sizeable proportion of the potential benefit of MED intake with CVD risk reduction remains unexplained and requires future investigation into additional mechanisms.
ARTICLE INFORMATION
Accepted for Publication: October 22, 2018.
Published: December 7, 2018. doi:10.1001/jamanetworkopen.2018.5708
Open Access: This is an open access article distributed under the terms of theCC-BY License. © 2018 Ahmad S et al.
JAMA Network Open.
Corresponding Author: Samia Mora, MD, MHS, Center for Lipid Metabolomics, Brigham and Women's Hospital, Harvard Medical School, 900 Commonwealth Ave, Boston, MA 02215 (smora@bwh.harvard.edu).
Author Affiliations: Department of Medical Sciences, Molecular Epidemiology, Uppsala University, Uppsala, Sweden (Ahmad); Preventive Medicine Division, Brigham and Women’s Hospital, Harvard Medical School, Boston, Massachusetts (Ahmad, Moorthy, Demler, Ridker, Chasman, Mora); Center for Lipid Metabolomics, Brigham and Women’s Hospital, Harvard Medical School, Boston, Massachusetts (Ahmad, Moorthy, Mora); Department of Nutrition, Harvard T.H. Chan School of Public Health, Boston, Massachusetts (Ahmad, Hu); Cardiovascular Division, Brigham and Women's Hospital, Harvard Medical School, Boston, Massachusetts (Ahmad, Demler, Ridker, Mora); Channing Division of Network Medicine, Department of Medicine, Brigham and Women's Hospital and Harvard Medical School, Boston, Massachusetts (Hu).
Author Contributions: Drs Ahmad and Mora had full access to all of the data in the study and take responsibility for the integrity of the data and the accuracy of the data analysis.
Concept and design: Ahmad, Hu, Mora.
Acquisition, analysis, or interpretation of data: All authors. Drafting of the manuscript: Ahmad.
Critical revision of the manuscript for important intellectual content: All authors. Statistical analysis: Ahmad, Moorthy, Demler.
Obtained funding: Mora.
Administrative, technical, or material support: Hu, Ridker, Mora. Supervision: Hu, Ridker, Chasman, Mora.
Conflict of Interest Disclosures: Dr Hu reported receiving research support from the California Walnut Commission and honoraria for lectures from Metagenics and Standard Process and honoraria from Diet Quality Photo Navigation outside the submitted work. Dr Ridker received research grant support from AstraZeneca, Novartis, Amgen, Pfizer, and NHLBI, and is listed as a coinventor on patents held by the Brigham and Women's Hospital related to the use of inflammatory biomarkers in CVD (licensed to AstraZeneca and Siemens). Dr Mora received institutional research grant support from Atherotech Diagnostics for research outside the current work, served as a consultant and member of the scientific advisory board to Quest Diagnostics, and has a patent regarding the use of glycoprotein acetylation in relation to colorectal cancer risk. No other disclosures were reported.
Funding/Support: The Women’s Health Study is supported by the National Institutes of Health (grants CA047988, HL043851, HL080467, HL099355, and UM1 CA182913). Dr Ahmad was supported through a fellowship and research support from Swedish Heart-Lung Foundation (grants 20150711 and 20170988), Nutricia Research Foundation (2016-T1), and the Henning och Johan Throne-Holst stiftelse Fellowship. Dr Hu was supported by grants HL60712, HL118264, and DK112940 from the National Institutes of Health. Dr Demler was supported by a K award from the National Heart, Lung, and Blood Institute of the National Institutes of Health under award number K01HL135342-02. Dr Mora was supported by the research grants from the National Institute
of Diabetes and Digestive and Kidney Diseases (grant DK112940); National Heart, Lung, and Blood Institute (grants R01HL134811 and K24 HL136852); American Heart Association (grant 0670007N); and the Molino Family Trust. In addition, LabCorp provided the LipoProfile IV results at no additional cost.
Role of the Funder/Sponsor: The funders had no role in the design and conduct of the study; collection, management, analysis, and interpretation of the data; preparation, review, or approval of the manuscript; and decision to submit the manuscript for publication.
REFERENCES
1. Hu FB. Dietary pattern analysis: a new direction in nutritional epidemiology. Curr Opin Lipidol. 2002;13(1):3-9. doi:10.1097/00041433-200202000-00002
2. Estruch R, Ros E, Salas-Salvadó J, et al; PREDIMED Study Investigators. Primary prevention of cardiovascular disease with a Mediterranean diet supplemented with extra-virgin olive oil or nuts. N Engl J Med. 2018;378 (25):e34. doi:10.1056/NEJMoa1800389
3. Estruch R, Ros E, Salas-Salvadó J, et al; PREDIMED Study Investigators. Primary prevention of cardiovascular disease with a Mediterranean diet. N Engl J Med. 2013;368(14):1279-1290. doi:10.1056/NEJMoa1200303
4. Fung TT, Rexrode KM, Mantzoros CS, Manson JE, Willett WC, Hu FB. Mediterranean diet and incidence of and mortality from coronary heart disease and stroke in women. Circulation. 2009;119(8):1093-1100. doi:10.1161/ CIRCULATIONAHA.108.816736
5. Knoops KT, de Groot LC, Kromhout D, et al. Mediterranean diet, lifestyle factors, and 10-year mortality in elderly European men and women: the HALE project. JAMA. 2004;292(12):1433-1439. doi:10.1001/jama.292.12.1433
6. Sofi F, Cesari F, Abbate R, Gensini GF, Casini A. Adherence to Mediterranean diet and health status: meta-analysis. BMJ. 2008;337:a1344. doi:10.1136/bmj.a1344
7. Eckel RH, Jakicic JM, Ard JD, et al; American College of Cardiology/American Heart Association Task Force on Practice Guidelines. 2013 AHA/ACC guideline on lifestyle management to reduce cardiovascular risk: a report of the American College of Cardiology/American Heart Association Task Force on Practice Guidelines. Circulation. 2014; 129(25)(suppl 2):S76-S99. doi:10.1161/01.cir.0000437740.48606.d1
8. US Department of Health and Human Services and US Department of Agriculture. 2015-2020 Dietary Guidelines for Americans, eighth edition. 2015.http://health.gov/dietaryguidelines/2015/guidelines. Accessed November 15, 2018.
9. de Lorgeril M, Salen P, Martin JL, Monjaud I, Delaye J, Mamelle N. Mediterranean diet, traditional risk factors, and the rate of cardiovascular complications after myocardial infarction: final report of the Lyon Diet Heart Study.
Circulation. 1999;99(6):779-785. doi:10.1161/01.CIR.99.6.779
10. Kris-Etherton P, Eckel RH, Howard BV, St Jeor S, Bazzarre TL; Nutrition Committee Population Science Committee and Clinical Science Committee of the American Heart Association. AHA Science Advisory: Lyon Diet Heart Study: benefits of a Mediterranean-style, National Cholesterol Education Program/American Heart Association Step I Dietary Pattern on Cardiovascular Disease. Circulation. 2001;103(13):1823-1825. doi:10.1161/01. CIR.103.13.1823
11. Fitó M, Guxens M, Corella D, et al; PREDIMED Study Investigators. Effect of a traditional Mediterranean diet on lipoprotein oxidation: a randomized controlled trial. Arch Intern Med. 2007;167(11):1195-1203. doi:10.1001/ archinte.167.11.1195
12. Salas-Salvadó J, Fernández-Ballart J, Ros E, et al; PREDIMED Study Investigators. Effect of a Mediterranean diet supplemented with nuts on metabolic syndrome status: one-year results of the PREDIMED randomized trial. Arch
Intern Med. 2008;168(22):2449-2458. doi:10.1001/archinte.168.22.2449
13. Estruch R, Ros E, Salas-Salvadó J, et al. Retraction and republication: primary prevention of cardiovascular disease with a Mediterranean diet. N Engl J Med 2013;368:1279-90. N Engl J Med. 2018;378(25):2441-2442. doi: 10.1056/NEJMc1806491
14. Sotos-Prieto M, Bhupathiraju SN, Mattei J, et al. Changes in diet quality scores and risk of cardiovascular disease among US men and women. Circulation. 2015;132(23):2212-2219. doi:10.1161/CIRCULATIONAHA.115. 017158
15. Mora S, Cook N, Buring JE, Ridker PM, Lee IM. Physical activity and reduced risk of cardiovascular events: potential mediating mechanisms. Circulation. 2007;116(19):2110-2118. doi:10.1161/CIRCULATIONAHA.107.729939
16. Ridker PM, Cook NR, Lee IM, et al. A randomized trial of low-dose aspirin in the primary prevention of cardiovascular disease in women. N Engl J Med. 2005;352(13):1293-1304. doi:10.1056/NEJMoa050613
17. Lee IM, Cook NR, Gaziano JM, et al. Vitamin E in the primary prevention of cardiovascular disease and cancer: the Women’s Health Study: a randomized controlled trial. JAMA. 2005;294(1):56-65. doi:10.1001/jama.294.1.56
18. Liu S, Buring JE, Sesso HD, Rimm EB, Willett WC, Manson JE. A prospective study of dietary fiber intake and risk of cardiovascular disease among women. J Am Coll Cardiol. 2002;39(1):49-56. doi:10.1016/S0735-1097(01) 01695-3
19. Mitrou PN, Kipnis V, Thiébaut AC, et al. Mediterranean dietary pattern and prediction of all-cause mortality in a US population: results from the NIH-AARP Diet and Health Study. Arch Intern Med. 2007;167(22):2461-2468. doi:10.1001/archinte.167.22.2461
20. Lee IM, Cook NR, Manson JE, Buring JE, Hennekens CH. Beta-carotene supplementation and incidence of cancer and cardiovascular disease: the Women’s Health Study. J Natl Cancer Inst. 1999;91(24):2102-2106. doi:10. 1093/jnci/91.24.2102
21. Wolak-Dinsmore J, Gruppen EG, Shalaurova I, et al. A novel NMR-based assay to measure circulating concentrations of branched-chain amino acids: elevation in subjects with type 2 diabetes mellitus and association with carotid intima media thickness. Clin Biochem. 2018;54:92-99. doi:10.1016/j.clinbiochem.2018.02.001
22. Tobias DK, Lawler PR, Harada PH, et al. Circulating branched-chain amino acids and incident cardiovascular disease in a prospective cohort of US women.Circ Genom Precis Med. 2018;11(4):e002157.
23. Mora S, Otvos JD, Rifai N, Rosenson RS, Buring JE, Ridker PM. Lipoprotein particle profiles by nuclear magnetic resonance compared with standard lipids and apolipoproteins in predicting incident cardiovascular disease in women. Circulation. 2009;119(7):931-939. doi:10.1161/CIRCULATIONAHA.108.816181
24. Akinkuolie AO, Buring JE, Ridker PM, Mora S. A novel protein glycan biomarker and future cardiovascular disease events. J Am Heart Assoc. 2014;3(5):e001221. doi:10.1161/JAHA.114.001221
25. Shalaurova I, Connelly MA, Garvey WT, Otvos JD. Lipoprotein insulin resistance index: a lipoprotein particle-derived measure of insulin resistance. Metab Syndr Relat Disord. 2014;12(8):422-429. doi:10.1089/met. 2014.0050
26. McGarrah RW, Kelly JP, Craig DM, et al. A novel protein glycan-derived inflammation biomarker independently predicts cardiovascular disease and modifies the association of HDL subclasses with mortality. Clin Chem. 2017;63 (1):288-296. doi:10.1373/clinchem.2016.261636
27. Baron RM, Kenny DA. The moderator-mediator variable distinction in social psychological research: conceptual, strategic, and statistical considerations. J Pers Soc Psychol. 1986;51(6):1173-1182. doi: 10.1037/0022-3514.51.6.1173
28. Lee CD, Folsom AR, Blair SN. Physical activity and stroke risk: a meta-analysis. Stroke. 2003;34(10): 2475-2481. doi:10.1161/01.STR.0000091843.02517.9D
29. Rothman KJ. Measures of effect and association. In: Modern Epidemiology. Philadelphia, PA: Lippincott Williams & Wilkins; 1998:47-64.
30. Valeri L, Vanderweele TJ. Mediation analysis allowing for exposure-mediator interactions and causal interpretation: theoretical assumptions and implementation with SAS and SPSS macros. Psychol Methods. 2013;18 (2):137-150. doi:10.1037/a0031034
31. Díaz-López A, Bulló M, Martínez-González MA, et al; PREDIMED (Prevención con Dieta Mediterránea) Reus Study Investigators. Effects of Mediterranean diets on kidney function: a report from the PREDIMED trial. Am J
Kidney Dis. 2012;60(3):380-389. doi:10.1053/j.ajkd.2012.02.334
32. Casas R, Sacanella E, Urpí-Sardà M, et al. Long-Term Immunomodulatory Effects of a Mediterranean Diet in Adults at High Risk of Cardiovascular Disease in the PREvención con DIeta MEDiterránea (PREDIMED) randomized controlled trial. J Nutr. 2016;146(9):1684-1693. doi:10.3945/jn.115.229476
33. Hernáez Á, Castañer O, Goday A, et al. The Mediterranean diet decreases LDL atherogenicity in high cardiovascular risk individuals: a randomized controlled trial. Mol Nutr Food Res. 2017;61(9). doi:10.1002/mnfr. 201601015
34. Tortosa A, Bes-Rastrollo M, Sanchez-Villegas A, Basterra-Gortari FJ, Nuñez-Cordoba JM, Martinez-Gonzalez MA. Mediterranean diet inversely associated with the incidence of metabolic syndrome: the SUN prospective cohort. Diabetes Care. 2007;30(11):2957-2959. doi:10.2337/dc07-1231
35. Buscemi S, Nicolucci A, Mattina A, et al. Association of dietary patterns with insulin resistance and clinically silent carotid atherosclerosis in apparently healthy people. Eur J Clin Nutr. 2013;67(12):1284-1290. doi:10.1038/ ejcn.2013.172
36. Esposito K, Marfella R, Ciotola M, et al. Effect of a mediterranean-style diet on endothelial dysfunction and markers of vascular inflammation in the metabolic syndrome: a randomized trial. JAMA. 2004;292(12): 1440-1446. doi:10.1001/jama.292.12.1440
37. Carter SJ, Roberts MB, Salter J, Eaton CB. Relationship between Mediterranean diet score and
atherothrombotic risk: findings from the Third National Health and Nutrition Examination Survey (NHANES III), 1988-1994. Atherosclerosis. 2010;210(2):630-636. doi:10.1016/j.atherosclerosis.2009.12.035
38. Kouli GM, Panagiotakos DB, Kyrou I, et al. Olive oil consumption and 10-year (2002-2012) cardiovascular disease incidence: the ATTICA study [published online November 9, 2017]. Eur J Nutr. doi: 10.1007/s00394-017-1577-x
39. Estruch R. Anti-inflammatory effects of the Mediterranean diet: the experience of the PREDIMED study. Proc
Nutr Soc. 2010;69(3):333-340. doi:10.1017/S0029665110001539
40. Dai J, Miller AH, Bremner JD, et al. Adherence to the Mediterranean diet is inversely associated with circulating interleukin-6 among middle-aged men: a twin study. Circulation. 2008;117(2):169-175. doi:10.1161/ CIRCULATIONAHA.107.710699
41. Park YM, Zhang J, Steck SE, et al. Obesity mediates the association between Mediterranean diet consumption and insulin resistance and inflammation in US adults. J Nutr. 2017;147(4):563-571. doi:10.3945/jn.116.243543
42. Hu FB, Stampfer MJ. Nut consumption and risk of coronary heart disease: a review of epidemiologic evidence.
Curr Atheroscler Rep. 1999;1(3):204-209. doi:10.1007/s11883-999-0033-7
43. Hernáez Á, Castañer O, Elosua R, et al. Mediterranean diet improves density lipoprotein function in high-cardiovascular-risk individuals: a randomized controlled trial. Circulation. 2017;135(7):633-643. doi:10.1161/ CIRCULATIONAHA.116.023712
44. Rosato V, Temple NJ, La Vecchia C, Castellan G, Tavani A, Guercio V. Mediterranean diet and cardiovascular disease: a systematic review and meta-analysis of observational studies [published online November 25, 2017]. Eur
J Nutr. doi:10.1007/s00394-017-1582-0
45. Trichopoulou A, Costacou T, Bamia C, Trichopoulos D. Adherence to a Mediterranean diet and survival in a Greek population. N Engl J Med. 2003;348(26):2599-2608. doi:10.1056/NEJMoa025039
46. Pitsavos C, Panagiotakos DB, Tzima N, et al. Adherence to the Mediterranean diet is associated with total antioxidant capacity in healthy adults: the ATTICA study. Am J Clin Nutr. 2005;82(3):694-699. doi:10.1093/ajcn/ 82.3.694
SUPPLEMENT.
eFigure. Percentage Reduction in CHD and Stroke Events Associated With Mediterranean Diet That Is Explained by Potential Risk Mediators
eTable 1. Association of Mediterranean Diet With CHD and Stroke Events After Adjustment for Sets of Mediators eTable 2. Association of Mediterranean Diet With CVD Events After Adjustment for Sets of Potential Mediators Within Total-Years of Follow-up (Median 21.4 Years)
eTable 3. Mediation Effect Explained Through Different Risk Factors Regarding Mediterranean Diet Intake With CVD Events