Housing market and urban growth in China:
what are the factors affecting the housing prices?
Bachelor’s thesis within economics Author: Danyuan Liu 800724-0768
Supervisor: Charlotta Mellander; Özge Öner; Pia Nilsson Jönköping June 2012
Abstract
A rapid urbanization process facilitated an enormous expansion of the cities and stimu-lated the development of the urban housing markets in China. The primary purpose of this thesis is to find factors influencing the urban housing prices. Based on the supply and demand theory, I examine housing prices in 95 cities in 2010 related to population growth, wages, manufacturing employment, human capital, pollution, and housing in-vestment using a cross section data analysis. The empirical results indicate that all those factors are significantly related to the housing prices. I focus on population growth, a proxy for the urbanization process, as the core determinant to analyze housing prices in China. In addition, the results also find that cities located in the eastern area have ave-ragely a higher productivity than the ones located in the mid-west, and the higher hous-ing prices in the eastern area are explained by the higher level of population growth and wages.
Table of Contents
1
Introduction ... 1
2
Background ... 4
2.1 Urban land supply system ... 4
2.2 Housing policy in China ... 4
2.3 Hukou system ... 5
2.4 Urbanization process ... 6
2.5 Regional disparity ... 7
3
Theoretical Framework ... 9
3.1 Housing prices ... 9
3.2 Housing demand and supply ... 9
3.3 Factors on the demand side ... 10
3.4 Factors on the supply side ... 10
4 Empirical Model……… ... …11
5 Variables & Data ... 12
6 Methodology……… ... …13
7
Findings ... 14
7.1 Scatter-plots analysis ... 14
7.2 Correlation coefficient analysis ... 15
7.3 OLS results ... 15
8
Conclusion ... 18
List of references ... 19
Figures/Graphs/Tables
Figure 1.1 ... 1 Figure 2.1 ... 5 Figure 2.2 ... 6 Figure 2.3 ... 7 Figure 2.4 ... 8 Figure 2.5 ... 8 Table 5.1 ... 12 Figure 7.1 ... 14 Table 7.1 ... 15 Table 7.2 ... 16Appendix
Figure appendix 1 ... 22 Figure appendix 2 ... 221 Introduction
Owning the largest population (1.3 billion) and the fastest real GDP growth (on average over 9 per cent)1, China has achieved a primary role in the global economy after more than three decades development since the open-door policy in 19782. The prosperity of Chinese housing market is a reflection of the tremendous economic growth.
Figure 1.1: Constant quality real price index for newly-built private housing in 35 Chinese cites, 2000(Jan.)-2010(Jan.) Source: Institute of Real Estate Studies, Tinghua University
The graph (Figure 1.1) borrowed from the study of Wu et al. (2010), shows an approx-imately 140 per cent appreciation of housing prices across 35 major Chinese cities over the past decade. Price growth rates in major Chinese cities such as Beijing, Hangzhou, Shanghai, Shenzhen and Sanya from 2003 (1) to 2010 (1) were at least 10 per cent an-nually.
The surging price appreciation of Chinese housing markets has led to a hot dispute about whether there will be a pricing bubble or not and what the main factors affecting the house prices are?
According to the S&P/Case-Shiller national price index, the United Stated housing market has witnessed a price bubble after a booming period from the beginning of 1995 to the peak of the second quarter of 2006 with a cumulative 144 per cent increase in nominal home values, which is a similar growth as the appreciation of Chinese housing prices. Since then the housing prices have declined and by January 2012, the average home prices across the United States were around 75 per cent lower as compared to the peak, reaching similar level as in early 2003, nearly a decade ago. Would the Chinese housing market be the next one?
1 See http://search.worldbank.org/data?qterm=China+GDP++growth+rate&language=&format=
2 The Open Door Policy, adoptted by Deng Xiaopings in 1978 after a closed doop policy encouraged by
As we know in economic theory, the housing price in a market-oriented economy should be settled by the equilibrium price determined by a balance of the housing de-mand and supply. To estimate a price bubble, we should consider whether there is an excess supply or demand in the housing market.
In fact, the boom of Chinese housing market associates with a rapid urbanization process undergoing throughout the country. In 2010, the share of urban population in China has increased from 28 percent in 1990 to 50 per cent, and there were over 160 ci-ties with more than one million inhabitants. Meanwhile, the annual urban real income per capita has boosted 179 per cent from 1998 to 2010. Several studies (Zhang and Song, 2003; Ma, 2001) indicate that the main source of China’s urbanization is the mi-gration from rural to urban area and the Chinese mimi-gration is accompanied by its eco-nomic growth. Glaeser, et al., (1995) elaborate that population growth is the primary measure of city growth, and it is an index to show which cities are becoming increasing-ly attractive for inhabitants as labor markets. In addition, income growth can express some portion of productivity growth, and improve the life quality, which is explained by amenities.
Therefore, it is the rapid urbanization process that creates an enormous expansion of the cities and a demand shock on the housing markets, surging the housing prices.
Due to the policies that emphasize the development of eastern areas, the eastern cities are more competitive in attracting Foreign Direct Investment (FDI) and migrant labors, so that the regional inequality between east and mid-west is reflected in city’s produc-tivity, population growth, wage levels, infrastructure and housing prices (Chen, 1991). Glaeser and Saiz (2003) conclude that the skilled cities grow faster than the less skilled ones in light of the increase of the cities’ productivity. In 2010, there are 22 cities where housing prices overpass the total average housing prices in China and all those cities are located in the eastern region. On the contrary, all the west cities’ housing prices lower than the national average prices.
Purpose
In this paper, I investigate the urban housing markets in China and analyze factors af-fecting the housing prices through demand and supply theory, using a cross-sectional data. The 95 cities are a sample out of total 654 cities and the data is based on the year 2010. The sample covers not only all the 35 major cities focused by most other studies but also 60 less major cities, which is a representative selection for the overall cities. Among those cities, there are 64 cities located in the eastern area, and 31 cities located in the mid-western area.
Methodology
I employ a variety of econometric techniques to test the effect of the housing price against to five demand side factors: population growth, wages, manufacturing employ-ment, human capital and pollution. Due to the availability of the data, the cost of land is not accessible; I use the completions of residential housing investment as a proxy for both the construction costs and government regulations to explain the housing supply. I focus on the population growth, a proxy for the urbanization process, as the main de-terminant of the urban housing prices, which is particularly related to Case and May-er(1996), Capozza et al., (2002) and Glaseser et al., (2005 and 2006). In addition, there are two dummy variables as proxies for regional factors. One represents eastern cities
which have average higher housing prices than mid-western cities. The other represents Shenzhen, Shanghai, Beijing, Hangzhou, and Sanya which are all defined as “superstar” cities where the housing prices are far higher than the national average prices.
2 Background
2.1. Urban Land supply system
After the Chinese Economic Reform in 1978, China established its urban land system based on Hong Kong’s experience, which employs a leasehold system to allocate land. The government has the ownership of land and distributes the Land Use Rights (LURs). LURs are offered in the open market and treated as normal commodities. They have a limited period of occupation: 70 years for residential purposes, 50 years for industrial or mixed use and 40 years for commercial uses (Zhang, 1997).
In the housing supply process, the local government first leases land parcels to devel-opers. The developers then build housing units on the parcels and sell those units to households. During the leasehold period the households have the right to live in, rent out or sell their housing units in the market. Comparing to the US with its private land ownership, China’s house price formation mechanism is unique (Yu, 2010). Therefore, the government can easily intervene in the real estate market by regulation policy towards the land system. Besides, the revenue of the land distribution is an important revenue source for the local government.
2.2. Housing policy in China
Historically, the housing policy in China can be divided into three stages (Wu et al., 2011; Zhong and Hays, 1996; Wang, 1996):
1. 1949-1978, welfare-based public housing system
Urban residential housing system in China was characterized by a highly centra-lized planning system in housing investment and supply, rigid administrative con-trol over housing distribution and welfare policy in housing consumption. Public housing was built by the work unit, which is called Danwei in Chinese and is the basic unit of social organization in China, and allocated directly to their employees as part of a comprehensive welfare system. There was no sign for any commodity housing market in this period.
2. 1978-1998, housing reform period
The monopoly role of the state started to change in 1978, when the state initiated trials to privatize the state-owned residential housing system in several coastal ci-ties, which expanded to over 100 cities and then the entire country.
In 1998, the State Council issued the 23rd Amendment, a new housing policy, which is considered to be a milestone in the Chinese housing market. The aim of the housing policy was to
end direct housing distribution and introduce housing cash subsidies create a dominated commercial housing system complemented with
state-supported economically affordable housing for low-income households set up loans and mortgages for the urban housing markets
3. After 1998, commodity housing system
As a result of the recent reform in 1998, the Chinese housing market has totally transformed to a market-oriented mechanism and has witnessed a booming.
Ac-cording to Yearbook of Chinese Cities 2011, the residential housing investment accounted for approximately 10 per cent of total fixed investment on average across the cities, or about 10 per cent of the urban GDP in 2010.
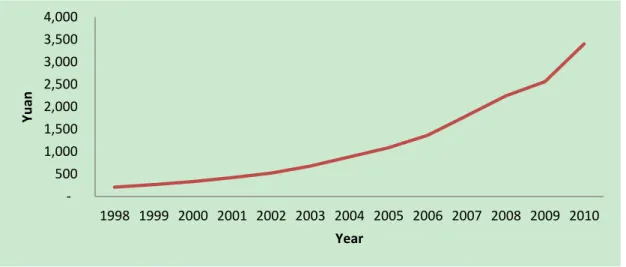
Figure 2.1: The investment of urban housing estate from 1998 to 2010. Source: Statistics Yearbook of China 2011.
Figure 2.1, indicates a total gross private residential housing investment from 1998 to 2010, and displays an average growth of 21 per cent per annum. According to Annual Statistics & Analysis of China’s M&As 2010, the real estate is one of the largest single components of national wealth as well as the largest component of annual net private investment. Fu, et al., (2008) point out the new housing supply is a driving factor for urban growth.
2.3. Hukou system
The Chinese household registration system (hukou 户口 or huji 户籍) broadly divides citizens into two classes: non-agricultural and agricultural hukou residents. From 1958 until 1978, the Hukou System created “an invisible wall” between urban and ru-ral area and treated 800 million ruru-ral residents as inferior second-class citizens. Under this system, the non-agricultural residents could enjoy state-provided housing, em-ployment, education and access to medical care and other social welfare benefits. In contrast, the agricultural residents were expected to be largely self-sufficient (Chan and Buckingham, 2008). Besides, the Hukou System was strictly under control. If a rural resident want to migrate to the city, he or she must provide a valid permit. Therefore, it was a dream for the rural residents to become urban residents.
The situation started to change after the Chinese Economic Reform in 1978, when it was possible for the rural residents to migrate and work in the cities without a valid permit. It is the Chinese Economic Reform provided incentives for officials to relax the Hukou System due to the growing demand of cheap labors from the coastal area, which was the first open area for FDI. The constraints imposed by the Hukou system have lessened more since the 1990s, migrants without Hukou are allowed to work in cities and buy housing in the housing markets.
The liberalization both in urban housing and labor markets significantly brought down the barriers of labor mobility and endowed Chinese people with the unexpected freedom to live and work wherever they want (Zheng, Kahn, Liu, 2010).
- 500 1,000 1,500 2,000 2,500 3,000 3,500 4,000 1998 1999 2000 2001 2002 2003 2004 2005 2006 2007 2008 2009 2010 Yu an Year
2.4. Urbanization process
Urbanization is defined as the growth on both urban population and urban spatial. The boom of Chinese housing market associates with a rapid urbanization process undergoing in the country.
As a result of the relaxation of the Hukou system combined with the Chinese Eco-nomic Reform, China’s major cities have experienced significant income and popula-tion growth. The inflow of FDI and privatizapopula-tion of state-owned enterprises created massive employment opportunities, which fostered urban population growth. The ru-ral-urban migration turns out to be the dominate source of Chinese urban population growth in the last three decades.
Figure 2.2: Urbanization in China, 1953-2010. Source: National Bureau of Statistics China.
According to the 6th population census in 2010 (Figure 2.2), the urban population which comprises around 665.57 million, accounts for half of the whole population, an increase from 28 per cent in 1990. Today, the rural-urban migration is expected to continue and hundreds of millions of rural people in China are soon expected to move to cities, forcing the central and local government to provide the necessary infrastruc-ture to meet the soaring demand. The strong urbanization trend is one of the key fac-tors corroborating the excess demand for the urban housing in China.
Several studies (Zhang and Song, 2003; Ma, 2001) indicate that the main source of China’s urbanization is the migration from rural to urban area and the Chinese migra-tion is accompanied by its economic growth. Glaeser, et al., (1995) indicate that pop-ulation growth is the primary measure of city growth, and it is an index to show which cities are becoming increasingly attractive for inhabitants as labor markets. In addition, income growth can express some portion of productivity growth, and im-prove the life quality, which is explained by amenities. Zhang and shong (2003) con-clude that the relative high rural-urban income gap is the driving force behind the ur-banization.
Figure 2.3, in the next page, illustrates that both annual urban income per capita and rural income per capita has increased enormously since 1978, but the rural-urban
in-0 200 400 600 800 1000 1200 1400 1600 1953 1964 1982 1990 2000 2010 M ill io n Year
Total Population Urban Population
come gap has been constantly high over the last three decades. Especially after 2000, the urban income has been 3 times higher than the rural income.
Figure 2.3: The annual urban real income per capita and the annual net rural income per capita 1978-2010; Sources: National Bureau of Statistics China.
In order to accommodate the rapid growth of the urban population, China has up-graded many towns into urban cities. The number of cities has increased from 450 in 1989 to 654 in 2010. The liberalization both in urban housing and labor markets is pushing Chinese cities toward open system cities, where the labor market and the land market clear simultaneously. Up to now there are over 160 cities with more than one million inhabitants. Meanwhile, Chinese cities are also ranked among the most polluted places discharging the highest amount of sulfur dioxide in the world today (Zheng, Kahn and Liu, 2008).
2.5. Regional disparity
Since 1978, the Chinese Economic Reform has been associated with a serious differ-ent developmdiffer-ent strategy between the eastern and mid-western region. Under this strategy, eastern region has greatly benefited from the reforms, and is more competi-tive in attracting FDI and migrants, while the mid-western region has lagged behind severely (Cai et al., 2002).
The spatial inequality between eastern and mid-western area is reflected in city’s productivity, population growth, wage levels, infrastructure and housing prices are higher for eastern cities than for mid-western cites (Chen, 1991). Glaeser and Saiz (2003) find that the skilled cities grow faster than the less skilled ones due to the in-crease of the cities’ productivity. Glaeser, Kolko and Saiz (2001) find that the agglo-meration effects naturally determine the future of the cities due to the population den-sity can increase a workers’ productivity premium. In addition, the difference of the cities can be indicated by the quality of life. Individuals trend to choose the place of residence where have more job opportunities and satisfied public goods and services (Florida, Mellander and Rentfrow, 2011).
0.0 5000.0 10000.0 15000.0 20000.0 25000.0 1978 1980 1985 1990 1991 1992 1993 1994 1995 1996 1997 1998 1999 2000 2001 2002 2003 2004 2005 2006 2007 2008 2009 2010 Yu an /p e r-cap ita Year
Figure 2.4: The average housing prices for the top 22 cities in China in 2010. Sources: China Real Estate Index Sys-tem (CREIS) of China Index Academy.
Figure 2.4 depicts that 22 cities´ housing prices overpass the total average housing pric-es in China and that all those citipric-es are located in the eastern region. Among them, Shenzhen, Shanghai, Beijing, Hangzhou, and Sanya are even more than twice as high as the average housing prices. Gyourko et al., (2006) claim that housing prices in superstar cities appreciate far more than the national average due to population and income growth and the scarcity of land. In this paper, I define Shenzhen, Shanghai, Beijing, Hangzhou, and Sanya as “superstar” cities for a proxy for one regional factor.
Figure 2.5: The average housing prices for the 31 cities located in mid-west in China in 2010. Sources: China Real Estate Index System (CREIS) of China Index Academy.
Figure 2.5 illustrate that all the 31 mid-western cities, using in the sample have a lower housing prices than the national average cities, which emphasizes that mid-western area have a lower housing prices than eastern area. Therefore, the location in east or mid-west is another proxy to explain the regional factors.
- 5,000 10,000 15,000 20,000 25,000 30,000 Av era ge Fu o sh an Jiaxin g H u zh o u Jin an Qin gd ao Taiz h o u Zh u h ai Sh ao xin g Xiame n Dalia n Su zh o u Tian jin N an jin g Fu zh o u N in gb o Gu an gz h o u Wenz h o u San ya H an gzh o u Be ijin g Sh an gh ai She n zh en Yu an City 0 1000 2000 3000 4000 5000 6000 7000 8000 9000 10000 Xi n xi an g Xian gtan Bao ji Zh u zh o u Mi an yan g Xin in g G an zh o u Jil in G u iyan g Ur u mq i Lu o yan g N an ch an g Maan sh an Ba o to u Taiyu an Yi n ch u an W u h u Yi ch an g H efei Ch an gs h a Erd o s Ch an gc h u n Lan zh o u Ch o n gq in g zh en gz h o u H o h h o t Xian W u h an Ku n min g H arb in Ch en gd u A ve rag e Yu an City
3 Theoretical framework
Real estate is a durable asset, and the value of it makes up a prime component of nation-al wenation-alth. But it is difficult to assess its vnation-alue because the heterogeneity in attributes (structural and locational), infrequent trade, and a negotiated pricing process (Crecine et al., 1967 and Cappozza et al., 2002). The literature about the interplay between housing market and the urban economy is very extensive, from the leading early urban econo-mists Alonso (1964) and Muth (1969) to the contemporary econoecono-mists Glaeser, Gyour-ko and Saks (2005 and 2006).
Considering the spatial dimension, the analysis of housing prices can be conducted in three contexts: national-level, cross-city level, and within a metropolis. It is common to test the interplay of macroeconomics factors with the housing prices in the national-level analysis, while within a metropolitan housing market, the price is determined by each region’s amenities and locational characteristics, which are the microeconomics factors (Case and Mayer, 1996). Cross-city pattern analysis, based on both macro and micro level, considers not only fundamental economic factors, but also the specific loca-tion factors (Dipasquale and Wheaton, 1996).
3.1 Housing price
What determines housing prices? Why do the housing prices vary widely from cities to cities in China? In the economic context, the price of housing basically depends on the intersection of demand and supply, so that, all else equal, an increase in the mand to own the housing units will raise prices, while an expanding supply will de-crease prices.
Pi = f (Qid, Qis) (3.1)
Where Pi represents housing prices in the city i, and Qid and Qis are the quantities of
housing that are demanded and supplied in city i.
3.2 Housing demand and supply
According to Quigley (2002) housing demand in any market i is a function of hous-ing prices and income (INC), the size of the market which is indicated by the total population (POP) and employment (EMP). Demand is an increasing function of in-come and a decreasing function of price.
Qid = d(Pi, INCi, POPi, EMPi) (3.2)
In a same way, housing supply is a function of prices and vacancies (VACANCY) and the number of residential construction permits (CONST). Presumably, housing supply is an increasing function of prices and a decreasing function of vacancies.
Qis = S(Pi, VACANCYi, CONSTi) (3.3)
Combine equation 2 and 3 there is the function for pi
Therefore, housing prices appreciation reflects not only rising demand, but also li-mited supply (Saks, 2008). If there is a weak demand, then prices cannot be high, no matter what the supply is. And, if there is an unrestricted supply, then prices cannot be much higher than production costs, no matter what the demand is. Gyourko et al., (2006) label “superstars” for the metropolitan areas and towns where demand exceeds supply and supply growth is limited. The housing prices in “superstar” cities appre-ciate far more than the national average due to the income growth and the scarcity of land.
3.3 Factors on the demand side
The demand of housing units depends on rent and other macroeconomic and micro-economic factors which are broadly explained by household income, population, em-ployment, human capital, industrial pattern, urban amenities, the average level of in-terest rates and so on (Malpezzi, 1996).
Based on the investigation of 30 cities in the U.S., Hendershott and Abraham (1994) show that the inflation of construction cost, income growth and changes in after tax interest rates explain house price. Capozza et al. (2002) draw the conclusion that the house prices have a stable relationship to city size, income growth, population growth and real construction costs using 62 MSAs (metropolitan statistical areas) in the U.S. from 1979 to 1996. In an empirical study of Swedish panel data from 1968 to 1994, Hort’s (1998) claims a similar result. Based on the data in the Boston area in U.S. from 1982 to 1994, Case and Mayer (1996) evaluate that house prices dynamic is ex-plained by the employment patterns, population change from in-migration, a locali-ty’s crime rate, household income and the quality of local public school.
Roback (1982) points out those local amenities explain the regional wage and land rent differences. Glaser et al., (2001) illustrate that high-amenity cities have grown faster than low-amenity cities; meanwhile with a high level of human capital, the ur-ban productivity premium increases the rent. Therefore the urur-ban rent premium can be explained by the sum of urban productivity premium and urban amenity premium. There is a wealth of literature on human capital as a determinant of city growth (Chi-nitz, 1962; Jacobs, 1969; Lucas, 1988). Nowadays human capital is becoming more concentrated and clustered, not only increases the productivity of the local markets but also influences housing values by increasing the demand (Florida, 2002; Berry and Glaeser, 2005). Shapiro (2006) finds that metropolitan areas with greater num-bers of skilled workers experienced a faster increase in wages, rental prices and hous-ing prices. Florida and Mellander (2009)draw the conclusion that even the small group-artistic, bohemian and gay populations have a substantial direct influence to housing value, income and human capital.
3.4 Factors on the supply side
Comparing the factors studied on the demand sides, there exists less literature that explores the supply-side variables. Some studies have investigated that the housing prices are affected by the cost of land (Follain 1979; Smith 1976). Blackley and Fol-lain’s (1991) found that the costs of land and construction inputs are the primary fac-tors for determining housing prices.
Malpezzi (1996) has done a study focusing on the effects of regulation on land and housing prices. Glaeser, Gyourko and Saks (2005) indicate three supply-side factors: the availability and price of land, the cost of construction as well as government regu-latory to new construction. An empirical study (Saks 2008) finds that areas with a larger degree of regulation experience less residential construction and higher house prices and wages, but lower the growth of employment. The same conclusion is drawn by Glaeser, Gyourko and Saks (2005 and 2006) who enforce that housing supply has become very inelastic in some places due to restrictive zoning and other land use regulations. Moreover if an area becomes more productive, population, wag-es and housing pricwag-es all increase, while, an attractive area usually has a higher level of housing prices and population growth, but a low wages level.
To sum up, I use the following factors to examine the determinants of housing prices: population growth as a proxy for urbanization process
the share of manufacturing employment as employment pattern the annual income per worker as urban productivity
the percentage of the population with at least a college degree as human capital the sulphur dioxide discharge as urban amenities
the completions of housing investment as construction costs and government regulations
Besides, there are two dummy variables to explain the regional factors: eastern cities have average higher housing prices than mid-western cities
Shenzhen, Shanghai, Beijing, Hangzhou, and Sanya are defined to be “superstar” cities where the housing prices are far higher the national average housing prices
4 Empirical Model
Using the supply and demand theory, the demand and supply functions are based on Quigley (2002):
Qid = d(Pi, POPGRi, MANUi, WAGESi, HUCAi, POLUi) (3.5)
Qis = s(Pi, INVESTi) (3.6)
Where Pi are the housing prices in city i; POPGRi is the population growth in city i,
MANUi is the share of manufacturing employment in city i, WAGESi is the annual
in-come per worker in city i; POLUi is the sulphur dioxide discharge in city i, HUCAi is
the percentage of the population with at least a college degree in city i, and INVESTi is
the percentage of completions of residential housing investment of the total investment in city i.
The equilibrium levels can be solved from the equal of demand and supply. That is, Qid = Qis, then there is the function of Pi,
5 Variables & Data
The variables cover 95 cities as a sample out of 654 cities in China, and are for the year 2010. The cities include not only all the 35 major cities focused by most other studies but also 60 less major cities, which is a representative selection for the overall cities. The cities are categorized by the level in the administrative hierarchy: 4 total municipal-ities, 24 total provincial capital cmunicipal-ities, 4 total Special Economic Zone Cmunicipal-ities, 6 sub-provincial capital cities and 57 prefecture-level cities out of 622 in total3. Among those cities there are 64 cities located in the eastern area, and 31 cities located in the mid-western area.
Table 5.1 Descriptive Statistics
N Minimum Maximum Mean Std. Deviation Housing prices 95 8 10 8,81 .456 Population growth 95 -.108 .72 .154 .150 Manufacturing 95 .002 14.071 .265 .259 Wages 95 98.654 110.596 10.364 .219 Human capital 95 .010 .310 .116 .061 Pollution 95 .124 7.932 5.894 11.018 Investment 95 .012 .443 .134 .059
Table 5.1 describes the key variables for analyzing housing prices. The variables such as housing prices, wages, pollution are in logged form, but others measured by percen-tage in a normal form.
Housing prices: This variable is average housing prices in the cities. It is calculated by
the formula
, where, the is average price at time t of the city, is the
price at time t of the project i in city j, and is the adjusted building area. It is based
on the China Real Estate Index System (CREIS) of China Index Academy.
Population growth: The measure is defined as the changes of total population of the 95
cities from 2000 to 2010. It is a proxy for the urbanization process that is the rural-urban migration. An increase of the population implies a higher demand for the local housing units. The data is taken from the Statistics Yearbook of Chinese Cities 2011.
Manufacturing: The variable is based on the employment share of the manufacturing
industry compared to the total number of employment. As the pillar industry in China, manufacturing is a good indicator of economic growth and the main channel for the ur-ban employment. The data is calculated by the number of manufacturing employment divided by the total number of employment according to the Statistics Yearbook of Chi-nese Cities 2011.
Wages: The variable is defined by the total labor remuneration paid by the urban units
divided by the annual total number of the staff. The income includes wages, salary, piece-rate payments, commission, cash bonuses and so on earned before taxes. The data
is based on the reported annual real income per worker from the Statistics Yearbook of Chinese Cities 2011.
Human capital: This indicates the percentage of the population with a college degree
or above. The higher percentage of human capital implies a higher level of productivity and a higher demand of housing. The data is derived from the 6th population census in 2010 by the Local Bureau of Statistics.
Pollution: The variable measures the annual sulphur dioxide discharge which indicates
the pollution level of the cities. It is supposed to have a negative effect on the housing prices. The data is calculated by the total sulphur dioxide discharge divided by the con-struction space of the city according to the Statistics Yearbook of Chinese Cities 2011.
Investment: The variable is the percentage of completions of residential housing
in-vestment of the total inin-vestment of the city. It is the flow variable which measures the value of new residential housing put in place each year, which includes the construction and equipment costs and the government regulations. It indicates the supply of the hous-ing at a certain point in time. Since land is non-reproducible, it is a stock variable and not included in this item. The data is from the Statistics Yearbook of Chinese Cities 2011.
East: This represents a dummy variable as a geographic factor and indicates whether
the city is located in the eastern or mid-western region. Due to the policies that emphas-ize the development of the eastern area, the regional development difference is remark-able in China. The housing prices are averagely higher in the eastern area than in the mid-western area. In this variable eastern cites are defined to be one and mid-western cites are zero.
Super: This is a dummy variable for the superstar cities, where housing prices appre-ciate far more than the national average due to population and income growth and the scarcity of land (Gyourko et al., 2006). As indicated by figure 2.4, Shenzhen, Shanghai, Beijing, Hangzhou, and Sanya have more than twice as high as the average housing prices. Superstar cities are defined to be one and others are zero.
6 Methodology
Based on the housing price function (Equation 3.7) and a series of econometric tech-niques, I conduct the hypothesis and examine the effects of population growth on hous-ing prices, alongside wages, manufacturhous-ing employment, human capital, pollution, and housing investment plus two regional factors east and super. In order to avoide the mul-ticollinearity issue, three multivariate ordinary least-squares (OLS) regression equations are employed to examine all the variables. In the OLS regression, the variables such as housing prices, wages, pollution are in logged form, but others measured by percentage in a normal form. Using logged form is to specify a linear relationship among the va-riables, which can give an approximate description of some economic behaviour. For example, the parameters of the log-log model have an interpretation as elasticity (Guja-rati, 2004).
Ln(Pi)= + POPGRi+ MANUi+ HUCAi+ INVESTi + EAST+ SUPER+ (6.3)
Where, Pi are housing prices in city i; POPGRi is population growth in city I;
WA-GESi is the annual income per worker in city i; HUCAi is the percentage of people
with a college degree or above in city i; MANUi is the share of manufacturing
em-ployment in city i; POLUi is the sulphur dioxide discharge in city i, and INVESTi is
the percentage of completions of residential housing investment of the total invest-ment in city i.
7 Findings
7.1 Scatter-plots analysis
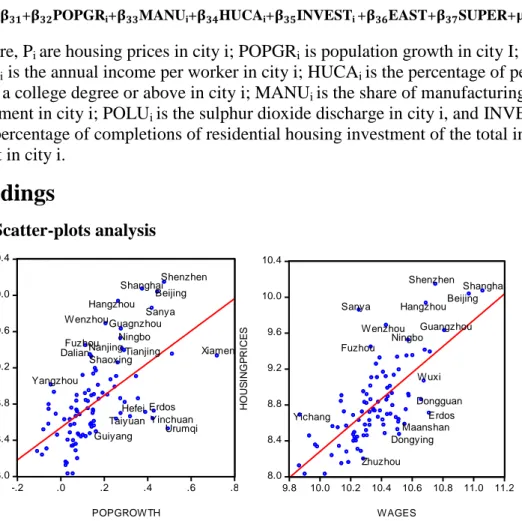
Figure 7.1: Scatter-plots of housing prices in relation to the population growth and wages.
Figure 7.1 provides the scatter-graphs for housing prices with population growth and wages, which explain more details for the regional factors: the cities are located in east or mid-west and superstar cities. Not surprisingly, the data fit quite well on the line except for some outliers.
In the scatter-graph of population growth and housing prices, the cities that outlie on the top of the regression line are all located in the eastern area but the cities under the regression line are all located in the mid-western area except for Xiamen. The distri-bution of those cites depicts that the eastern area, on the average, has higher housing price appreciation than the mid-western area when the population growth rate is simi-lar. However, the cites, Urumqi, Yinchuan, Hefei, Taiyuan and Guiyang, share the common characteristic of a higher population growth because they are provincial cap-ital cites but the housing prices are lower due to their location are in the mid-western area. The phenomenon can be explained by the regional development difference be-tween eastern and mid-western cities.
As indicated on the scatter-graph of wages and housing prices, the outliners up and down the regression line are all eastern cities except for Yichang and Erdos, which leads to the conclusion that eastern cities have considerably higher wages than west-ern cities. The cities, Dongguan, Maanshan, Dongying, have similar features as they all have lower housing prices because they are prefecture-level cities but high wages level because they are located in the eastern area. The cities above the regression line
8.0 8.4 8.8 9.2 9.6 10.0 10.4 -.2 .0 .2 .4 .6 .8 POPGROWTH H O U S IN G P R IC E S Shenzhen Beijing Shanghai Sanya Hangzhou WenzhouGuagnzhou Ningbo Xiamen Urumqi Yinchuan Erdos Taiyuan Hefei Fuzhou Dalian Shaoxing Nanjing Tianjing Yangzhou Guiyang 8.0 8.4 8.8 9.2 9.6 10.0 10.4 9.8 10.0 10.2 10.4 10.6 10.8 11.0 11.2 WAGES H O U S IN G P R IC E S Sanya Wenzhou Shenzhen HangzhouBeijing Shanghai Fuzhou Ningbo Guangzhou Erdos Dongguan Wuxi Dongying Maanshan Yichang Zhuzhou
show that their housing prices are considerably higher than the one with comparable level of wages. Not surprising, those cities also lie on the top of population growth and the housing prices regression line. Combining the two phenomena of housing prices with population growth and wages, we can draw the same conclusion as Gla-seser, Gyourko, and Saks (2006) that as an area becomes more productive, population, wages and housing prices all increase. Therefore, the cities located in the eastern area are averagely more productive than the ones in mid-west, so that the higher housing prices in east facilitated by the higher level of population growth and wages.
The superstar cities Shenzhen, Shanghai, Beijing, Hangzhou and Sanya, where hous-ing prices are twice more as high as the national average, are exactly located on the top of both regression lines, but there are some differences among them. The first four cities are the productivity cites where the exorbitant housing prices are due to housing demand shock fueled by the same magnitude of population growth and wag-es. Sanya, on the other hand, as a famous tourist city is an attractive place where housing prices and population are high but wages are relatively low.
7.2 Correlation coefficients analysis
Table 7.1 Correlation matrix for the key variables
Correlations
Housing prices Manufacturing Wages Population growth Investment Human capital Pollution Housing prices 1 Manufacturing .726** 1 Wages .702** .581** 1 Population growth .589** .430** .542** 1 Investment .503** .216* .349** .577** 1 Human capital .504** .441** .605** .443** .346** 1 Pollution -.429** -.172 -.200 -.413** -.578** -.408** 1 **. Correlation is significant at the 0.01 level (2-tailed).
*. Correlation is significant at the 0.05 level (2-tailed).
Table 7.1 provides a correlation matrix for all key variables and all the variables show a substantial significant correlation with housing prices. The highest correlation coefficient is between manufacturing and housing prices (0.726). The second best correlation coefficient is wages and housing prices (0.702), which is larger than that of population growth and housing prices (0.589). Furthermore the correlation of hu-man capital and housing prices (0.504) is about the same as investment and housing prices (0.503). The correlation of pollution and housing prices is negative (-0.429). In addition, some key variables themselves are highly correlated such as wages and hu-man capital (0.605), wages and hu-manufacturing (0.581), investment and pollution (0.578), and pollution and human capital (0.408), therefore I avoid those combina-tions when I run the regression model.
7.3 OLS results
I ran OLS regression models to examine the effects of population growth on housing prices. And other explanatory variables included in the models are wages, manufac-turing employment, human capital, pollution, and housing investment plus two re-gional factors east and superstar cities. In order to avoid the multicollinearity issue,
amine all the variables. All variables are in logged form, except those measured per-centage.
Table 7.2 OLS regression results
Equation(6.1) VIF Equation(6.2) VIF Equation(6.3) VIF
C 1.139(0.508) 8.741***(0.000) 8.076***(0.000) Population growth 0.622***(0.004) 1.513 0.743***(0.000) 1.448 0.499**(0.027) 1.829 Manufacturing 0.799***(0.000) 1.594 0.691***(0.000) Human Capital 1.198**(0.048) 1.923 1.391***(0.009) 1.657 Wages 0.699***(0.000) 2.059 Investment 1.177**(0.034) 1.734 Pollution -0.064*(0.021) 1.372 East 0.240***(0.000) 1.215 0.155***(0.007) 1.062 0.203***(0.001) 1.264 Super 0.631***(0.000) 1.308 0.405***(0.007) 1.633 0.393***(0.006) 1.587 R2 0.709 0.716 0.739 R2 adjusted 0.692 0.699 0.722 n 95 95 95 Significant level: *0.1, **0.05 ***0.01
Table 7.2 shows the regression results and all equations are highly significant. The value of R2 indicates how many per cent of the variation in housing prices is ex-plained by all variables of the respective equation. All the values of R2 in the three equations are above 0.7, which demonstrate that the housing prices are explained by at least 70 per cent of all the respective variables. The value of the variance-inflating factor (VIF)4 is a range from 1.215 to 2.059 for all the variables in the three equations. It indicates that there are no multicollinearity problems in those models.
Population growth, a proxy for urbanization process, is positive and highly significant related to housing prices when employed in all three equations. The coefficient of it is significant at 0.01 level with 0.622 and 0.743 for the first two equations, and the third coefficient is significant at 0.05 level with 0.499. The results confirm the hypothesis that population is the determinant for the housing prices.
As the pillar industry in China, manufacturing is a good indicator of economic growth and the main channel for the urban employment. The results show that manu-facturing employment is positive and highly significant explanatory for the housing prices when it was tested by equation 6.2 and 6.3. The coefficients are 0.799 and 0.691 at the 0.01 significant level.
The highest coefficient among all variables in the three equations is human capital, which gives a positive and highly significant interpretation to housing prices. Human
4 VIF shows how the variance of an estimator is inflated by the presence of multicollinearity. If VIF <10,
capital is an important determinant of the growth of cities by increasing the produc-tivity of the local markets and the demand of housing.
Wages, a proxy for urban productivity, is highly significant as well. Urban productiv-ity is the one of the main determinants of the urban growth. It is positive affecting the housing prices. The log-log model endows an elasticity interpretation to the coeffi-cient 0.699 at 0.01 significant level. When the wage increase by 1 per cent, housing prices will increase by 0.699 per cent.
Housing investment as a proxy for both construction costs and government regula-tions explains the housing supply. It is positive and highly significant as well. Theo-retically, the housing supply should have a negative relationship to housing prices. In China, the positive phenomenon can be interpreted by the demand shock that the housing demand overpasses the housing supply.
It is predictable that pollution affects the housing prices negatively. The coefficient is -0.064 and significant at 0.05 level. When the pollution increases by 1 per cent the housing prices will decrease by 0.064 per cent.
In addition, the coefficients of dummy variables east and super emphasized the re-sults in scatter plots analysis. The housing prices in the eastern region are averagely higher than that in the mid-western region, and the superstar cities, Shenzhen, Shang-hai, Beijing, Hangzhou and Sanya, demonstrate an exorbitant level of housing prices. Overall, my findings are remarkably consistent with the entire theoretical framework and confirm the hypothesis that the variance of urban housing prices in China can be credibly explained by population growth, wages, manufacturing employment, human capital, pollution, and housing investment. The analysis also finds that cities located in the eastern area have averagely a higher productivity than the ones located in the mid-west, and the higher housing prices in the eastern area are caused by the higher level of population growth and wages. To interpret the exorbitant housing prices in the superstar cities, we should consider if the city is a productive one or an attractive one. For the former, the super high housing prices are aroused by a demand shock fueled by the same magnitude of population growth and wages. In an attractive city, the exorbitant housing prices are in line with the higher population growth but wages are relatively low.
8 Conclusion
My study has examined the effects of population growth, wages, manufacturing em-ployment, human capital, pollution, and housing investment on housing prices across the urban area in China. Based on the housing supply and demand theory, I constructed a housing prices function: Pi =P(Pi, POPGRi, WAGESi, MANUi, HUCAi, POLUi,
INVESTi). To study this, I conducted the hypothesis using the cross section data of 95
cities in 2010. I ran three multiple regression models and conducted a scatter-plot analy-sis, a correlation analyanaly-sis, and OLS results analysis.
Overall, the findings are remarkably consistent with the entire theoretical framework and confirmed the hypothesis. Specifically, the analysis shows that population growth, a proxy for the urbanization process, plays a key role for explaining the urban housing prices in China. This is in line with the previous studies of Case and Mayer (1996), Ca-pozza et al., (2002) and Glaseser et al., (2005 and 2006). The econometric analysis also found that wages, manufacturing employment, human capital and housing investment are positive explanations of housing prices, while pollution has a negative relationship with housing prices. Furthermore, the findings share the same conclusion as Glaseser, Gyourko, and Saks (2006) that the difference of housing prices in the eastern and mid-western region can be interpreted by the region’s productivity. If an area becomes more productive, population, wages and housing prices all increase. The same explanation can be applied for the superstar cities, but with a higher magnitude. The housing prices in productive superstar cities appreciate far more than the national average due to the impressive population and income growth that lead to a housing demand shock and an inelastic housing supply. In an attractive superstar city, the exorbitant housing prices are in line with the same level of population growth but wages are relatively low.
Due to the limitation of the data, I could not access the land prices data to analyze more influence on the supply side. Meanwhile the cross section data could not give the out-look for the long term trend analysis, but for the purpose of the thesis it is good enough. For the future study I would suggest to combine both cross section data and time series data to analyze the housing prices in China.
In the end, I would suggest that the Chinese government should narrow the gap of eco-nomic development between the eastern and mid-western region by encouraging the FDI to central and western regions. It will increase that area’s productivity and attract the on-going rural-urban migration, which would then contract the serious housing pric-es variance in China.
List of references
Alonso, W.(1964). Location and land use. Cambridge, MA: Harvard University Press. Berry, C. R. and Glaeser, E. L.(2005). The Divergence of Human Capital Levels Across
Cities. Working Paper, No. 11617.
Cai, F., Wang, D. and Du, Y.(2002). Regional disparity and economic growth in China.
China Economic Review, 13.197–212.
Cappozza, D. R., Hendershott, P. H., Mack, C. and Mayer, C. J.(2002). Determinants of Real House Price Dynamics. Working Paper, No. 9262.
Case, K. and Mayer C.(1996). Housing price dynamics within a metropolitan area.
Re-gional Science and Urban Economics, 26, 387-407.
Chan, K. and Buckingham, W.(2008). Is China Abolishing the Hukou System? The
China Quarterly, 195, pp 582-606 doi:10.1017/S0305741008000787.
Chen, X.(1991). China’s city hierarchy, urban policy and spatial development in the 1980s. Urban Studies 28, 3: 341-68.
Chinitz, B.(1962). Contrasts in agglomeration: New York and Pittsburgh, American
Economic Review, Papers and Proceedings 52, 279-289.
Crecine, J., Davis, O. and Jackson, J.(1967). Urban Property Markets: Some Empirical Results and Their Implications for Municipal Zoning. Journal of Law and
Eco-nomics, Vol. 10, pp. 79-99.
Dipasquale, D. and Wheaton, W.(1996). Urban economics and real estate markets. Prentice Hall, Englewood Cliffs, NJ 07632.
Florida, R.(2002). The economic geography of talent. Annals of the Association of
American Geographers, 92: 743–755.
Florida, R. and Mellander, C.(2009). There goes the metro: how and why bohemians, artists and gays affect regional housing values. Journal of Economic Geography, 10 pp. 167–188.
Florida R., Mellander C. and Rentfrow, P.(2011). The Happiness of Cities. Regional
Studies, pp. 1-15.
Follain, J.(1979). The Price Elasticity of the Long Run Supply of New Housing Con-struction. Land Economics, 55:190-99.
Fu, Y., Zheng, and S., Liu, H.(2008). Population Growth across Chinese Cities:Demand Shocks, Housing Supply Elasticity and Supply. ShiftsAvailable at SSRN:
http://ssrn.com/abstract=1153022 or http://dx.doi.org/10.2139/ssrn.1153022. Glaeser, E.L., Scheinkman, J.A. and Shleifer, A.(1995). Economic growth in a
cross-section of cities. Journal of Monetary Economics, 36(1): 117-143.
Glaeser, E. L., Kolko, J.and Saiz, A. (2001). Consumer city. Journal of Economic
Glaeser, E. L. and Saiz, A. (2003). The rise of the skilled city. Papers on Urban Affairs, 5: 47–94.
Glaeser, E. L., Gyourko, J. and Saks, R.(2005). Why have housing prices gone up?
American Economic Review Papers and Proceedings, 95: 329–333.
Glaeser, E. L., Gyourko, J. and Saks, R.(2006). Urban growth and housing supply.
Journal of Economic Geography, 6: 71–89.
Gujarati, D. N.( 2004). Basic Econometrics (Fourth Edition). New York:The McGraw−Hill Companies.
Gyourko, J., Mayer, C. and Sinai, T.(2006) Superstar Cities, NBER Working Paper No. 12355.
Hort, K.(1998). The determinants of urban house price fluctuations in Sweden 1968-1994. Journal of Housing Economics, 7:93-120.
Hendershott, P., and Abraham, J.(1996). Bubbles in Metropolitan Housing Markets.
Journal of Housing Research 7: 191–207.
Jacobs, J.(1969). The economy of cities. Vintage, New York, NY.
Lucas, R.(1988). On the mechanics of economic development. Journal of Monetary
Economics, 22: 3–42.
Ma, L.(2001). Urban transformation in China, 1949-2000: A review and research agen-da. Environmental and Planning A 33:1545-69.
Malpezzi, S.(1996). Housing prices, externalities and regulation in the U.S. metropoli-tan areas,” Journal of Housing Research, 7(2): 209-241.
Muth, R.(1969). Cities and housing. Chicago: University of Chicago Press.
Quigley, J. M.(2002). Real Estate Prices and Economic Cycles. Working Papers, Berke-ley Program on Housing and Urban Policy, Institute of Business and Economic
Re-search, UC Berkeley. W99-009.
Roback, J.(1982). Wages, rents, and the quality of life. Journal of Political Economy, 90:1257-1278.
Saks, R. E.(2008). Job creation and housing construction: constraints on metropolitan area employment growth. Journal of Urban Economics, 64 (2008) 178–195. Shapiro, J. M.(2006). Smart cities: Quality of life, productivity, and the growth effects
of human capital. The Review of Economics and Statistics, 88: 324–335. Smith, B.(1976). The Supply of Urban Housing. Quarterly Journal of Economics,
90(3):389-405.
Wang, Y.(1996). Urban Housing Reform and Finance in China : A Case Study of Bei-jing. Urban Affairs Review. 1996 31: 625.
Wu, J., Gyourko, J., and Deng Y.(2010). Evaluating conditions in major Chinese hous-ing markets. Regional Science and Urban Economics, REGEC-02814; Pages 13.
Yu, H.(2010). China’s house price: Affected by economic fundamentals or real estate policy? Frontiers of Economics in China,5,25-51.
Zhang, K. H. and Song, S.(2003). Rural–urban migration and urbanization in China: Evidence from time-series and cross-section analyses. China Economic Review, 14(2003) 386-400.
Zhang, Q.(1997). Urban land reform in China. Land Use Policy, Vol. 14, No. 3, pp. 187-199.
Zheng, S., Kahn, M. and Liu, H.(2010). Towards a system of open cities in China: Home prices, FDI Flows and air quality in 35 major cities. Regional Science and
Urban Economics, Volume 40, Issue 1, Pages 1-10, ISSN 0166-0462.
Zhong, Y. and Hays, R.(1996). The Transformation of the Urban Housing System in China. Urban Affairs Review. 2001 36: 620.
Appendix
Figure appendix 1: Map of 35 major cities in China. Source: (Wu et al., 2010)