Finding patterns in biochemical reaction networks
Computational models in biology encode molecular and cell biological processes. Many of them can be
represented as biochemical reaction networks. Studying such networks, one is often interested in
systems that share similar reactions and mechanisms. Typical goals are to understand the parts of a
model, to identify reoccurring patterns, and to find biologically relevant motifs. The large number of
models are available for such a search, but also the large size of models require automated
methods.Specifically the generic problem of finding patterns in large networks is computationally hard.
As a consequence, only partial solutions for a structural analysis of models exist.
Here we introduce a tool chain that identifies reoccurring patterns in biochemical reaction networks. We
started this work with an evaluation of algorithms for the identification of frequent subgraphs. Then, we
created graph representations of existing SBML models and ran the most suitable algorithm on the data.
The result was a list of reaction patterns together with statistics about the occurrence of each pattern in
the data set. The approach was validated with 575 SBML models from the curated branch of BioModels.
We analysed how the resulting patterns confirm with expectations from the literature and from previous
model statistics. In the future, the identified patterns can serve as a tool to measure the similarity of
models.
Finding Patterns in Biochemical Reaction Networks
Ron Henkel
1,
2, Fabienne Lambusch
3, Olaf Wolkenhauer
3, Kurt Sandkuhl
2, Christian Rosenke and
Dagmar Waltemath
31Scientific Databases and Visualization, Heidelberg Institute for Theoretical Studies, Heidelberg, Germany 2Business Information Systems, University of Rostock, Rostock, Germany
3Systems Biology and Bioinformatics, University of Rostock, Rostock, Germany
4Visual Computing and Computer Graphics, University of Rostock, Rostock, Germany
1Systems Biology and Bioinformatics, University of Rostock, Rostock, Germany
{ron.henkel, dagmar.waltemath}@uni-rostock.de
Keywords: Systems Biology, Subgraph Mining, Knowledge Discovery, Graph Database, Biochemical Reaction
Net-works, Pattern Detection
Abstract: Computational models in biology encode molecular and cell biological processes. Many of them can be
represented as biochemical reaction networks. Studying such networks, one is often interested in systems that share similar reactions and mechanisms. Typical goals are to understand the parts of a model, to identify reoccurring patterns, and to find biologically relevant motifs. The large number of models are available for such a search, but also the large size of models require automated methods. Specifically the generic problem of finding patterns in large networks is computationally hard. As a consequence, only partial solutions for a structural analysis of models exist. Here we introduce a tool chain that identifies reoccurring patterns in biochemical reaction networks. We started this work with an evaluation of algorithms for the identification of frequent subgraphs. Then, we created graph representations of existing SBML models and ran the most suitable algorithm on the data. The result was a list of reaction patterns together with statistics about the occurrence of each pattern in the data set. The approach was validated with 575 SBML models from the curated branch of BioModels. We analysed how the resulting patterns confirm with expectations from the literature and from previous model statistics. In the future, the identified patterns can serve as a tool to measure the similarity of models.
1
Introduction
Modeling is an integral part of computational bi-ology (Finkelstein et al., 2004). Its increasing impact is reflected in the rapidly growing number and com-plexity of computational models (Henkel et al., 2010; Chelliah et al., 2014). Furthermore, a large variety of software tools are available for simulation, anal-ysis, visualization, or comparison of models (Hucka et al., 2011; Waltemath et al., 2016). Research projects such as the Virtual Physiological Human (http://www.vph-noe.eu/) require techniques for
Availability: https://sems.uni-rostock.de/
Supplementary information:
https://sems.uni-rostock.de/projects/ masymos/model feature extraction/
model coupling, merging, and combination at differ-ent scales. Further computational support is needed for model curation, i. e., for validation and seman-tic annotation of models (Chelliah et al., 2014). As models evolve over time, management strategies must be implemented to ensure model exchangeability, sta-bility and result validity; and to foster communica-tion between project partners (Bechhofer et al., 2013; Waltemath et al., 2013; Waltemath, 2015; Henkel et al., 2015).
In the field of systems biology, models are pub-lished in open repositories such as BioModels (Li et al., 2010), the CellML model repository (Yu et al., 2011), or JWS Online (Olivier and Snoep, 2004). These repositories provide access to curated and reusable models in standard format. Release 29 of BioModels, for example, contains 575 curated SBML models. These models encode biological processes that range from cell cycle processes to apoptosis
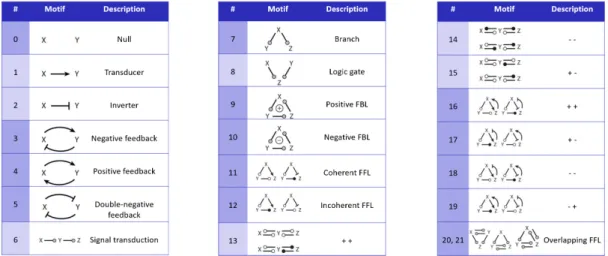
Figure 1: Functional motifs postulated by Tyson and Nov´ak (2010): A gray circle in a motif indicates an interac-tion that may be either + or -. All white circles in a motif must have the same sign, either + or -, and they must be of opposite sign to any black circle in the same motif. We grouped this motifs by structure. For example, motifs 3-5 are grouped as they are all circles of two species and two reactions. An analogous group is built by motifs 9-12. The groups are depicted by alternating colors.
to mitogen-activated protein kinase and many more (Juty et al., 2015). Two data formats to represent models are the Systems Biology Markup Language (SBML) (Hucka et al., 2010) and CellML (Lloyd et al., 2004). Both encode the mathematics, net-work structure and dynamic behavior of models. In addition, semantic annotations to bio-ontologies en-hance the description of the encoded biology (Cour-tot et al., 2011), and simulation descriptions formalize the process of analyzing the model (Waltemath et al., 2011). Recently, the OMEX format was released as a standard to bundle all model-related files in a sin-gle archive (Bergmann et al., 2014). As all published models follow the same, so-called COMBINE stan-dards, model analysis tasks can be performed with interoperable tools. It is, for example, interesting to study models regarding function, structure and behav-ior (Kn¨upfer et al., 2013); regarding their temporal evolution (Scharm et al., 2015, 2016); or regarding their dynamics (Cooper et al., 2016). To character-ize models by their function, Tyson and Nov´ak (2010) postulate common motifs in biochemical reaction net-works. They define a motif as “simple pattern of acti-vation and inhibition among a small number of inter-acting molecular species” (Tyson and Nov´ak, 2010). Figure 1 shows their suggested grouping of motifs. It remains an open question how and how frequently these motifs are encoded in a model’s biochemical re-action network. One prerequisite to using statistics on motis, and ultimately to conforming the postulations in the paper, is a suitable computational method for pattern discovery.
In this manuscript we first describe the nature and
structure of our data set. We then evaluate general techniques for pattern discovery in SBML models with respect to the algorithms’ applicability in this do-main. Finally, we show that subgraph mining is a suit-able method for pattern discovery. We conclude with examples of patterns found in Cell Cycle models from BioModels, we explain the revealed patterns, and we hypothesize how Tyson’s motifs might be encoded in the models.
2
Motivation
Many of today’s models reassemble large bio-chemical reaction networks. These models are semi-automatically generated using data driven ap-proaches, for example, to construct models from metabolic networks (Stanford et al., 2013; Small-bone et al., 2013). Models are also developed to prove a theory or mathematical concept, for example to mathematically describe interactions between bio-logical entities (Tyson, 1991) or generic oscillatory networks of transcriptional regulators (Elowitz and Leibler, 2000). The following questions may arise in any of the procedures of generating a model:
• Which structures are frequently used to represent biochemical processes?
• Does the network contain circles and how many? • Can we find unique patterns for certain types of
models (i.e. models derived from wet lab data or theoretical models encoding a postulated network to show a certain behavior)?
• Do models from different biological domains (e .g. cell cycle, apoptosis, transport, metabolism) share patterns?
• Can we find patterns that are structured like the motifs postulated by Tyson and Nov´ak (2010)? Do they occur rather frequently or occasionally? The ability to retrieve such information in an auto-mated manner enables new kinds of analysis. Current network analysis mostly focuses on network diame-ter and network efficiency (Zhang and Zhang, 2009), on the topological and dynamical properties that con-trol the behavior of the network (Barabasi and Oltvai, 2004), or on the degree of tolerance against errors in scale-free networks (Albert et al., 2000). While these approaches provide key figure values for the network topology, they do not detect actual patterns. These substructures in networks are, however, necessary for modelers to determine reoccurring parts in models, or to characterize typical sub-modules. This knowl-edge can help to identify biological phenomena, for example, in model comparison tasks. We hypothesize that patterns can furthermore provide information on the modeling technique (theoretical, data driven, or hybrid). Another application is the clustering of a model set with regard to occurrences of certain pat-terns. Here, current approaches incorporate semantic annotation and meta-information (Schulz et al., 2011; Alm et al., 2014). In the future, structural information may be used to improve the clustering. Ultimately it will be possible to calculate a similarity coefficient for models purely based on their network structure. Com-bined with already existing similarity measures based on semantic annotations (Henkel et al., 2010; Schulz et al., 2011) this will have an impact on the reuse and reproducibility of scientific modeling results (Bech-hofer et al., 2013; Waltemath et al., 2013; Henkel et al., 2015). The combination of semantic similar-ity and structural approaches with further improve the search for models that share similar structures, im-prove the mapping of similar models onto each other (Rosenke and Waltemath, 2014), and lead to recom-mender systems that support the modeling process.
However, to achieve the aforementioned benefits, it is essential to first identify the patterns used in bio-chemical reaction network models. Therefore, the network structure has to be regarded as a whole, rather than to treat it as a set of nodes and edges. Lakshmi and Meyyappan (2012) state that the simple pairwise comparison of nodes and edges within a network ne-glects its structure. They therefore suggest to re-spect the composition of network elements by view-ing graphs as similar, if they share many common substructures. In other words, the problem of detect-ing structural similarities within the models is a
fre-quent subgraph mining (FSM) task (Kuramochi and Karypis, 2001).
3
State of the art
Data mining - the extraction of implicit, non-obvious information from huge data sets - is of great interest in many scientific fields (Chen et al., 1996). Frequent subgraph mining (FSM) is a research area of data mining, which focuses on frequent patterns in graph structures (Lakshmi and Meyyappan, 2012). The method has its roots in the early 90’s, when it had been used to examine the customers’ buying behav-ior. Sales could be increased by detecting patterns in frequent combinations of bought products (Han et al., 2007). Other approaches for identifying pat-terns in graphs are based on set-similarity (Ramon and Bruynooghe, 2001), hypergraph analysis (Zass and Shashua, 2008) or require specific types of edges and vertices, e .g., the existence of taxonomic rela-tionships (Melnik et al., 2002; Chirita et al., 2005).
In this work we focus on graph based approaches only, because our models are represented by reaction networks. Graph based approaches for data mining are of ever-increasing interest. Graphs are a natu-ral representation for complex semi-structured data and relations between the data (Washio and Motoda, 2003). They are, among others, used to model social networks, XML documents or chemical compounds. Given a set of graphs, frequent subgraph mining is the problem to find those subgraphs within the graphs that pass a given frequency threshold (Keyvanpour and Azizani, 2012). To decide whether a graph is embed-ded in another, FSM algorithms require subgraph iso-morphism testing (Lakshmi and Meyyappan, 2012). This is known as an NP-complete task (Keyvanpour and Azizani, 2012). Thus, FSM techniques rely on prior knowledge, heuristics and further domain-dependent strategies to improve the performance. A variety of FSM algorithms are already implemented (Kuramochi and Karypis, 2001). It should be noted that most FSM algorithms are domain-specific. For example, an FSM algorithm exists specifically for molecular databases with structures of atoms and bonds (Borgelt and Berthold, 2002).
When choosing an appropriate algorithm for a problem, the characteristic aspects of the methods thus need to be evaluated. A main criteria is the type of input graph. Some algorithms take one large graph and find frequent subgraphs depending on the frequency within this graph. Other algorithms take a graph set as input and search for structures that occur in at least a certain number of graphs within the set.
Further distinguishing criteria include: the necessity of prior background knowledge, the need for exact or just approximate results as well as for completeness of the resulting pattern set, the available memory, and the possibility of user intervention (Keyvanpour and Azizani, 2012).
FSM techniques have already been used in the do-main of biology. The Kyoto Encyclopedia of Genes and Genomes (KEGG (Kanehisa et al., 2004)), for ex-ample, is a pathway database that determines struc-tural similarities of network components. Koyut¨urk et al.(2004) search for frequent subgraphs within a set of metabolic pathways in the KEGG database, where the pathways are represented as directed graphs. The search discovers common patterns of related enzyme interactions. In this application, the computational costs are reduced by exploiting the sparse nature of metabolic pathways and the unique node labeling. The authors state that their approach is also applicable to various other biological networks with minor modifications. In a similar work, Hat-tori et al. (2003) describe an algorithm to compare chemical structures of compounds. The chemical structure is seen as a graph of atoms represented by nodes and connected by covalent bonds as edges. The developed algorithm identifies and clusters mostly metabolic compounds. Finally, Wong et al. (2011) find frequent occurring patterns within biological net-works and investigate correlations between the func-tional behavior of such patterns with their structural topology. The authors present several existing algo-rithms for this purpose. The algoalgo-rithms are evaluated by experimental results, classified according to sev-eral characteristics, and their advantages and disad-vantages are discussed.
4
Data set
For our analysis, we incorporated all publicly available models from BioModels. The stored reac-tion networks are encoded in SBML. BioModels con-tains two types of models: curated and non-curated. We here choose only models from the curated branch as those models are ensured to accurately represent the approach described in the reference publication. Furthermore, curated models are syntactically and semantically validated and annotated with ontology terms according to the MIRIAM standard (Novere et al., 2005). Specifically, we analyze SBML models from two different releases of BioModels. Release 1 (in the following referred to as R1) is the first release of the repository. It contains 30 curated models. Re-lease 29 (in the following referred to as R29) is the
Figure 2: Distribution of species among models, how many models contain a certain number of species. Species are displayed on the x-axis and models on the y-axis, respectively. This figure is based on R29.
latest release to date. It contains 575 curated models. We chose these two releases to represent the temporal evolution of BioModels.
SBML encodes biochemical reaction networks us-ing species and reactions. A species participates in a reaction either as a modifier, product or reactant. As we apply an FSM algorithm for the subgraph analy-sis, we translate the biological reaction network into a graph representation using the MaSyMoS database (Henkel et al., 2015). The MaSyMoS graph struc-ture distinguishes two types of nodes (i. e.,labeled species and reaction) and three types of edges (la-beled is reactant, has product, and is modifier).
We designed a multi-step workflow (see Methods for details) to retrieve the patterns and their frequen-cies per model set. First, we performed a key figure analysis to calculate the quantities of node types and edges in the networks (Figures 2 and 3). In our data set, 557 out of 575 models in R29 contain species def-initions, and 499 models contain reactions. The re-maining models only define species and rules, but do not form a network. The data set contains a total of 18852 reaction nodes and 16843 species nodes. Fig-ure 2 shows the distribution of species across models in R29, and Figure 3 shows the distribution of reac-tions across models in the same data set. Data set R1 contains only 30 curated models (not displayed in the figure). These models contain a total of 736 reactions and 425 species. The big difference in numbers be-tween R1 and R29 are due to the rapid growth of mod-els, as previously reported (Henkel et al., 2010). We see that the majority of models contains less then 20 species and reactions. A noticeable accumulation of models can be found from three up to eleven species, while there are just a few models with more than 60 Species. For reactions, an accumulation of models that have three up to twelve reactions is stated. Fur-thermore, there are a few outliers with more than 100
Figure 3: Distribution of reactions among models, how many models contain a certain number of reac-tions. Reactions are displayed on the x-axis and mod-els on the y-axis, respectively. This figure is based on R29.
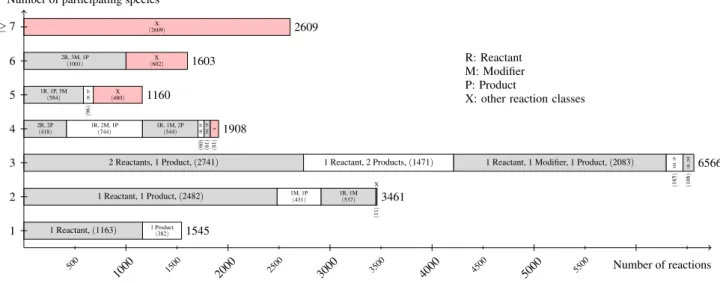
reactions and species. On average, a model has 30.2 species and 37.7 reactions. For R1 (results not dis-played) a model has 14.6 species and 25.4 reactions on average. Figure 4 shows the distribution of re-action classes among the models for data set R29. We define a reaction class as the combination of a number of species (reactants, products and modifier) and a reaction. As the figure states, most reactions have two or three participating species. The most fre-quently encoded reaction class is a reaction having two species as reactants and one species as product (see Figure 4). The second most frequently encoded class has one reaction with one species as reactant and one as product. Also notable are the reaction classes for seven and more participating species. We identi-fied 136 different reaction classes.
5
Methods
Frequent Subgraph Mining (FSM) techniques are capable of detecting structural similarities of net-works (Kuramochi and Karypis, 2001). We use an FSM algorithm to extract information about common reaction schemes in networks of biological models. When choosing an appropriate FSM algorithm for our use case, the characteristic aspects of available algorithms need to be evaluated and matched to our data. One important characteristic of FSM algorithms is how the candidate generation method works. It mainly builds on four approaches – join, extension, inductive logic programming and replacing. On the one hand, when generating candidates with join, the algorithm starts with small frequent substructures and then merges them into bigger structures. Also, fre-quent substructures can be joined. On the other hand, when generating candidates with join, the algorithm
starts with frequent nodes and iteratively adds one of each possible edges, while infrequent patterns of-ten are pruned immediately and will not be observed for further extension. By using inductive logic pro-gramming, first order predicates represent the sub-graphs. Keyvanpour and Azizani (2012) state that in the replacing strategy ”after detecting the frequent subgraph in each stage, the detected subgraph is re-placed by a node in the main graph and in the next stage, the mining process continues on a new graph obtained from graph replacing.”
For our application domain, we decided to use gSpan, which is an extension based algorithm (Yan and Han, 2002). GSpan takes a graph set, particu-larly the set of reaction networks, as its input. Subse-quently, it produces all frequent connected subgraphs according to a given frequency threshold. While other algorithms supply only approximate results, gSpan fulfills our requirement for exact results. Further-more, it combines candidate generation and frequency counting in one procedure. It thereby performs effi-cient pruning by using a unique minimum depth-first search code of the graphs and a lexicographic order-ing on these codes. GSpan thus builds a search tree. As it uses the minimum depth-first search code of graphs as a canonical label, two graphs are isomor-phic if and only if their code is identical. This fact transforms the task into a sequential pattern mining problem. It also avoids false positive pruning. Al-gorithms solving a sequential pattern mining problem are already at hand.
W¨orlein et al. (2005) evaluate and compare the performance of the subgraph miners MoFa, gSpan, FFSM and Gaston. For this purpose, W¨orlein et al. (2005) developed a tool called the “Par-allel and Sequential Mining Suite” (ParSeMiS). ParSeMiS is based on Java and implements algo-rithms such as gSpan, Gaston, and Dagma. In ad-dition, Priyadarshini and Mishra (2010) described a detailed approach to graph mining using the gSpan al-gorithm. The above mentioned advantages of gSpan, such as the use of a canonical labeling, offer the opportunity to analyze the biochemical reaction net-works described in the Data Set section.
For our analysis, we use the MaSyMoS graph database (Henkel et al., 2015) to store and access the networks in graph representation. The tool imports models from BioModels and converts each model into a graph representation. Inside MaSyMoS the en-coded reaction networks are preserved. We first im-port all SBML models from BioModels’ R1 and R29 into a MaSyMoS instance. Afterwards, we connect the database with the ParSeMiS tool. Finally, the gSpan algorithm is applied to retrieve common
sub-1 Reactant, (sub-1sub-163) 1 Product (382) 1545 1 Reactant, 1 Product, (2482) 1M, 1P (431) 1R, 1M (537) X (11 ) 3461
2 Reactants, 1 Product, (2741) 1 Reactant, 2 Products, (1471) 1 Reactant, 1 Modifier, 1 Product, (2083)
2M, 1P (165 ) 1R, 2M (106 ) 6566 2R, 2P (418) 1R, 2M, 1P (744) 1R, 1M, 2P (544) 1R, 3P (60 ) 3M, 1P (61 ) X (81 ) 1908 1R, 1P, 3M (584) 2R, 3P (96 ) X (480) 1160 2R, 3M, 1P (1001) X (602) 1603 X (2609) 2609 1 2 3 4 5 6 ≥ 7
Number of participating species
500 1500 2500 3500 4500 5500
1000 2000 3000 4000 5000 Number of reactions
R: Reactant M: Modifier P: Product
X: other reaction classes
Figure 4: Listing of the node degree for reaction nodes in the data set R29 of curated models in BioModels Database. For each number of species (from 1 to 6, and more then 6) participating in a reaction, the figure lists the number of reaction nodes identified with a particular combination of its species relations (reaction class). The figure sums up smaller reaction classes displayed by X. It becomes obvious that most reactions have two or three participating species.
graph patterns per model.
The following workflow illustrates the procedure to get an appropriate input file for ParSeMiS and the post-processing to create image files of the retrieved patterns. First, we query MaSyMoS to get the exist-ing reaction networks of all SBML models as json-file, for example by using the tool curl.1 Irrelevant data, such as the http adresses, are deleted from the resulting json-file by using the tools awk and sed. As ParSeMiS requests a dot-file as input, we convert the json-file into dot-format using a PHP script. The re-sult is one big graph with all nodes and edges that were contained in the json-file. Because the nodes from different models are unconnected, it is necessary to split the big graph into its unconnected subgraphs. This split is done using the tool ccomps. Afterwards, the file can be used as an input for ParSeMiS.2The output is a dot file, which contains all the patterns (subgraphs) fulfilling the given frequency threshold. One can add appearance properties to the found pat-terns by using the tool sed. Finally, csplit is used to split the file to several files containing one pattern
1curl -X POST -d ’{ "query":
"MATCH (r:SBML REACTION) −[h]− >
(s:SBML SPECIES) RETURN h", "params": {}}’ http://sems.uni-rostock.de: 7474/db/data/cypher -H "Content-Type:
application/json" > resultHttp.json
2java -jar ParSeMiS.jar
--graphFile=inputFile.dot --outputFile=outputFile.dot --minimumFrequency=60%
each. Using the dot tool, an image file for each pattern is created.
6
Results
The aim of this work is to find common patterns in biochemical reaction networks. Using the afore-mentioned combination of tools and methods, we an-alyzed data sets R1 and R29 on a cluster node (180GB RAM, 16 Intel(R) Xeon(R) CPU X5650 @ 2.67GHz). For each NP-complete task, memory and CPU are the limiting constrains. Consequently, we could only identify the subset of patterns that are shared by at least a certain number of models. For data set R29, we were able to identify 37 patterns in total, with 350 being the lowest number of models that share a pat-tern. Identified patterns contain between one and six entities (species or reactions). The quest to identify patterns shared by less then 350 models was not suc-cessful due to memory limitations of the cluster. For the much smaller data set R1, however, we identified 190 pattern, containing between one and eleven en-tities. Here we were able to identify patterns shared by 20 of 30 models before limitations in memory pre-vented further calculations.
We observe that larger patterns are often com-posed of more common smaller ones. An example is the pattern shown in Figure 6, which is contained twice in Figure 11. In addition, the pattern shown in Figure 10 contains the pattern shown in Figure 7.
An-Figure 6: The smallest bi-ologically meaningful cir-cle (2 species and 2 re-actions). It is contained in 330 models of data set R29 and in 25 models of data set R1.
Figure 7: The displayed pattern was found in 436 models of data set R29 and 28 models of data set R1. It shows a species that takes a role as a reac-tant in two reactions and as a product in one reac-tion.
Figure 8: The displayed pattern was found in 390 models of data set R29 and in 26 models of data set R1. It shows a species that takes a role as a re-actant in one reaction and as a product in two reac-tions.
Figure 9: This pattern oc-curred in 351 models of data set R29 and shows a species taking part in a re-action as a reactant and a modifier.
Figure 5: An example for successive pattern exten-sion. To the left, a small pattern with one reaction and two species. In the middle, an extension of the smaller pattern by one reaction connected to the top species. To the right, an extension by a reaction connected to the bottom species.
other observation is the successive extension of small patterns by an additional species or reaction. Figure 5 gives an example.
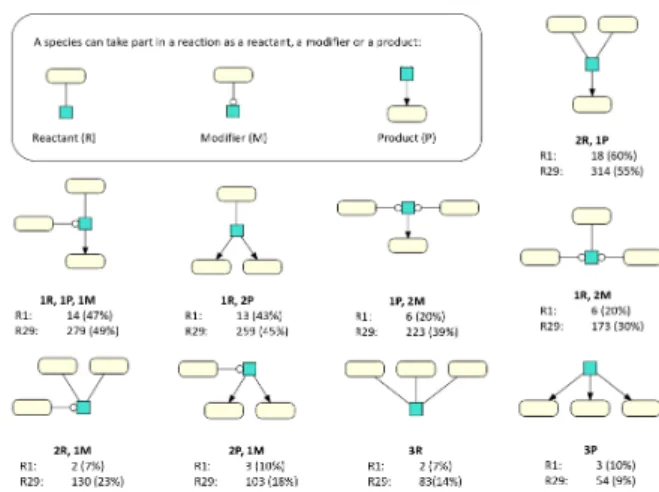
From the key figure analysis and the statistics shown in Figure 4, we expected to retrieve patterns having one reaction and three species (participating as product, reactant or modifier). Surprisingly, our queries found that no such patterns are shared by at least 350 models in R29 and by at least 20 models in R1, respectively. We then queried our data for all possible combinations of three species and one reac-tion directly. The results are shown in Figure 12. The specific combination of two reactants and one product only occurs in 314 models, despite being the most fre-quently encoded reaction class according to Figure 4. Same holds for all other possible reaction classes with three species for R29 and R1, respectively.
Another interesting point is the usage of species as a modifier. Generally, species in R29 most often take part in a reaction as a modifier (33209 times), and less so as a product (23630) or reactant (25595).
However, only four out of 37 retrieved patterns (R29) contain species that act as a modifier. One of those four patterns is shown in Figure 9. A further inves-tigation reveals the unequal distribution of modifiers among the models. Ten models together count for 20620 modifier usages. Among those models are five derivations of the aforementioned semi-automatically created models by Smallbone et al. (2013).
Figure 1 shows the network motifs that were pos-tulated by Tyson and Nov´ak (2010). These motifs contain circles and we expected to find similar pat-terns in our data set. Theoretically, a circle could be created with only one species and one reaction, if the species takes part as reactant and product. How-ever, from a biological perspective, there is no point in encoding such a construct. The next highest num-ber of entities necessary for creating a circle is four. Such a construct is biologically meaningful, for ex-ample, to encode the creation and degradation of a protein, or to encode direct positive or negative feed-back loops. Motifs 3-5 in Figure 1 can be encoded with two species and two reactions. Our algorithm retrieves a pattern to represent this circle (shown in Figure 6). It occurs in 26 models of R1. However, we do not see this pattern in any of the 37 retrieved pat-terns of R29. A subsequent query for the exact pattern reveals that it is indeed only contained in 342 models. Motifs 9-12 would be encoded by three species and three reactions. Even though patterns with up to 11 entities were identified (Figure 10), no other circles were retrieved.
Figure 10: A pattern with ten entities contain-ing two branches. This pattern is the largest pat-tern that is not a chain. It is included in 20 models of R1.
Figure 11: A pattern with seven entities containing two circles. This pattern is included in 21 models of R1.
Figure 12: We further investigate the distribution of reac-tion classes with 3 participating species per model (from R1 and R29). For each reaction class, the amount of models containing an reation class is given. In contrary to Figure 4 the reaction is not exclusive, i.e. more than 3 species can be part of a reaction but those are not dis-played.
7
CONCLUSION
The increasing amount of published models and the growing size of encoded reaction networks de-mand methods to analyze models. In this paper, we propose to add a new type of analysis to the exist-ing portfolio. We apply the gSpan algorithm to de-termine similar substructures in two data sets, R1 and R29, of BioModels. For R1, we retrieved 190 pat-terns (used in at least 20 of 30 models). For R29, we performed a key figure analysis first and then identi-fied the retrieved 37 patterns (used in at least 350 of 575 models). We then studied and interpreted com-pliances and differences between the findings of the key figure analysis and the detected patterns. We con-clude that a pure key figure analysis is not sufficient to characterize a set of biochemical reaction networks.
Obviously, we retrieved the expected patterns con-taining one, two or three entities (a single reaction, or a single species, or a combination of both). How-ever, already patterns with four entities did not match our expectations. According to our key figure analysis (Figures 2-4), one would expect to find patterns con-taining one reaction as a center node and three species taking roles as products, reactants or modifier. No such pattern was found to be encoded by at least 350 models. Instead, we retrieved patterns showing one species as a center node connected to three reactions (e. g. Figures 7 and 8). As it is feasible to manually list and search for all possible combinations of one reaction connected to three participating species, we
queried the database for those reaction classes. The results are shown in Figure 12. Surprisingly, the reac-tion classes that were identified as most common dur-ing the key figure analysis are only contained in less than 314 models. Instead, patterns mostly describ-ing chains, often containdescrib-ing a sdescrib-ingle branch, were re-trieved by our pattern finding algorithm. Examples are depicted in Figure 7 and Figure 8.
As aforementioned, we also expected patterns containing circles. However, we retrieved such pat-terns for R1 only. To investigate further, we subse-quently queried R29 and searched for the simplest circle (depicted in Figure 6). Surprisingly, the algo-rithm found more than 45,000 circles in R29. How-ever, two models by Stanford et al. (2013) (generated semi-automatically) count for 10,000 circles each. Together with our observations regarding the usage of species as modifiers in reactions, we assume that semi-automatically generated and data driven models are distinguishable by structure. One example are the models constructed from metabolic networks (Small-bone et al., 2013; Stanford et al., 2013).
We motivated this work with the Tyson motifs and already explained our findings regarding circles (see Results). As we currently do not consider the intended semantics of reactions and species (i. e., provided by annotations), we cannot distinguish be-tween certain motifs. For example, a pattern having a species as reactant, a reaction and a species as product could be corresponding to motif 1 or motif 2. Figure 13 shows examples of identified patterns that match
the motifs postulated by Tyson and Nov´ak (2010). For example, motif 6 represents a simple pattern for sig-nal transduction. It occurs in 27 of 30 models from R1 and in 406 of 575 models from R29. Interestingly, motifs 9-12, a circle with 6 entities, only occur in 11 models from R1 and in 195 models from R29, respec-tively. We did not find any patterns matching motifs 16-21. However, this is not surprising as those pat-terns are extended and derived from motifs 9-12. For motifs 13-15, we retrieved a matching pattern for R1, but none for R29.
Figure 13: Motifs as suggested by Tyson and Nov´ak (2010) and their visual representation in SBGN. Representations of feedback motifs are highlighted, please see also Figure 14.
A small example model is depicted in Figure 14. In addition, the patterns in Figure 13 provide the num-ber of occurrences (instances) of each postulated mo-tif (see again Figure 1) in R29. Most patterns in Fig-ure 14 are immediately recognizable for the human eye. However, sometimes the visual representation does not reassemble the models’ encoding, making it hard, or even impossible, to grasp submodules manu-ally (Tour´e et al., 2016). For example, in Figure 14, all entities displayed as ∅ (empty set) are encoded as the same entity. This explains why the cylin
produc-Figure 14: This is a visual representation of one Cell Cycle Model from BioModels (Tyson1991 CellCy-cle 6var (Tyson, 1991)). The Feedback Motifs (3-5) occur 3 times in this example model. In addition, we highlight all instances of these Feedback motifs in the Tyson model. Interestingly, the bio-synthesis and degradation also reassemble a feedback pattern because all ∅ (empty set) are, in fact, encoded as the same entity.
tion from ∅ and degradation into ∅ is detected as a feedback pattern. This also illustrates a shortcoming – we can only detect possible patterns but cannot rea-son if the detected pattern is of biological value for the model. Furthermore, the peculiarities of model encoding interfere with our pattern detection. For ex-ample, some SBML models contain species, but no reactions. We know that such models are solely en-coded using the SBML rule element, parameters and triggers. This results in a kind of implicit reaction net-work not processable with our approach. Also, hybrid models are available, where one part of the network is modeled with species and reactions and another part is modeled using rules. Consequently, there might be a lot more patterns which we are not able to retrieve yet.
In the future, we would like to be able to better distinguish the Tyson motifs. For example, we need to incorporate information about the role of a reac-tion (e. g. promoter or inhibitor). The Systems Biol-ogy OntolBiol-ogy (SBO) (Juty and Le Nov`ere, 2013) is an ontology representing mathematical concepts that are relevant for models. The use of annotations, specif-ically from SBO, will enable us to identify motifs more precisely. SBO provides terms for the func-tional role of a species or reaction. For example, a species that acts as a modifier can be annotated as ”the modifying function is an inhibition of the reac-tion” (SBO:0000407). Most species and reactions in our data sets contain such annotations. Their con-sideration will also lower the computational costs for the search for sub-models, because valuable semantic
knowledge can be incorporated to reduce the number of potential alignments.
Funding
RH received additional funding from the German Federal Ministry of Education and Research (BMBF) via grant number FKZ 031 A540A (de.NBI). FL and DW received funding from the German Federal Ministry of Education and Research (BMBF) as part of the e:Bio program, grant number FKZ 031 6194 (SEMS).
REFERENCES
Albert, R., Jeong, H., and Barab´asi, A.-L. (2000). Error and attack tolerance of complex networks. nature, 406(6794), 378–382.
Alm, R., Waltemath, D., Wolkenhauer, O., and Henkel, R. (2014). Annotation-Based Feature Extraction from Sets of SBML Models. In Data Integration in the Life Sciences, pages 81—-95. Springer. Barabasi, A.-L. and Oltvai, Z. N. (2004). Network biology: understanding
the cell’s functional organization. Nature reviews genetics, 5(2), 101– 113.
Bechhofer, S., Buchan, I., De Roure, D., Missier, P., Ainsworth, J., Bhagat, J., Couch, P., Cruickshank, D., Delderfield, M., Dunlop, I., et al. (2013). Why linked data is not enough for scientists. Future Generation Com-puter Systems, 29(2), 599–611.
Bergmann, F. T., Adams, R., Moodie, S., Cooper, J., Glont, M., Golebiewski, M., Hucka, M., Laibe, C., Miller, A. K., Nickerson, D. P., et al. (2014). Combine archive and omex format: one file to share all information to reproduce a modeling project. BMC bioinformatics, 15(1), 369. Borgelt, C. and Berthold, M. R. (2002). Mining molecular fragments:
Find-ing relevant substructures of molecules. In Data MinFind-ing, 2002. ICDM 2003. Proceedings. 2002 IEEE International Conference on, pages 51– 58. IEEE.
Chelliah, V., Juty, N., Ajmera, I., Ali, R., Dumousseau, M., Glont, M., Hucka, M., Jalowicki, G., Keating, S., Knight-Schrijver, V., et al. (2014). Biomodels: ten-year anniversary. Nucleic acids research, page gku1181. Chen, M.-S., Han, J., and Yu, P. S. (1996). Data mining: an overview from a database perspective. Knowledge and data Engineering, IEEE Transac-tions on, 8(6), 866–883.
Chirita, P. A., Ghita, S., Nejdl, W., and Paiu, R. (2005). Semantically en-hanced searching and ranking on the desktop. In Proc. of the ISWC Workshop on The Semantic Desktop Next Generation Personal Informa-tion Management and CollaboraInforma-tion Infrastructure. ISWC.
Cooper, J., Scharm, M., and Mirams, G. R. (2016). The cardiac electrophys-iology web lab. Biophysical journal, 110(2), 292–300.
Courtot, M., Juty, N., Kn¨upfer, C., Waltemath, D., Zhukova, A., Dr¨ager, A., Dumontier, M., Finney, A., Golebiewski, M., Hastings, J., et al. (2011). Controlled vocabularies and semantics in systems biology. Molecular systems biology, 7(1), 543.
Elowitz, M. B. and Leibler, S. (2000). A synthetic oscillatory network of transcriptional regulators. Nature, 403(6767), 335–338.
Finkelstein, A. et al. (2004). Computational challenges of systems biology. IEEE Computer, 37(5), 26–33.
Han, J., Cheng, H., Xin, D., and Yan, X. (2007). Frequent pattern mining: current status and future directions. Data Mining and Knowledge Dis-covery, 15(1), 55–86.
Hattori, M., Okuno, Y., Goto, S., and Kanehisa, M. (2003). Development of a chemical structure comparison method for integrated analysis of chem-ical and genomic information in the metabolic pathways. J Am Chem Soc, 125(39), 11853–11865.
Henkel, R., Endler, L., Peters, A., Le Nov`ere, N., and Waltemath, D. (2010). Ranked retrieval of computational biology models. BMC bioinformatics, 11(1), 423.
Henkel, R., Wolkenhauer, O., and Waltemath, D. (2015). Combining com-putational models, semantic annotations and simulation experiments in a graph database. Database, 2015, bau130.
Hucka, M., Bergmann, F. T., Hoops, S., Keating, S. M., Sahle, S., Schaff, J. C., Smith, L. P., and Wilkinson, D. J. (2010). The systems biology markup language (sbml): language specification for level 3 version 1 core. Nature.
Hucka, M., Bergmann, F. T., Keating, S. M., and Smith, L. P. (2011). A profile of today’s sbml-compatible software. In e-Science Workshops (eScienceW), 2011 IEEE Seventh International Conference on, pages 143–150. IEEE.
Juty, N. and Le Nov`ere, N. (2013). Systems biology ontology. Encyclopedia of Systems Biology, pages 2063–2063.
Juty, N., Ali, R., Glont, M., Keating, S., Rodriguez, N., Swat, M. J., Wimalaratne, S., Hermjakob, H., Le Nov`ere, N., Laibe, C., et al. (2015). Biomodels database: Content, features, functionality, and use. CPT: Pharmacometrics & Systems Pharmacology, 2(4), 1–14.
Kanehisa, M., Goto, S., Kawashima, S., Okuno, Y., and Hattori, M. (2004). The kegg resource for deciphering the genome. Nucleic acids research, 32(suppl 1), D277–D280.
Keyvanpour, M. R. and Azizani, F. (2012). Classification and Analysis of Frequent Subgraphs Mining Algorithms. Journal Of Software, 7. Kn¨upfer, C., Beckstein, C., Dittrich, P., and Nov`ere, N. L. (2013).
Struc-ture, function, and behaviour of computational models in systems biol-ogy. BMC systems biology, 7(1), 43.
Koyut¨urk, M., Grama, A., and Szpankowski, W. (2004). An efficient algo-rithm for detecting frequent subgraphs in biological networks. Bioinfor-matics, 20(SUPPL. 1).
Kuramochi, M. and Karypis, G. (2001). Frequent subgraph discovery. In Data Mining, 2001. ICDM 2001, Proceedings IEEE International Con-ference on, pages 313–320. IEEE.
Lakshmi, K. and Meyyappan, T. (2012). Frequent Subgraph Mining Algo-rithms - A Survey And Framework For Classification.
Li, C., Donizelli, M., Rodriguez, N., Dharuri, H., Endler, L., Chelliah, V., Li, L., He, E., Henry, A., Stefan, M. I., et al. (2010). Biomodels database: An enhanced, curated and annotated resource for published quantitative kinetic models. BMC systems biology, 4(1), 92.
Lloyd, C. M., Halstead, M. D., and Nielsen, P. F. (2004). Cellml: its future, present and past. Progress in biophysics and molecular biology, 85(2), 433–450.
Melnik, S., Garcia-Molina, H., and Rahm, E. (2002). Similarity flooding: A versatile graph matching algorithm and its application to schema match-ing. In Data Engineering, 2002. Proceedings. 18th International Confer-ence on, pages 117–128. IEEE.
Novere, N. L., Finney, A., Hucka, M., Bhalla, U. S., Campagne, F., Collado-Vides, J., Crampin, E. J., Halstead, M., Klipp, E., Mendes, P., et al. (2005). Minimum information requested in the annotation of biochemical models (miriam). Nature biotechnology, 23(12), 1509–1515. Olivier, B. G. and Snoep, J. L. (2004). Web-based kinetic modelling using
jws online. Bioinformatics, 20(13), 2143–2144.
Priyadarshini, S. and Mishra, D. (2010). An approach to graph mining using gspan algorithm. In 2010 International Conference on Computer and Communication Technology, ICCCT-2010, pages 425–430.
Ramon, J. and Bruynooghe, M. (2001). A polynomial time computable met-ric between point sets. Acta Informatica, 37(10), 765–780.
Rosenke, C. and Waltemath, D. (2014). How can semantic annotations sup-port the identification of network similarities? In A. Paschke, A. Burger, P. Romano, M. S. Marshall, and A. Splendiani, editors, Proceedings of the 7th International Workshop on Semantic Web Applications and Tools for Life Sciences, page 11. CEUR Workshop Proceedings.
Scharm, M., Wolkenhauer, O., and Waltemath, D. (2015). An algorithm to detect and communicate the differences in computational models describ-ing biological systems. Bioinformatics, page btv484.
Scharm, M., Waltemath, D., Mendes, P., and Wolkenhauer, O. (2016). Co-modi: An ontology to characterise differences in versions of computa-tional models in biology. Technical report, PeerJ Preprints.
Schulz, M., Krause, F., Le Novere, N., Klipp, E., and Liebermeister, W. (2011). Retrieval, alignment, and clustering of computational models based on semantic annotations. Molecular systems biology, 7(1), 512. Smallbone, K., Messiha, H. L., Carroll, K. M., Winder, C. L., Malys, N.,
Dunn, W. B., Murabito, E., Swainston, N., Dada, J. O., Khan, F., et al. (2013). A model of yeast glycolysis based on a consistent kinetic char-acterisation of all its enzymes. FEBS letters, 587(17), 2832–2841. Stanford, N. J., Lubitz, T., Smallbone, K., Klipp, E., Mendes, P., and
Lieber-meister, W. (2013). Systematic construction of kinetic models from genome-scale metabolic networks. PloS one, 8(11), e79195.
Tour´e, V., Mazein, A., Waltemath, D., Balaur, I., Saqi, M., Henkel, R., Pel-let, J., and Auffray, C. (2016). Ston: accessing visual representations of biological pathways using graph databases. Technical report, preprint submitted to biorxiv.
Tyson, J. J. (1991). Modeling the cell division cycle: cdc2 and cyclin in-teractions. Proceedings of the National Academy of Sciences, 88(16), 7328–7332.
Tyson, J. J. and Nov´ak, B. (2010). Functional motifs in biochemical reaction networks. Annual review of physical chemistry, 61, 219.
Waltemath, D. (2015). Invited presentations, junior research groups and re-search highlights at gcb 2015. In A. Mosig, J. Rahnenf¨uhrer, M. Eise-nacher, and S. Rahmann, editors, Invited presentations, junior research groups and research highlights at GCB 2015, volume 3, page e1668. PeerJ Inc. San Francisco, USA.
Waltemath, D., Adams, R., Bergmann, F. T., Hucka, M., Kolpakov, F., Miller, A. K., Moraru, I. I., Nickerson, D., Sahle, S., Snoep, J. L., and Le Nov`ere, N. (2011). Reproducible computational biology experiments with SED-ML–the Simulation Experiment Description Markup Language. BMC systems biology, 5, 198.
Waltemath, D., Henkel, R., H¨alke, R., Scharm, M., and Wolkenhauer, O. (2013). Improving the reuse of computational models through version control. Bioinformatics, 29(6), 742–748.
Waltemath, D., Henkel, R., Hoehndorf, R., Kacprowski, T., Knuepfer, C., and Liebermeister, W. (2016). Notions of similarity for computational biology models. bioRxiv, page 044818.
Washio, T. and Motoda, H. (2003). State of the art of graph-based data mining. Acm Sigkdd Explorations Newsletter, 5(1), 59–68.
Wong, E., Baur, B., Quader, S., and Huang, C. H. (2011). Biological net-work motif detection: Principles and practice. Briefings in Bioinformat-ics, 13(2), 202–215.
W¨orlein, M., Meinl, T., Fischer, I., and Philippsen, M. (2005). A Quantitative Comparison of the Subgraph Miners MoFa, gSpan, FFSM, and Gaston. 9th European Conference on Principles and Practice of Knowledge Dis-covery in Databases, pages 392–403.
Yan, X. Y. X. and Han, J. H. J. (2002). gSpan: graph-based substructure pattern mining. 2002 IEEE International Conference on Data Mining, 2002. Proceedings.
Yu, T., Lloyd, C. M., Nickerson, D. P., Cooling, M. T., Miller, A. K., Garny, A., Terkildsen, J. R., Lawson, J., Britten, R. D., Hunter, P. J., et al. (2011). The physiome model repository 2. Bioinformatics, 27(5), 743–744. Zass, R. and Shashua, A. (2008). Probabilistic graph and hypergraph
match-ing. In Computer Vision and Pattern Recognition, 2008. CVPR 2008. IEEE Conference on, pages 1–8. IEEE.
Zhang, Z. and Zhang, J. (2009). A big world inside small-world networks. PloS one, 4(5), e5686.