Master Thesis Software Engineering Thesis no: MSE-2005-11 August 2005
School of Engineering
Blekinge Institute of Technology Box 520
SE – 372 25 Ronneby
An experimental comparison of five
prioritization methods
- Investigating ease of use, accuracy and scalability
This thesis is submitted to the School of Engineering at Blekinge Institute of Technology in partial fulfillment of the requirements for the degree of Master of Science in Software Engineering. The thesis is equivalent to 20 weeks of full time studies.
Contact Information: Author: Viggo Ahl Address: Almvägen 22C E-mail: Viggo@mensa.se University advisor: Per Jönsson
Department of Systems and Software Engineering School of Engineering
In memory of my grandfather, who was promoted to the glory in 1997. He taught me the most important part of the Holy Scripture:
“Remember that the Holy Scripture teaches us three important words: faith, hope and charity. Greatest of them all is charity.”
A
BSTRACT
Requirements prioritization is an important part of developing the right product in the right time. There are different ideas about which method is the best to use when prioritizing requirements.
This thesis takes a closer look at five different methods and then put them into an controlled experiment, in order to find out which of the methods that would be the best method to use. The experiment was designed to find out which method yields the most accurate result, the method’s ability to scale up to many more requirements, what time it took to prioritize with the method, and finally how easy the method was to use. These four criteria combined will indicate which method is more suitable, i.e. be the best method, to use in prioritizing of requirements.
The chosen methods are the well-known analytic hierarchy process, the computer algorithm binary search tree, and from the ideas of extreme programming come planning game. The fourth method is an old but well used method, the 100 points method. The last method is a new method, which combines planning game with the analytic hierarchy process.
Analysis of the data from the experiment indicates that the planning game combined with analytic hierarchy process could be a good candidate. However, the result from the experiment clearly indicates that the binary search tree yields accurate result, is able to scale up and was the easiest method to use. For these three reasons the binary search tree clearly is the better method to use for prioritizing requirements.
Keywords: Prioritization methods, scalability,
A
CKNOWLEDGEMENTS
It has been a long journey for me to complete this thesis and I have many people to thank for their support and belief in me when I have been in doubt.
First and foremost my thanks go to three persons whom have had a considerably important impact on me. They gave me a solid foundation to stand on when it have felt that the world around me has trembled. My father and mother, who have devoted their lives to give us children a good secure Christian upbringing and my grandfather, who spent several hours to explain and teach me the Holy Scripture, for this I am eternally grateful.
I also wish to extend my gratitude to some people at Blekinge Institute of Technology. First my supervisor, Per Jönsson. It has been a long journey for us both. But without his help this thesis would not have been as good as it is. The second person is Tony Gorschek. With his help and guidance, I began to explore the theory about release planning. In this work he introduced me to Joakim Karlsson’s articles in requirement engineering, which later became the foundation to this thesis. He also gave me some good advice how to structure my writing. This has helped me a lot. The third person is Dr. Mikael Svahnberg, for listening to me and giving me the feedback that I needed when I needed it. In a critical moment in my work with this thesis, I was a little bit confused if I was walking on the right path. Prof. Claes Wohlin took the time to convince me that it was the right path, and gave me some good ideas to think on the rest of the journey. Those ideas that he gave me have then had a positive effect on the outcome of this thesis. For this I am grateful, otherwise I may still have been wandering around without seeing the end of the path that lay in front of me.
I also wish to thank Joakim Karlsson at Focal Point, who was one of the authors of the article that was the foundation to my thesis. In spite that he had other business to attend to, he gave me some feedback and help to understand the difficulties with requirement engineering and the prioritization process.
My gratitude also goes to Adrianna Klevbrant and Elvan Cosmas Uwankonye for their help to proof-reading my thesis.
I also wish to thank all participants in my experiment, without their help I would not have had any data to analysis, and last I wish to thank my friends and family for they support during this time.
T
ABLE OF
C
ONTENTS
ABSTRACT ... III
ACKNOWLEDGEMENTS ... V
TABLE OF CONTENTS ...VII
TABLES OF TABLES ... IX TABLE OF GRAPHS... X 1 INTRODUCTION...1 1.1 DEFINITION...2 2 PURPOSE ...3 3 RELATED WORK ...4 3.1 REQUIREMENT PRIORITIZATION...4
3.2 ANALYTIC HIERARCHY PROCESS...5
3.3 BINARY SEARCH TREE...6
3.4 100POINTS METHOD...6
3.5 PLANNING GAME...6
4 THEORY ...7
4.1 ANALYTIC HIERARCHY PROCESS (AHP)...7
4.1.1 How to apply AHP in requirement prioritizing ...11
4.2 BINARY SEARCH TREE (BST)...11
4.2.1 How to apply BST in requirement prioritizing ...11
4.3 PLANNING GAME (PG) ...11
4.3.1 How to apply PG in requirement prioritizing...12
4.4 100-POINT METHOD (100P) ...12
4.4.1 How to apply 100P in requirement prioritizing...13
4.5 PLANNING GAME COMBINED WITH AHP(PGCAHP)...13
4.5.1 How to apply PGcAHP in requirement prioritizing ...14
5 METHOD...15
5.1 DESIGN...15
5.1.1 Definition ...15
5.1.2 Selection of context...15
5.1.3 Hypothesis...16
5.1.4 Variables in the experiment...16
5.1.5 Objects used in the experiment...17
5.1.6 Selection of test subjects...17
5.1.7 Execution plan ...18
5.1.8 Instrumentation...18
5.1.9 Threats to validity...19
5.1.10 Method for analysis the data ...22
5.2 EXECUTION OF THE EXPERIMENT...22
5.2.1 Preparation...22
5.3 ANALYSIS AND INTERPRETATION OF THE DATA...24
5.3.1 Normality test...24
5.3.2 Descriptive statistics...25
5.3.3 Data set reduction ...25
5.3.4 Hypothesis testing...25
6 EXPERIMENT IN REALITY ...34
6.1.1 The appearance of the experiment tool...34
6.2 PRETEST...35
6.3 THE EXPERIMENT...36
6.4 DATA SET REDUCTION...36
6.4.1 Time...37 6.4.2 Final Easy...37 6.4.3 Final Accurate ...37 6.4.4 Time/Comparison ...37 6.5 HYPOTHESIS TESTING...38 6.5.1 How easy...38 6.5.2 How certain ...40
6.5.3 How long time...41
6.5.4 Final Easy...44
6.5.5 Final scalable ...45
6.5.6 Final Accurate ...47
6.5.7 Final Best...48
6.5.8 Time per comparison...49
6.5.9 Experience ...51
6.5.10 Statistical summary ...52
7 CONCLUSIONS ...54
7.1 GENERAL CONCLUSION...54
8 FUTURE WORK ...56
8.1 NO ECONOMY TEST SUBJECTS...56
8.2 TOO FEW REQUIREMENTS...56
8.3 NO PROFESSIONALS...56
8.4 THE MOTHER OF ALL PRIORITIZATION EXPERIMENTS...56
REFERENCES...57
APPENDIX I: REQUIREMENTS...61
APPENDIX II: RAW DATA FROM THE EXPERIMENT ...62
EASY...62 CERTAINTY...62 TIME...62 FINAL EASY...63 FINAL SCALABLE...63 FINAL ACCURATE...63 FINAL BEST...64 NUMBER OF COMPARISONS...64 EXPERIENCE...64
TIME PER COMPARISON...65
APPENDIX III: THE EXPERIMENT TOOL ...66
INTRODUCTION...66
METHODS...69
T
ABLES OF TABLES
Table 4-1 Basic scale according to Saaty [3] for pair-wise comparisons in AHP ...7
Table 4-2 Matrix of pairwise comparisons...8
Table 4-3 AHP Adding requirement in matrix ...9
Table 4-4 AHP dividing the sum ...9
Table 4-5 Random indices for AHP ...10
Table 4-6 PGcAHP Number of Comparisons...14
Table 5-1 Time plan ...23
Table 5-2 Easy Normality Test...27
Table 5-3 ANOVA Formulae ...29
Table 5-4 Easy Tukey-Kramer Multiple-Comparison Test ...30
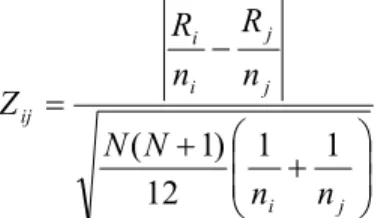
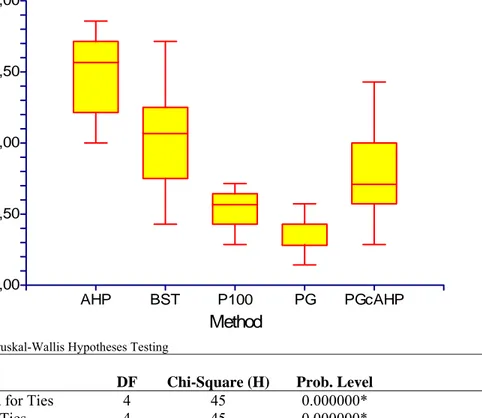
Table 5-5 Time Kruskal-Wallis Hypotheses Testing ...32
Table 5-6 Time KW Multiple-Comparison Z-Value Test ...33
Table 6-1 Outliers in Time ...37
Table 6-2 Outliers in Time per Comparison...38
Table 6-3 Easy Normality Test...38
Table 6-4 Easy ANOVA...39
Table 6-5 Easy Tukey-Kramer Multiple-Comparison Test ...40
Table 6-6 Certain Normality Test...40
Table 6-7 Certainty ANOVA...41
Table 6-8 Time Normality Test ...41
Table 6-9 Time Kruskal-Wallis Hypotheses Testing ...42
Table 6-10 Time KW Multiple-Comparison Z-Value Test ...43
Table 6-11 Final Easy Normality Test...44
Table 6-12 Final Easy ANOVA ...44
Table 6-13 Final Easy Tukey-Kramer Multiple-Comparison Test...45
Table 6-14 Final Scalable Normality Test...45
Table 6-15 Final Scalable Kruskal-Wallis Hypotheses Testing ...46
Table 6-16 Final Scalable K-W Multiple-Comparison Z-Value Test ...47
Table 6-17 Final Accurate Normality Test ...47
Table 6-18 Final Accurate ANOVA...48
Table 6-19 Final Best Normality Test ...48
Table 6-20 Final Best Kruskal-Wallis Hypotheses Testing...49
Table 6-21 Time per Comparison Normality Test...50
Table 6-22 Time per Comparison ANOVA ...50
Table 6-23 Time per Comparison Tukey-Kramer Multiple-Comparison Test...51
Table 6-24 Definition of experience/knowledge level ...51
T
ABLE OF
G
RAPHS
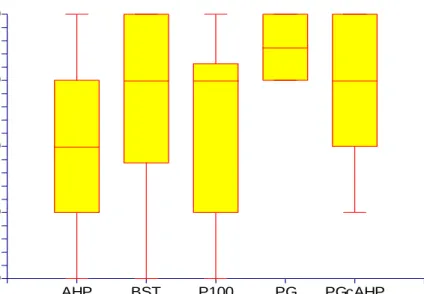
Graph 5-1 Example Box-plot from Easy ...27
Graph 5-2 Explained and Unexplained Variance at regression ...28
Graph 5-3 Example Time ...32
Graph 6-1 Easy Box-Plot...39
Graph 6-2 Easy Plots of Means ...40
Graph 6-3 Certainty Box-Plot...41
Graph 6-4 Time Box-Plot ...42
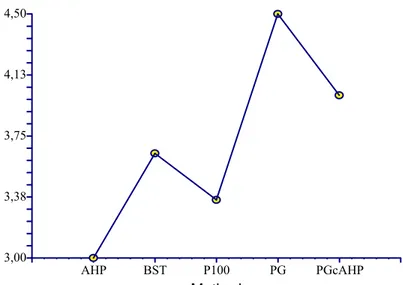
Graph 6-5 Time Plots of Means...43
Graph 6-6 Final Easy Box-Plot...44
Graph 6-7 Final Easy Plots of Means ...45
Graph 6-8 Final Scalable Box-Plot...46
Graph 6-9 Final Scalable Plots of Means ...47
Graph 6-10 Final Accurate box-Plot...48
Graph 6-11 Final Best Box-Plot ...49
Graph 6-12 Time per Comparison Box-Plot...50
1
I
NTRODUCTION
To develop products to a “mass-market” is a little bit different than developing a product to a specific customer. When a company develops a product to a specific customer, it is easier to find out who the user is, and how to elicit their demands. However, when a company develops to a mass-market, the customer becomes more diffuse. Who is the customer? What are the customer’s demands? Etc. To answer these questions the company often makes a market research. According to the answer they get in that research they decide what is the most important for the customer and which requirements are worth to develop in a project/product.
Usually after these questions have been answered, more questions arise, such as which of the customer demands are most important and which are less important, which demands will bring most profits to the company and which will not? Which requirement should they include and which should they exclude?
When the next release is planned, there are often more demands than there is time to implement them, according to Carlshamre et al [23] and Carlshamre [24]. That means that the company has to plan each release and the release that will follow that release. But how do they know which demands should become requirements, and which of those requirements should be in the next release and which should be in release n + 1, etc.
Those kinds of questions belong to requirement engineering and release management. This master thesis focuses on the prioritization area of release management, and different techniques for prioritizing requirements.
There are several authors that have published books and articles about how neglected and important the requirement engineering and the prioritization of requirements are [27] [40] [41] [42] [43]. According to Karlsson [41] a large amount of requirements are rarely used (19 percent) or never used (45 percent). Only about 36 percent of all functions in software are sometimes used or always used. This means that software developing departments/companies are spending a lot of time, money and resources to develop software that has no or little meaning.
My goal with this thesis is to try to find out which method for prioritizing requirements is the fastest, easiest to use, yields the most accurate result and is most scalable. This has been made before by Karlsson et al [1] but I have chosen to have five methods instead of the six methods that Karlsson et al had. Two of the methods are the same as in the evaluation conducted by Karlsson et al and those are AHP and BST. At the same time I have used a new method, which was suggested in an article by Karlsson et al. [6], and that is to combine PG with AHP.
The next chapter will describe the purpose with this thesis. Chapter three describes what other researchers have written about requirement elicitation, prioritizing and other areas of interest for understanding this thesis.
Chapter four describes in more detail the theory of each and every method, and also how to apply the method when you are doing requirement prioritization. Chapter five describes the theory concerning what to think about when conducting an experiment and also some theories about statistical analysis, which could be of help for the reader, to easier understand the part in chapter six that present the result from the experiment. Chapter six describes how the experiment was conducted; the experiment tools that were used to collect the data and the analysis of the result from the experiment. Chapter seven has two parts, a detailed conclusion and a general conclusion. Chapter eight is all about what kinds of follow up experiments that could be interesting to conduct.
The appendix has three major parts:
1. Presentation of requirement that were used during the experiment.
2. Information about the raw data that have been analysed in its original form. 3. Pictures from the experiment tools.
1.1
Definition
The following abbreviations will often be used in this these. Name/acronym Definition
AHP Analytic Hierarchy Process
BST Binary Search Tree
PG Planning Game
100P or P100 100 Points Method or 100 Dollar Method
PGcAHP PG combined with AHP
ANOVA ANalysis Of Variance
K-W Kruskal-Wallis T-K Tukey-Kramer
2
P
URPOSE
In 1997 Karlsson et al [1] published their article -“An evaluation of methods for prioritizing software requirements”. After this publication there has only been made comparisons between two different methods at a time. The problem for a reader or a researcher of these papers is to know which method is the most suitable to use when prioritizing requirements.
The reason why it is not possible to compare the evaluation with this experiment is that each experiment has its own conditions, and its own variables, that the test depends on. Since the experiments are not the same, they can not be compared against each other very easily.
One way to solve this problem is to test more than two methods in a controlled experiment. The purpose of this thesis is to do a controlled experiment that is based on the evaluation by Karlsson et al [1], with the difference that some of their methods have been exchanged with newer techniques that have evolved since that experiment took place.
3
R
ELATED WORK
Related work has been split into five different sections. The first section discusses generally what is around requirement prioritizing, and what has been done in this field. The next four sections have been devoted to each of the four main prioritization techniques. The only method that does not have its own section is Planning Game combined with AHP, because this is a new technique that was proposed by Karlsson et al [6] and has not yet been evaluated, before this experiment.
3.1
Requirement prioritization
Karlsson et al [26] claims that one of the greatest problems for software developers is that they might develop a product that does not satisfy their customer’s needs and expectations. In the article “Supporting the Section of Software Requirements” [26], Karlsson et al came to the conclusion that “the set of requirement selected for implementation is a primary determinant of customer satisfaction.” Karlsson and Ryan [26] warn the reader to focus only on the requirements importance regarding the implementation cost or only on the economic value for implementing specific requirements. Both of these should be considered according to Karlsson and Ryan [26]. This article was followed up by the article about “A Cost-Value Approach for Prioritizing Requirements” [27] from the same authors. In this article they presented a solution to the problem that was presented in [26]. The solution was to let the customer or somebody from the marketing department (often one or more persons with economic background) prioritize according to customer value, and the developing department/company (often someone with a technical background) prioritize according to the development cost. Both of those two groups should use AHP as the prioritization method. Then these two prioritizations were presented in a graph, where the x-axis represented the cost to develop the requirement and the y-axis represented the customer value that the requirement expected to yield. From this graph it is rather easy to pick those requirements that had the best ratio between value and cost. The reason why Karlsson and Ryan thought that AHP should be used was: “is based on a well-established analytic technique with reasonable effort provides a clear indication of the relative costs and values of all candidate requirements”.
In the article [27] Karlsson and Ryan present two case studies that support their claim. Karlsson and Ryan are not the only scholars that stress the importance of the elicitation and prioritization process. Xiaoqing et al [28] wrote in their article “the pressure on time-to-market and being able to plan for successive releases of software products has posed significant challenges on the requirements engineering process.” Xiaoqing et al [28] proposed a framework in their article how multiple stakeholders should be able to prioritize the requirements at the same time. However, even though their framework seems to be able to do that, they have the same problem as AHP has; it takes a very long time to prioritize the requirements.
Fellows and Hooks [33] also emphasize the importance of requirement engineering and the prioritization of requirements. Fellows and Hooks [33] write about one single customer’s problems and benefit, “It would save time and money if the customer would indicate those requirements that have high priority versus those with low priority from the beginning. The developer would know what the customer wants as opposed to deciding what the customer wants by guessing or applying the development organization’s priorities”. Fellows and Hooks [33] also write that this is applicable to the mass-market; “A similar situation exists for commercial products. Marketing, as opposed to a specific customer, may define the requirements, but breakdowns in communication with developers can occur. This breakdown can result in problems with delivering the new or
According to Fellows and Hooks [33] the first requirements are usually a list of whishes, which is too long and too imprecise to be able to be implemented. Hence, there has to be some kind of prioritization of the requirements. Fellows and Hooks [33] also lay stress on that all requirements are not of equal importance. The benefit for the stakeholders is that it helps them to identify the core requirements; also this process helps the system architect to design the system.
There is an important aspect of requirements prioritization that is not discussed in this thesis: dependencies between the requirements. The dependencies could be for example that requirement A cannot be implemented before requirement B. The reason for this is simply because the study would be very complex. The number of potential independent variables would increase, and that would make it harder to analyze the collected data. This makes the disadvantage to be greater that advantage, for this reason the decision was made to take the more simple approach, i.e. prioritize the requirements without taking notice to the potential dependencies. However there have been studies, for example Greer and Ruhe [47], about the problem with dependencies between requirements.
3.2
Analytic Hierarchy Process
Thomas Saaty published an article in 1980 about AHP [3]. His idea about AHP has then been widely spread into many different areas of decision making, such as the decision by the US Congress on Chinas trade status, predicting the stock market, deciding how to scale up power plants [32], quality control with statistical process control [36]. For some of these decisions Saaty has written articles, a list of which can be found at his homepage [29]. There have been other scholars who have published their perceptions how to apply and to interpret the results of AHP. According to Saaty, some of those scholars have misunderstood AHP and as a result Saaty published an article in 1997 [22], which describes what the other scholars did misunderstand and explained exactly what AHP is. In this article he stated that AHP is a paired wise engine that generates relative measurement for the object for the decisions.
In 1997 Saaty and Hu [30] also published an article about using eigenvector versus other methods in AHP. The conclusions from this article is that even though the eigenvector method is not the most accurate method, it has a simpler mathematical formula, hence it is easier to understand and to use, this method is also relatively faster than the other methods that have been suggested to use with AHP. The most important is that even though the other methods seem to yield better results, the results are not that much better that it is worth the extra effort to use one of these. The reason for this, according to Saaty and Hu [30], is that the largest source of errors is the human judgment assessment which is inclined to make error decisions. Karsten and Garvin [35] claim that “decisions support tools, in particular the Analytical Hierarchy Process, can provide the necessity and valuable assistance in the identification and selection of telecommunication pilot project participants”.
Hartwich conducted a study, in which he gathered over 100 researchers who were faced with a major problem [37]. The problem was “how to improve the country’s welfare through improving cropping”. The group of researchers was formed into subgroups, each subgroup containing a farmer and a researcher. Each group’s task was to decide which criteria were most important for the outcome of good cropping. After the discussion each group was interviewed. As a method AHP was chosen. In this article the strengths and limitations of AHP in this scientific field is being analyzed. Hartwich’s conclusion is that in overall AHP presents a powerful tool to use for weighting and prioritizing research output. It is suitable to structure complex problems, especially with discrete alternatives which is the case in agricultural research. However, Hartwich has also some negative to say about AHP. The first negative is that AHP requires a large amount of pair wise comparisons. Also Hartwich points out why it could be a negative thing to have so many comparisons. “Some interviewees may find it somewhat tedious to
go through that amount of pairwise comparisons … Related to this critique is the argument that after a certain time, experts may lose interest in the interviews” [37]. Another negative issue that Hartwich takes up is that different stakeholders could have different opinions about the importance of a certain issue/problem. However, Hartwich emphasizes that even though AHP has some negative problems, these should not rule out the advantages of AHP.
3.3
Binary Search Tree
There have been many studies done at Binary Search Tree, for example [44] [45] [46] [48]. However, those studies are focused on study binary search tree as a data algorithm and not as a method for prioritizing requirements. In the evaluation by Karlsson et al [1], BST was ranked as second best method to be used. It seems that all research after that has been to find new methods or put more effort in studying the winning method of the evaluation, i.e. AHP.
3.4
100 Points method
The 100 points method is probably the oldest and simplest form of prioritization. The 100P has many names; among them are 100 dollar method, 100 points method and cumulative voting [5]. There is no exact knowledge when 100P was invented or how long it has been used. The first time that 100P method was used, was probably when the human race began to exchange objects with each other. For example: you get two skins for your flint axe, or you can exchange your flint axe for three baskets. So the question would then be which is most important to you, the basket or the skins? However, if this was the first time or not, is purely speculative, since there are no references when someone first began to practice this method. There has been some studies done of the effect of using 100P; most of those studies could be found in journal of law or economic, for example [49] [50] [51] [52]. In the science of software engineering, there has not been published so much about it, some of the few books and articles about 100P are Leffingwell and Widrig [5] and Regnell et al [25].
3.5
Planning Game
Planning Game is an important part of extreme Programming, according to Beck [4], the architect of extreme programming. In spite of this importance, there have been very few studies about the strengths and weakness of Planning Game. In one of the recent articles by Karlsson et al. [6] they compare the well known and used AHP against PG. Karlsson et al found that PG was considered easier to use. They came to the conclusions that both methods has their own strengths and weaknesses, and it would be interesting to have PG to first sort out the most important requirements, and then using AHP to prioritize among those requirements. Rumpe and Schröder [39] have done a quantitative study on extreme programming projects, in which they identified which companies that were using extreme programming in some way. Then they sent them a letter with some questions they asked them to answer. From this study of 45 different development projects, nearly 70 percent were using PG. However, 90 percent believed that PG could be improved, but they did not give any clear answer what could be improved in PG only that it could be improved.
4
T
HEORY
This thesis is a replication of the evaluation that Karlsson et al [1] did back in 1997. The main difference between their evaluation and this thesis is that this is a controlled experiment and Karlsson et al had six different methods, while in this thesis only five have been selected into the experiment.
To be able to compare this study with the evaluation that Karlsson et al [1] did in 1997, this study has to have some of the prioritization methods that they had. With this argument, I have chosen to use the best and second best method that they found, i.e. Analytic Hierarchy Process (AHP) and Binary Search Tree (BST).
Paetsch et al [2] claims that agile software development has become popular during the last year. One of the most popular methods are the extreme programming, which has a prioritization technique called Planning Game (PG). Since this is a new method and it is popular one it has been qualified to be among the five techniques. The fifth method is a rather easy and quick method (at least according to the theory), and that is the 100 points method. In this chapter there will be a description of each method, both in theory and then how it works practically (How to apply the method in requirement prioritizing).
4.1
Analytic Hierarchy Process (AHP)
The Analytic Hierarchy Process (AHP) was first developed and explained by Saaty [3] in 1980. Regnell et al [25] claim that even though this is a promising technique, the technique itself is not adapted to distributed prioritization with multiple stakeholders; hence it has to be modified in one way or another. However, at present time there have not been published any research how that kind of modification would function.
In AHP the candidate requirements are compared pair-wise, and to which extent one of the requirements is more important than the other requirement. Saaty states that the intensity of importance should be according to Table 4-1.
Table 4-1 Basic scale according to Saaty [3] for pair-wise comparisons in AHP
How important
Description
1 Equal importance
3 Moderate difference in importance
5 Essential difference in importance
7 Major difference in importance
9 Extreme difference in importance
2,4,6,8 Intermediate values between
Reciprocals If requirement i has one of the above numbers assigned to it when
compared with requirement j, then j has the reciprocal value when compared with i.
To fully understand AHP it is easiest to divide AHP into three different phases. 1. Comparing every pair of requirements, this is the “engine” of AHP, according to
Saaty [22].
2. Derives a priority vector of relative weights for these requirements, i.e. the principal eigenvector.
The question is what does this mean? First we take the requirements that should be prioritized (the total amount of requirement is n), and put them into a matrix, where the rows have the index of i and columns have the index of j. The matrix is called W and the elements in the matrix are called w. The requirement that is placed in row i and column j gets the index ij. Therefore the element wij has the row index = i and column index = j.
Table 4-2 Matrix of pairwise comparisons
Req. 1 Req. 2 … Req. n
Req. 1 1 w12 w1j w1n
Req. 2 w21 1 w2j W2n
… wi1 wi2 1 win
Req. n wn1 wn2 wnj 1
Each matrix element consists of the comparison between two requirements (i and j), which gives us the following relationship:
j i ij w w w = . (1)
An important notice is that the person that does the prioritization does not put any value on wi and wj, instead he or she decides the value for wij which is the ratio between wi and
wj. That leads us to another important relationship, which is that for every index of i, j, k
has the following relationship:
kj ik ij ji ij w w w w w = −1, = (2)
With the information from formulae (1) and (2) and the matrix Table 4-2 we can see that some pair-wise comparisons are doing twice. The problem with human perception and judgments are subject to change if the human becomes tired or something changes the human psychological state (i.e. the level of blood sugar is dropping, and thereby the concentration). To solve this problem, Saaty [3] proposed that we should only compare
aij, j >i. With this solution we do not need to do n2 comparison. Instead we only need to
do half the comparison, since the formulae (2) say that wij = 1/wji. So it is really easy to
apply this formula (2) to the comparisons that are not necessary. This leaves us to the diagonal, with the comparison with requirement wi and wi they will always be equal (i.e.
the reciprocal value 1). Hence, we do not need to do this comparison either. This led us to the formulae (3): 2 ) 1 (n− n (3) The next step according to Saaty is to calculate the eigenvector v. The elements of the
eigenvector correspond to the priorities of the requirements. Gass and Rapcsák [55] describe it in the following way: If W is a consistent matrix, i.e. formulae (2) holds for all the indices of i, j, k, then W is of rank one and λmax= n . Iff the relationship λmax= n is true,
W is a positive reciprocal matrix.
Wv = λv (4)
The formula (4) is the mathematical definition on the relationship between the eigenvalue and the eigenvector. This is nothing that is specific for AHP, but is valid for all matrices. .
This means that v must be the eigenvector of W that correspond to the maximum eigenvalue λ. What this mean in reality is that you take every prioritization in you matrix and calculate the sum of the j columns.
Then you divide each element in the column with the sum, z, you calculated with formulae (5). The next step is to add up the element in row i. The final step is to divide each row sum with the amount of requirements n. Let’s see AHP in action.
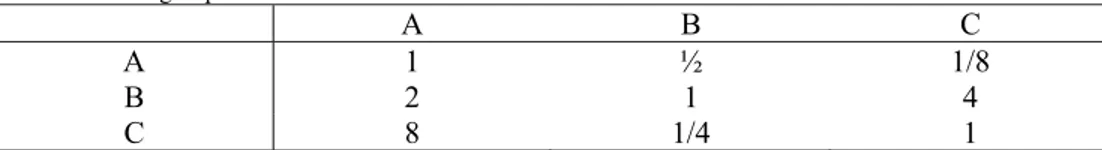
In this example we have three requirements, A, B and C. We begin to put them in a matrix and assign weight ratios for them:
Table 4-3 AHP Adding requirement in matrix
A B C A 1 ½ 1/8 B 2 1 4 C 8 1/4 1 The next step is to calculating the sum of each column. For the first column we get
1+2+8= 11, the next column we get the sum ½ + 1 + ¼ = 1.75 and in the final column we get the sum 1/8+4+1 = 5.125. Now it is time to divide each element with the corresponding sum of its column and calculate the row sums.
Table 4-4 AHP dividing the sum
A B C Sum
A 1 / 11 = 0.09 (1/2)/1.75 = 0.29 (1/8) /5.12 = 0.02 0.40
B 2 / 11 = 0.18 1 / 1.75 = 0.57 4/5.12 = 0.78 1.53
C 8 / 11 = 0.73 (1/4)/1.75 = 0.14 1/5.12 = 0.20 1.07
The final step is to normalize the sum of the rows (i.e. divide each row sum with the number of requirements, which is in our case 3.
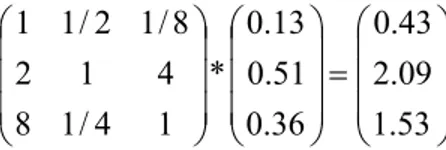
⎟ ⎟ ⎟ ⎠ ⎞ ⎜ ⎜ ⎜ ⎝ ⎛ = ⎟ ⎟ ⎟ ⎠ ⎞ ⎜ ⎜ ⎜ ⎝ ⎛ 36 . 0 51 . 0 13 . 0 07 . 1 53 . 1 40 . 0 * 3 1 (6) The last “( )” with all the values (i.e. 0.13; 0.51; 0.36) represents the normalized
eigenvector of the comparison matrix. Based on the elements in the normalized eigenvector, also known as the priority vector, we can draw the following conclusion:
• Requirement A, degree of importance is 13% • Requirement B, degree of importance is 51% • Requirement C, degree of importance is 36%.
The degree of importance could be what kinds of business value that requirement yields or what it costs to develop or any other kind of importance. All depending on what aspect that the person that prioritized had in his/her mind during the prioritization.
The final phase is to calculate how consistent the prioritization has been done. The reason why that is important is of the following reason. If a person prioritizes that A is more important than B, B is more important than C and finally, C is more important than A, this will mean that C is more important than C, which can not be true. I.e. the person has done a judgment error, hence it is important to find out if the person is consistent in his/her judgment. The consistency index (CI) is calculated by the formulae (7)
(
)
(
1)
max − − = n n CIλ
(7) λmax is the maximum eigenvalue of the matrix. If the λmax value is close to n, thenumber of requirements, then there have been little judgment errors and the more consistent the result is. To be able to estimate the value for λmax, you take the matrix and
⎟ ⎟ ⎟ ⎠ ⎞ ⎜ ⎜ ⎜ ⎝ ⎛ = ⎟ ⎟ ⎟ ⎠ ⎞ ⎜ ⎜ ⎜ ⎝ ⎛ ⎟ ⎟ ⎟ ⎠ ⎞ ⎜ ⎜ ⎜ ⎝ ⎛ 53 . 1 09 . 2 43 . 0 36 . 0 51 . 0 13 . 0 * 1 4 / 1 8 4 1 2 8 / 1 2 / 1 1 (8)
The next step is to take the first element of the resulting vector and divide it with the first element of the priority vector and then do the same with the second element and so on. ⎟ ⎟ ⎟ ⎠ ⎞ ⎜ ⎜ ⎜ ⎝ ⎛ = ⎟ ⎟ ⎟ ⎠ ⎞ ⎜ ⎜ ⎜ ⎝ ⎛ 64 . 4 10 . 4 31 . 3 33 . 0 / 53 . 1 51 . 0 / 09 . 2 13 . 0 / 43 . 0 (9)
λmax is calculated by the formulae (10):
02 . 4 3 64 . 4 10 . 4 31 . 3 max = + + =
λ
(10)Now we have so much information that we could calculate the consistency index (11): 51 . 0 1 3 3 02 . 4 1 max = − − = − − = n n CI
λ
(11)How do we know if the CI is acceptable? This is done by calculate the consistency ratio CR. The CR is a ratio from CI and RI, where RI is one of the random indices [3]. We get the RI value from the following Table 4-5
Table 4-5 Random indices for AHP
1 2 3 4 5 6 7 8 9 10 11 12 13
0.00 0.00 0.58 0.90 1.12 1.24 1.32 1.41 1.45 1.48 1.49 1.51 1.56 According to Table 4-5, the RI for our matrix (3 requirements) is 0.58. That gives us a
CR of. 88 . 0 58 . 0 51 . 0 = = = RI CI CR (12)
According to Saaty [3] a result of 0.10 or less is to be considered acceptable. Our value of 0.88 clearly indicates that there has been a serious judgment error in the prioritization process. Hence, the process should be restarted.
All this calculation is the strong part of AHP, which give us a good way to evaluate if we have taken good decision or not. AHP has been used to predict a variety of decision, from stock market portfolio, economic forecasts, oil prices, political candidate, etc.
However AHP has some weakness. Since it takes n(n-1)/2 comparisons, it does not take many requirements before it is nearly impossible to use AHP in decision-making. For example if the amount of requirement are 10, then it takes 45 comparisons. If the number of requirements is 20, then it takes 190 comparisons, and if the number of requirements is 100, it takes 4950 comparisons. A software project could have up to several thousand requirements, which mean that the number of comparisons exceeds over 500 000, and it will take too long time to compare all the requirements, and the question would then be; should AHP be used or not?
In this experiment, the consistency is not calculated. This is an important part of AHP, however in this experiment it is other elements that are of interest. Hence it is not necessary to calculate consistency ratio to be able to compare AHP with the other methods.
4.1.1 How to apply AHP in requirement prioritizing
1. Structure all requirements in a matrix, so that the matrix represents all unique pairs. 2. Compare all the unique pairs in the matrix, with the scale in Table 4-1.
3. For the presentation, use Saaty’s idea about priority vector and relative weights for these requirements, i.e. the principal eigenvector.
4. Calculate how consistent the prioritizing person has been in his/hers judgment. The consistency index indicates how trustworthy the results are, and also how much judgment error that the prioritizing person has done in the comparisons.
4.2
Binary Search Tree (BST)
BST is a computer algorithm with the purpose to store information, which then could be retrieved or sought after. The BST Т usually is either empty, or has one or two child nodes. The child nodes to the right (Тr) have greater value/importance than the root node
R, and the child nodes to the left (Тl) have less value/importance then the root node R.
Each child node is in itself a root node to its child node. If a node does not have any child nodes, it is called a leaf. This makes it possible to search in the BST recursively. The benefit for using BST, when prioritizing requirements, is that with n requirements, it takes only n log n [38] comparisons until all the requirements have been inserted in order. That makes BST a fast candidate, which could be good if there is a lot of requirement to prioritize among, i.e. BST could easily scale up to thousands of requirements, and still be a very fast candidate. There is one important thing to know about the BST algorithm, which is that a tree needs to be balanced to have the shortest insertion time.
A balanced BST is a BST where no leaf is more than a certain amount farther from the root than any other leaf. After a node has been inserted or deleted the tree might have to be rebalanced if but only if the BST would reach an unbalanced stated. The reason for this is that the insertion of a node should be optimal, i.e. log n.
The scale between each requirement is on the ordinal scale. That means that we only could find out if one requirement is more important than another, but not to what extent. Another negative problem with BST is that there is no consistency ratio that we could calculate, hence we do not know if we have done a precise prioritizing or not.
4.2.1 How to apply BST in requirement prioritizing
1. Put all requirements in one pile.
2. Take one requirement and put as root node.
3. Take another requirement and compare it to the root node.
4. If the requirement is less important then the root node, compare it to the left child node. If the requirement is more important then the root node, compare it to the right child node. If the node does not have any appropriate child nodes, insert the new requirement as the new child node to the right or left depending on if the requirement is more or less important.
5. Repeat steps 3 - 4 until all requirements have been compare and inserted in the BST. 6. For the presentation, traverse through the entire BST in order and put the
requirements in a list. So that the less important requirement would be in the end of the list, and that the most important requirement should be in the start of the list.
4.3
Planning Game (PG)
In extreme programming the requirements are written down by the customer on a story card. Then the customer divides the requirements into three different piles. According to Beck [4], the piles should have the names; “those without which the system will not function”, “those that are less essential but provide significant business value” and “those that would be nice to have”. At the same time as that the customer sorts the story cards, the programmer estimates how long time each requirement would take to implement and then begin to sort the requirements into three different piles, i.e. sort by risk, with the
names; “those that can be estimated precisely”, “those that can be estimated reasonably well” and “those that cannot be estimated at all”.
The customer or one or several represesntatives for the customer1 could either decide
on a fixed release date, or decide which requirements that should be included in the next release. The end result of this sorting is a sorted list of requirements on an ordinal scale. Since PG takes one requirement and then decides which pile the requirement belongs to and each requirement is not being compared to any other requirement, the time to prioritize n requirements is n comparisons. This means that PG is very flexible and can scale up to rather high numbers of requirements, without taking too long time to prioritize them all.
4.3.1 How to apply PG in requirement prioritizing
1. Put all requirement in pile
2. Take one requirement. Decide in which pile of the three piles that the requirement should be placed in.
3. Repeat 2 until all requirements have been sorted.
4. Take all requirements in the pile “those without which the system will not function”, and developed the system with them.
4.4
100-Point Method (100P)
Leffingwell and Widrig [5] think that “This simple test is fun, fair and easy to do”. As the name indicates, each person that should be involved gets hundred points of some value. With these points they should “purchase ideas”. Each person writes down on a paper how much they think that one requirement is worth. When all the participants have written down their points, one person calculates, by taking the paper and summing up the points that each requirement has got, and presents the cumulative voting results. The requirement that has got the highest score is the most important requirement.
Leffingwell and Widrig [5] claim that the problem with this method is that it only works once in every project. There is some reasons why. One of them is that when the results have been presented, each and every one could see how the others have voted. If one participant’s favorite requirement comes on the first place, and the next favorite requirement comes on the last place, this person could in the next round put all his points on the next favorite requirement, and thereby be able to get two of his requirement to the top position. Another warning that Leffingwell and Widrig [5] give is that it could be necessary to put a limit to how much one person could spend at one single requirement. If there is no limit, one clever participant could estimate that requirements like “user friendly”, “nice GUI” or something like that would get high value, but he also would like the software to be able to run on most OS. Thereby he put all his points on “platform independent” and with that choice hopes to get both requirements on the list.
Theoretically 100P is equally flexible as PG when it comes to the number of comparisons, i.e. n requirements takes n comparisons. Hence, it should be a really fast and scalable method, also in comparison to both AHP and BST. However, even though it has the same amount of comparisons as PG, i.e. n, it probably would take longer time to do the actual comparisons. The reason for this is that, while in PG the decision should be in which pile to put a requirement, i.e. ordinal scale, which is the same scale as BST, in BST the decision should be if requirement a is more or less important than requirement b. For 100P the scale is ratio, which is the same scale as for AHP. So the person that does the prioritization has to consider to which extent one requirement is more or less important than the other. At the same time he or she has only a small amount of points to
distribute, which probably also takes some time to take into account in the distribution of points to the different requirements.
4.4.1 How to apply 100P in requirement prioritizing
1. Put all requirements in a row.
2. Divide all the points among the requirements, according to which requirements are most important to the system.
4.5
Planning Game combined with AHP (PGcAHP)
Karlsson et al [6] did a study regarding the difference between PG and AHP. In the discussion of the paper; they stated that it would be interesting to combine PG with AHP, so that this combined method would use the strengths in each method and eliminate their weaknesses.
The strength of PG is that it is rather fast [6], i.e. for n requirements the total prioritization takes n comparisons, but the downside is that it is not possible to calculate the consistency rate, nor could we say how important one requirement is against another, only that it is more important. The strength of the AHP is that it is possible to calculate the consistency rate and know exactly how important one requirement is against the other. The negative is that for each requirement the number of pair-wise comparisons that needs to be done grows exponentially. For n requirements the total number of pair-wise comparisons is 2 ) 1 (n− n .
The idea of Karlsson et al [6] is to first divide all requirements into three piles with PG. Then the user should take the most important pile and prioritize the requirements with AHP.
The benefit is that the requirement engineer could pay attention to the most important requirements instead of those less important. This could mean that the development team saves time. The fewest number of comparisons with PGcAHP would be equal to PG, i.e.
n. However this would indicate that there is at most one requirement that is very
important. The other requirements are either important or not important. In this case the idea would be to redo the PG part, or to apply AHP on the middle pile of requirements. The above scenario with max one very important requirement is only theoretical, logically an application need more than one requirement to be able to function properly. According to Berander [13], it is not likely that only one requirement is marked as very important, instead Berander’s study clearly confirms that approximately 80 to 90 percent of the requirements are very important. Berander describes three scenarios, and it is only in the first and second scenario where the theory about 80 – 90 percent is the same as in reality:
1. A sharp project that should be developed into a product. Probably depends on the fact that you can sit together with the client and discuss which requirements that are most important.
2. A school-project which will be developed into a product and where the students have the same opportunity to sit down with the client and discuss the requirement.
3. Students in a classroom that should learn how different prioritization methods work. In this case Berander’s study indicates that approximate 50 percent of the
requirements are important.
From these scenarios we can begin to formulate the formulae for how many comparisons that PGcAHP would take. But first we take a closer look at the worst and the best case. The best case with the lowest number of comparisons is equal to not putting any requirements in the most important pile, i.e. the number of comparisons is equal to n. The worse case is that all the requirements have been placed into the most important pile. That would lead to the longest time to prioritize the requirements, which would be equal
to 2 ) 1 ( − +n n
n , i.e. the number of comparisons for PG + the number of comparisons for AHP. However, as Berander wrote in his article [13] that about 80 to 90 percent of all requirements is important, i.e. the first and second scenario above, would indicate that the number of comparisons for PGcAHP would be according to the Table 4-6:
Table 4-6 PGcAHP Number of Comparisons
PGcAHP Number of Comparisons
80 % 90 % 2 2 . 1 8 . 0 2 ) 1 ( * % 80 2 n n n n n+ − ⇒ + 2 1 . 1 9 . 0 2 ) 1 ( * % 90 2 n n n n n+ − ⇒ +
From the result of Table 4-6 it is rather obvious that in some cases it is better to use AHP than the combined method with PG. The question would then be; when should the user use AHP and when is it suitable to use PGcAHP. That question is not easy to answer. However, the mathematical boundary is rather easy to calculate. Obviously must that boundary be when it takes more comparisons with AHP than it takes with PGcAHP, i.e. according to the calculations below:
11 0 2 . 2 2 . 0 2 2 . 1 8 . 0 2 ) 1 ( 2 2 = ⇒ = − ⇒ + ≥ − ≥ n n n n n n n PGcAHP AHP 21 0 1 . 2 1 . 0 2 1 . 1 9 . 0 2 ) 1 ( 2 2 = ⇒ = − ⇒ + ≥ − ≥ n n n n n n n PGcAHP AHP
Mathematically it is more suitable to apply PGcAHP, if but only if, the amount of requirements is more than 11 or 21, depending if we believe that the number of very important requirements falls within 80 percent or 90 percent. If the number of requirements is less then 80 percent it is better to use AHP. However, this is purely mathematical. In the real life, we do not know how important the requirements are before we prioritize them against each other. Hence, it is not possible to say if the 80 or 90 percent level is applicable to our problem(s).
4.5.1 How to apply PGcAHP in requirement prioritizing
1. Put all requirement into a heap
2. Take one requirement. Decide in which pile of the three piles that the requirement should be placed in.
3. Repeat 2 until all requirements have been sorted.
4. Structure all requirements from “those without which the system will not function” in a matrix, so that the matrix presents all unique pairs.
5. Compare all the unique pairs in the matrix, with the scale in Table 4-1
6. For the presentation, use Saaty’s idea about priority vector or relative weights for these requirements, i.e. the principal eigenvector.
7. Calculate how consistent the analyst has been in his/her judgment. The consistency indicates how trustworthy the results are and also how much judgment error that the analyst has done in the prioritization.
5
M
ETHOD
This chapter describes the experiment design and how the actual experiment will be conducted. The chapter describes the theory about experimentation and how this theory will be applied into this experiment. There is one part that describes how to operate this experiment, another part describes how the experiment will be executed and the final part describes how to gather the data under the experiment, and finally how the data will be analysed after the experiment has been conducted.
The data that have been collected during the experiment are then analysed in chapter six, according to the theory in this chapter. Section 5.3.1 is a walkthrough in how to analyze statistical data according to [9] [11]. This section also describes all the formulas behind the different analysis methods that are being used in section6.5. In order to understand all the numbers that are presented in section 6.5, it is interesting to know what is behind the numbers and how they have been calculated. Every formula in section 5.3.1 has been extracted from Wolfram Research who developed the software Mathematical, which helps mathematician around the world.
5.1
Design
Wohlin et al [7] describe how to design and run an experiment in software engineering. This experiment is designed based on statistical assumptions that have been made and which objects and subject that are included in the experiment.
The aim of the experiment presented in this thesis is to compare five different prioritization methods to evaluate which one of them seems to be the better i.e. which method that is the fastest, easiest to use, most accurate and is able to scale up when adding more requirements. This is tested by letting the test subjects answer how they experience and believe that each method would be able to fulfill each criterion. The methods that have been chosen for the experiment are (described in chapter 4):
• BST • AHP • PG • 100P • PGcAHP.
BST and AHP have been compared in an evaluation [1] and it should be possible to compare the results of this experiment with that experiment. Karlsson et al [6] suggested in their experiment that it would be interesting to test PGcAHP. Since there does not seem to have been an experiment with this method, it looks like a good idea to have it as the final candidate.
5.1.1 Definition
This experiment analyzes BST, AHP, PG, 100P and PGcAHP. The purpose is to find out which method takes the shortest amount of time in combination to yield the most accurate result and are able to scale up when more requirement are added, from the point of view of prioritizing personnel2 who are going to prioritize the requirements.
5.1.2 Selection of context
In order to minimize the risk that the test subjects remember how they did the last prioritization, you should spread the test over a period of time with fixed intervals
2 Prioritizing personal could be technical, economical and/or somebody that represent the customer,
either by knowledge, behaviors, or any other way that could interesting for the successes for the project.
between the test events. Also it would be best if test subject would be skilled personnel in the prioritization techniques. However, this approach has some drawbacks. It cost a lot of money, it would be difficult to organize and it would consume a lot of resources. Wohlin et al [7] suggest an alternative approach to choose test subjects, and that is to populate the experiment with students with similar knowledge, such as software engineering students. The reasons for this approach are as suggested by Wohlin et al [7]; the experiment will be cheaper to conduct, easier to control, more directed to the specific context of prioritization. Since it is rather difficult to gather test subject for one experiments session, it would be even harder to have five experiments with the same test subject week after week, especially since the participation is voluntary.
This experiment is populated with bachelor and master students, who have education in economics or science of engineering. This group would be a uniform subject group. Even though the subject group’s knowledge could vary a little, this should not affect the experiment because of the background questionnaire (see Appendix III).
To best describe the characteristics of this experiment would be: • Off-line. The experiment is not connected to any real project. • Student. The participants are students (see also 5.1.6).
• Real. The prioritization problems could be applied to other projects.
• General. The result of this experiment may probably be applied to prioritization in other projects.
5.1.3 Hypothesis
The foundation of a statistical analysis is the hypothesis testing. The hypothesis is stated formally and the data should be collected during the experiment. If the hypothesis can be rejected, then it is possible to draw a conclusion that is based on the hypothesis [7].
Normally, two hypotheses are formulated, the null hypothesis (H0) and an alternative
hypothesis (H1).
Null hypothesis: The hypothesis that we want to reject with as high confidence as
possible. An example could be that the test subjects state that all methods give the same accuracy.
Alternative hypothesis: This is the hypothesis that is the opposite of the null hypothesis.
An example would be that the test subjects favor one prioritization method over the other. In this thesis the null hypothesis is that there is no difference between the answer for each method, for example: the test subjects rated each and every method as equally good. The alternative hypothesis is that for at least one method would be different than the other methods, i.e. method b is better than method c.
5.1.4 Variables in the experiment
Before any design of an experiment, it is necessary to choose the dependent and independent variables [7].
Choice of independent variables: The choice of independent variables should be made
onto those variables that could be controlled and changed in the experiment. In the process to choose these variables it is important to determine the measurement scale, the range for the variables and the level for the experiment.
Choice of dependent variables: The dependent variables are derived from the
hypothesis. According to Wohlin et al [7] it is hard to measure them directly, instead there must be an indirect measurement, and this indirect measurement must be carefully validated, since it has a huge effect on the result of the experiment.
This experiment has the following independent variables: • Methods, i.e. which method is being used for prioritization. This experiment has the following dependent variables:
• Time to execute a method. • The results accuracy. • The scalability of the method. • The ease of use of the method.
The independent variables are manipulated, i.e. the test subject has to practice the method, and then answer some question according to the dependent variables that are measured. From those measurements the hypothesis is evaluated and a conclusion should be derived. The dependent variable is measured by the choice that the test subject has done, i.e. the test subject’s subjective opinion about the method, except for time which is measured objectively, more about this in chapter 6.
5.1.5 Objects used in the experiment
During the experiment, the following objects should be used:
• Each test subject should have access to a computer with web-browser installed. • One computer acting as web and SQL server.
5.1.6 Selection of test subjects
To gather a sample from the population of people conducting requirement prioritization or have the potential to work with prioritization, it is first important to determine who should be in this sample. The question that should be answered with a Yes is; is this person representative for the population so that the experiment could be generalized. In this experiment the subjects are people that have an education in software engineering or similar knowledge about prioritization, either through education or professional experience. Wohlin et al [7] give three examples of probability samplings and two non-probability samplings, these are:
Probability samplings:
• Simple random sampling; Subjects are randomly selected from a list of the population.
• Systematic sampling; The first subject is randomly selected from the list, then each n:th subject is chosen from the list.
• Stratified sampling; the population is grouped into strata with a distinct different between each stratum, depending on some variables (for examples: female/male). After each group has been formed, a random sampling is performed within each stratum.
Non-probability samplings:
• Convenience sampling; the most convenient subjects are chosen from the population.
• Quota sampling; the population is first segmented into mutually exclusive sub-groups, just as in stratified sampling. Then judgment is used to select the subjects or units from each segment based on a specified proportion. It is this second step which makes the technique one of non-probability sampling
For this experiment it would have been most interesting to be able to use some probability sampling, so that the result have a higher chance to be more general. However, since it is neither economically nor technically possible to use one of this method in the scope of this thesis, the result has been that it was most convenient to use the convenience sampling for this experiment.
5.1.7 Execution plan
The actual experiment is divided into different phases, those phases are; • Briefing about the experiment
• Pre-experiment questions
• Evaluate the prioritization methods (for each method the following steps will occur):
• Information about the prioritization method
• Prioritize the requirement with the prioritization method. • End questions about the prioritization method
• Final questions about all methods.
Except for the briefing, each and every step is conducted with the help of a computer with an internet connection and a web-browser.
General design principles
According to Wohlin et al [7], randomization is one of the most important design principles, and that the randomization should be applied to the independent variables. In this experiment it means that the order of the prioritization methods is randomized for each test subject, and also the order of the requirements, as described in section 5.1.4, for each prioritization method.
Standard design types
Wohlin et al [7] mention four different design types: • One factor with two treatments
• One factor with more than two treatments • Two factors with two treatments
• More than two factors each with two treatments
This experiment is a ‘One factor with more than two treatments’. The factor is prioritization method while the treatments are AHP, BST, PG, 100P and PGcAHP. The hypothesis for the experiment is described in section 5.1.3.
An example of an analysis method that is suitable for one factor with more than two treatments is the analysis of variance (ANOVA) [7]. This is further described in the section 5.3.
5.1.8 Instrumentation
Objects, guidelines and measurements are the instruments for an experiment [7]. Before an experiment, the instruments are developed for the specific experiment. The objects are described in section 5.1.5. It is important to have guidelines in an experiment, in order for the test subjects to understand how to conduct the experiment, e.g. how does AHP work, and how is it applied in this experiment. The measurements are conducted through data collection by a web/SQL-server. An example from the auto generated html-pages can be found in Appendix III. The purpose with the instrumentation is to plan the experiment and be able to monitor the experiment, without interfering with the outcome. I.e. the outcome of the experiment should be the same regarded of the instrumentation. If this is not the case, the instrumentation has had an impact on the experiment and the result is invalid. For example: If the experiment would be to compare the acceleration of different cars, and the measurements were made by using a stop-watch, then this experiment’s result would not be valid, since the data would depend on the ability of the person that is conducting the experiment to react. However, if the experiment instead is using a test-rig which is connected to a computer, then there is a greater probability that the result would be valid.
5.1.9 Threats to validity
When reading a result from an experiment, one of the most important questions is: How valid is the result? That makes validity of the result an important question to consider when an experiment is designed, according to Wohlin et al [7]. Wohlin et al state that there are four areas of threats that are preferable to overview; conclusion, internal,
construct and external validity.
5.1.9.1 Conclusion validity
Conclusion validity is about the relationship between the treatments and the outcome. It is important that there is a statistically significant relationship between them.
Threat: Low statistical power due to low sample size
Minimize threat: This is a threat that is nearly impossible to remove, since the
experiment is voluntary. However, if requests to attend to the experiment are going to a large population, there is a greater chance that the risk would be minimized.
Threat: Fishing and the error rate.
Minimize threat: Searching or fishing for a result is a major threat for experiment
validity, since that could mean that the researcher has tried to influence the outcome of the experiment. To minimize this threat, the independent variables will be randomized by the server, and the researcher has no possibility to influence the order of neither the method nor the requirements.
Threat: Reliability of measures
Minimize threat: The validity of an experiment is highly dependent on the reliability of
the measures [7]. There is a moment in the experiment where the test subject should conduct a subjective judgment about each method. To minimize this threat the test subjects could only answer on an ordinal scale, except for time which is measure in ratio scale.
5.1.9.2 Internal validity
If the relationship exists between the treatment and the outcome, then we must be sure that it is a causal relationship. It shall not be the result of a factor of which we have no control or have not measured. That means that the treatment should cause the outcome. Internal validity could be divided into three different groups, single group threats,
multiple group threats and social threats. Since this experiment is conducted in a single
group, only single group threats and social threats apply.
Threat: Maturation
Minimize threat: This threat is a problem, since each prioritization method is using the
same requirements, and the test subjects are evaluating method after method in the same occasion. That means that there is a huge risk that a test subjects remembers how he prioritized in the last method. However, since each method starts with a randomization of the order of the requirement, the effect should be minimized. But the best would be if the test could be conducted in five different occasions with a week apart. But even this approach would be somewhat problematic and difficult to realize.
Threat: Instrumentation
Minimize threat: If the experimentation form is badly designed and the wrong
questions are asked to the test subjects, then this threat would have a huge impact on the experiment. A way to minimize the impact of this threat would be to have some other people with experience in prioritizing requirements and experimentation to look over the instrumentation.