Large Listed Firms in Europe:
Impact of legal tradition and ownership structure on
performance
Authors: Per-Olof Bjuggren and Andreas Högberg* Jönköpings International Business School
P.O. box 1026, SE-551 11 Jönköping Telephone: +46 36 101010, Fax: +46 36 121832
E-mail:per-olof.bjuggren@jibs.hj.se
Abstract
This paper investigates the impact of legal tradition and ownership on investment performance in large European listed firms. Europe is of special interest in this sense since the legal systems differs widely. Anglo Saxon, Scandinavian, German as well as French variants of legal systems can be found in representative forms in a concentrated geographical area. It is also interesting as the dispersed ownership pattern discussed and theoretized in much of the corporate governance literature is only common in Anglo Saxon countries. Most countries show a rather concentrated ownership of listed firms. This study differs from earlier studies by concentrating on large listed firms. These are firms in which shareholder protection should be most important for handling typical corporate governance problems. The results show in line with the expectations that performance is lower in these large firms. Somewhat unexpectedly the results also indicate that the Anglo Saxon legal system is no guarantee for good governance and importance. A possible explanation is that shareholder protection changes over time in a fashion that does not always follows legal origin demarcations.
* Fincancial support to Andreas Högberg’s dissertation work from Jan Wallanders and Tom Hedelius Foundation and Tore Browaldhs Foundation via Handelsbanken is gratefully acknowledged.
INTRODUCTION
This paper focus on ownership structures and performance in the 100 largest listed firms in France, Germany, Sweden and Great Britain, based on market capitalization size. The selection of countries is explained by the different legal origins that these four countries represent. The choice to study the 100 largest is motivated by the special corporate governance problems owners are likely to be subjected to in large companies. Dispersed ownership are likely to be more common in these large firms. Hence, legal safeguards as minority protection provided by the legal system is likely to be more important.
Somewhat surprisingly we find that large German and Swedish firms have an investment performance that well matches the firms in Great Britain. This is surprising as a number of studies with no special focus on large firms have shown that in a country like Great Britain, which may be considered as a raw model of common law system, listed firms performs substantially better than in countries with a civil law type of system like Sweden and Germany. French firms are line with earlier studies found to perform worse than firms in Great Britain. The ownership structure differ substantially between the four countries with public ownership most prevalent in France and industrial and bank or financial firm ownership most prevalent in Sweden and Germany. Ownership concentration is also high in France as well as in Germany.
Among the earlier studies the path breaking paper La Porta et al. (1998) find that common-law countries have a stronger protection of legal protection investor rights than civil-law counties. Amongst the civil-law countries they find a difference between French-, German- and Scandinavian-civil-law-countries with those of German and Scandinavian legal traditions having a stronger protection.
La Porta et al. (1999) show in a subsequent paper that, on average, the ownership structure is more dispersed in common law countries than in countries with a legal system of civil law origin. A third paper by La Porta et al (2002) adds to the earlier results by showing that corporate valuation in a country is related to the origin of the legal system. The common law median of Tobin´s q is significantly higher than the civil law median. These three papers indicate a relation between legal origin, ownership structure and
corporate valuation with common law countries having the best performance and the most dispersed ownership structures.
The papers by La Porta et al. have been followed up by a sequence of papers by for example Gugler et al. (2003 and 2004) and Mueller (2006). They use a quite different performance measure than La Porta et al. Instead of Tobin´s q they use a marginal q that shows how corporate investments are valuated by the stock market (for further derivations on marginal q, see Mueller and Reardon (1993)). There are several advantages with such a measure as the marginal q measure. One advantage is that it is directly related to the net present value rule of investments. Hence it is possible to measure if the management is catering to own interests at the expense of investors. Another advantage is that the problem in Tobin´s q of calculating the replacement cost of historical investments is avoided. In addition there are several advantages of econometric nature when estimating and interpreting the marginal q.
Gugler et al (2003 and 2004) and Mueller (2006) find the similar relationships as La Porta et al for legal origin, ownership structure and marginal q valuation. Instead of median values, average marginal q for countries of different legal origin is used. In this study we chose to use marginal q also as a measure of firm performance.
Ownership classification - specifically family ownership
In the paper trade of limits of 10 and 20 per cent ownership share are used for defining a controlling owner. Even though such a definition of controlling owners may seem unproblematic the definition of family ownership poses some problems. Using the Amadeus database, provided by Bureau van Dijk, a definition of the family (or individual) is given for the different types of owners. Among the different types of owners, the Amadeus database defines a family or individual as:
“Besides single private individuals or families, shareholders designated by
more than one named individual or families are in this category. The idea behind this is that they would probably exert their voting power together.”
Basically, families and individuals are identified by the shareholder name. This makes the definition of the family fairly restrictive. For example, a firm which is defined in the database as being owned by an industry may very well be owned by a firm/industry which is defined as a family firm in a pyramidal ownership structure. The definition of family ownership is hence very direct and does not take into account more complex ownership structures. Due to this relatively high restriction of the family firm definition, it is expected that we will observe a relatively to other studies low concentration of family firms in the countries examined. The other types of ownership, such as industrial ownership and bank or financial firm ownership is less restrictive and should show a larger share of the ownership due to the same reasons. Pyramidal ownership is often structure around these types of firms.
Secondly, using the Amadeus definition of the family is only one part of the
identification of family firms. To define a firm as a family firm, it is also necessary to define the influence from the family on the firm. That is, the family must enjoy a certain level of control over the firm. Previous studies (see for example La Porta et. al. 1999, Gugler et al. (2004)) uses a cut off ownership level of 10 and 20 percent for control of the firm. An individual owner holding 20 percent or more of the shares / voting power may be seen as a dominant owner of the firm. Using higher cut off levels of ownership will result in a stricter definition of the family firm and lower cut off in broader definition of family firms. Therefore it may be interesting to compare different levels of restrictions of the family firm definition.
The performance of family firms compared to firms with other types of owners has been studied with dispersed results. One reason for this may be different measures of
performance and on how to define the family firm. Also, even if we find one general definition of the family firms, making comparisons across countries, or even regions, may be misleading. What is accepted and taken for granted as a family in for example Taiwan may be considered as something totally else in Finland. Using data on selected countries in Europe the region is likely to be more homogenous than comparing
at ownership in one country. There is a tradeoff between the homogeneity of firms fitting the definition and the size of the region investigated. The positive side of a heterogeneous dataset is that we may find differences across regions and possible explanations to these differences country wise.
Legal origin and performance
We have not given the discussion on legal origin much attention so far in this paper, however, as mentioned in the introduction, legal origin has been shown to play a significant role in the development and functioning of corporate governance systems around the world. The impact of legal protection of minority shareholders and the
principal agent problems between owners and management is related to the legislations in a country. A strong protection of minority shareholders would suggest that dispersed ownership would be more prevalent than in countries with lower levels of property right protections. La Porta et al. (1998 and 1999) claim that the legal protection of minority shareholders is higher in countries with an Anglo-Saxon legal tradition, or common law, while countries with a civil law system (German, French or Scandinavian legal origin) has lower levels of legal protection. They have constructed an index called antidirector rights that measures how strong the minority protection is in a country. In the index six types of rights are added up. The anitdirector rights consists of rights representing for example shareholder meetings and extra protection of minority shareholders. These laws may differ between countries. Each the rights constituting the anitdirector rights can get a number of zero or one dependent on if the minority is considered protected by the right or not. The maximum score is consequently six.
In Table 1 the scores on antidirector rights are shown for what can be considered the most genuine representatives of the different legal systems i.e. Great Britain, Germany, France and Sweden. Most minority protection is offered by Great Britain and least by Germany with France and Sweden in between. La Porta et al. (1999) study the ownership
indeed more common in the US and Great Britain, while concentrated ownership and also family ownership is more common countries such as Germany, France and Sweden.
Table 1 Antidirector rights in France, Germany, Sweden and Great Britain Great Britain France Germany Sweden
5 3 1 3
Source: La Porta et al. (1998 and 1999)
The effects from different legal traditions have been studied substantially during the last decade. Effects observed both in ownership structures and, consequently, in performance of firms due to legal origin has been studied by for example Mueller (2006). He uses seven different indicators to study the performance of firms in 53 countries. The countries are grouped by their legal origin (English origin, European Germanic origin, Asian Germanic origin, Scandinavian origin and French origin). While the results supports previous studies of the effects from different legal origin, the results also show large in group differences, as noted by Mueller. This suggests that differences in legal origin may explain differences in performance to some extent, but not fully.
The approach used by La Porta et al. (1998 and 1999) in establishing the strength of minority protection in countries with different legal traditions have recently been criticized. The criticism is levied towards the fact that La Porta et al. (1998 and 1999) use a cross-sectional approach. Hence, they do not take into consideration that minority protection in a country can change over time. A study by Fagernäs et al. (2007) takes a look at how shareholder protection changes over time. Instead of six types of rights they work with 60 rights. The time period they consider is 36 years (from 1970 to 2005). Furthermore, they concentrate on four countries (Great Britain, Germany, France and USA). Hence, the choice of countries is almost identical to the ones used in our study. Of special interest is also that they (in a Figure 3) find that minority protection has changed substantially over time. For the time period we are studying (2000-2006) it turns out that Germany has the strongest protection with France at the second place and Great Britain at the third place.
Since we choose to focus only on the largest listed firms in France, Germany, Sweden and UK we should account for some special characteristics concerning size. There are several economists that have argued that there are control losses associated with
increasing firm size. Coase (1937) writes about increasing internal transaction costs that puts a limit to vertical integration. More recently Oliver E. Williamson (1975 and 1986 and 1996) has addressed the problem of firm size and control loss. He shows of the firm through change of organizational structure to some extent can facilitate the coordination task of top management.
But with increasing firm size and in most cases an associated increase in the number of shareholders the corporate governance task also become more complicated. According to Jensen and Meckling (1976) firm managers are likely have incentives enriching
themselves also through other ways than simply increasing their salary. Buying corporate jets and having a fancy office may be other ways for the management to improve their self benefit and personal wealth. Such investments does however rarely benefit the shareholders and should be considered as managerial discretion. Another way of increasing the personal wealth for the managers on the behalf of investors is to increase the number of employees and hence their own position in the corporate hierarchy. The larger the firm, the larger the possibilities for such activities. It can be predicted that we will find higher levels of managerial discretion in relatively large firms, and hence also a lower results in the performance measures due to the ineffectiveness of investment decisions that are made by the management. Hence, the shareholder protection offered by the legal framework of a country have a special important role for corporate governance in large firms.
Measure of performance
In this paper we chose to evaluate the performance of the firm using the Marginal q method suggested by Mueller and Reardon (1993). The results from estimating a marginal q for a firm has the attractive property of being both fairly intuitive and easy analyse. Also, compared to a Tobin’s q, it considers the marginal market valuation of a
firm’s marginal investment rather than the ratio between market value and book value for the firm.
Marginal q is directly linked to the Net Present Value (NPV) rule in corporate finance, which generally assumes that at project with a positive net present value should always be carried through. A management that only has the collective interest of the shareholder’s objective will undertake all investment that promise a positive net present value and the last investment decided cannot have a lower net present value than zero (i.e. NPV≥0). On the other hand, a management that caters to other objectives than those of the shareholders as a group will be prepared to choose projects with a negative NPV. Using the marginal q method, a negative NPV will result in a value of marginal q less than 1. A marginal q less than 1 imply that returns on investments are lower than their cost of capital.
Marginal q will be considered for investments in both tangible and intangible assets. Following Mueller and Reardon (1993) and Gugler et al (2003 and 2004), investments in each time period are compounded by:
I = After tax profits + Depreciation – Dividends + ∆Debt + ∆Equity + R&D + ADV
(1)
where ∆D and ∆E are funds raised using new debt and equity issues and ADV is
advertising expenditures.
Using the aggregated investment variable, the model used for estimating the marginal q is denoted qm in the following equation:
1 , 1 , 1 , 1 , − − − − + + − = − t i t t i it m t i t i it M M I q M M M ε δ (2)
where, M is the market value of a firm i in period t and it εitis the error term with the
assumed usual econometric characteristics. Using the general equation for estimating a marginal q, we can add variables to the model controlling for other effects affecting the change in market value over time. In this case, it allows us to control for differences in performance depending on ownership type.
Data sources and limitations
The ownership data is provided by Bureu van Dijk’s Amadeus database which contains data on a substantial share of the firms in Europe. The dataset extracted from the Amadeus database contains information on the 100 largest listed firms, based on their market capitalization in 2007, for France, Germany, Sweden and Great Britain. We include information on ownership type, name of the owner and the size of total
ownership for the largest owner in the dataset. We do not have access to ownership data over time so all information is given as last observed, i.e. in 2007. This may cause troubles with consistency since the performance measure is done over time. However, ownership has been suggested to be fairly stable over time in most cases without any major fluctuations (La Porta et. al. 1999).
The different types of ownership defined by Amadeus other than the family firm type of ownership are divided into four groups. These types of ownership are: industrial firms, family firms or individuals, financial firms and banks, government or public owned and lastly ownership that is not applicable to any of the four types of ownership, namely other or unidentified owners. If the largest owner holds less than 10 or 20 percent of the shares the ownership is regarded as dispersed ownership disregarding any definition of the owner made in the database. The definition of each type of owner is presented in the appendix.
The financial data used for estimating the marginal q is provided by Standard and Poor’s COMPUSTAT Global database for the years 1999 to 2006. Due to differences in
are not included in the dataset of firms. This is in accordance with earlier research (Gugler et. al. 2002). Yet, financial companies may still be found as owners of firms in our dataset. Furthermore, since Standard and Poor does not provide advertising
expenditures explicitly in COMPUSTAT Global, we are, in accordance to Bjuggren et. al. (2007), using a wider definition than Mueller and Reardon (1993). The wider definition includes “general selling expenses” used as a proxy for the advertising expenditures.
In the dataset, a number of firms are missing information on one or more financial statements. Firms with less than three consecutive years of market value information are removed from the dataset to maintain consistency in the dataset. The resulting dataset contains information on 379 firms in France, Germany, Sweden and Great Britain. The variables included in the models tested in this paper are summarized in table A1 in the appendix.
Descriptive statistics
The firms used in this study are chosen for their size in terms of market capitalization. Table 2 presents the descriptive statistics for two size indicators of the firms, namely market capitalization and number of employees reported. The number of employees reported in the annual reports differs both between firms and during the years, hence number of observations are lost. Using market capitalization as a measure of size, in this case for the year 2006, is a somewhat more stable measure. It also gives us the possibility to compare the size of the stock market and largest firms in the four countries. The original 100 largest firms selected from France, Germany, Sweden and Great Britain’s stock exchange minus the handful of firms that we miss significant financial data on constitutes between 70 and almost 80 percent of each country’s total stock exchange market capitalization.
Table 2 Firm size in market capitalization and employees
Country Firm size measure Obs. Min. Max. Mean Std. Dev. Share of market cap. France Market capitalization
2006 thousands of € 95 1 424 120 146 338 557 13 393 003.2 24 193 826.7 71.5 % Germany Market capitalization
2006 thousands of € 90 771 142 98 716 000 9 339 467.9 16 938 029.8 78.8 % Sweden Market capitalization
2006 thousands of € 97 167 988 28 509 317.6 2 229 454.7 4 791 248.9 72.3 % Great Britain Market capitalization 2006 thousands of € 97 2 223 853 155 681 346 15 517 399.2 26 786 691.4 71.2 %
The information on the largest and smallest firm in terms of market capitalization in each country also gives us an indication of what the performance measures may look like for each country. If the suggestion that relatively large firms should have lower performance due to higher levels of managerial discretions is true we should see the largest effects in Great Britain and France and smallest in Sweden. On the other hand, the legal origin and minority protection of shareholders should also have effects on the performance measure and hence lessen the negative effects on performance in Great Britain compared to France according to La Porta et al. (1999).
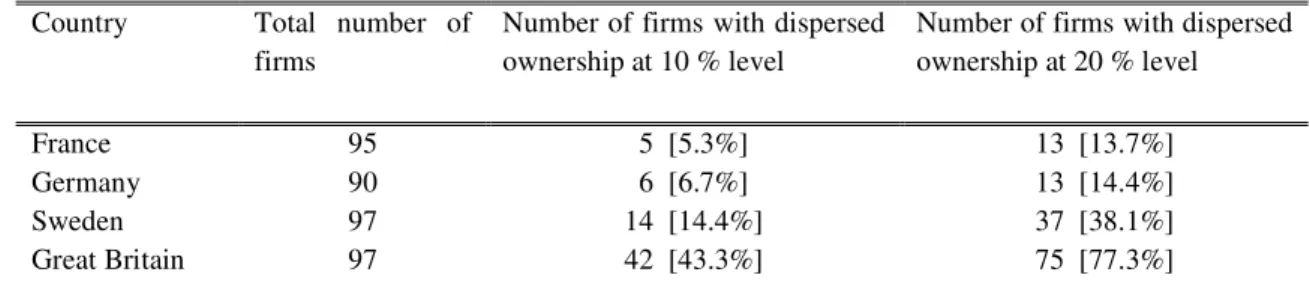
The ownership statistics gives an informative picture of the concentration of ownership in each country and also the type of controlling ownership which is the most and least common in each of the four countries. These distributions of ownership of the largest listed firms in France, Germany, Sweden and Great Britain is given in table 3 and 4.
Table 3 Ownership concentration in France, Germany, Sweden and Great Britain Country Total number of
firms
Number of firms with dispersed ownership at 10 % level
Number of firms with dispersed ownership at 20 % level
France 95 5 [5.3%] 13 [13.7%]
Germany 90 6 [6.7%] 13 [14.4%]
Sweden 97 14 [14.4%] 37 [38.1%]
Great Britain 97 42 [43.3%] 75 [77.3%]
Much in line with previous research and suggestions the concentration of ownership is highest in France and Germany, while somewhat lower in Sweden. Great Britain has by
far the most dispersed ownership structures for the largest listed firms in the country, as suggested as early as 1932 by Berle and Means. This may also be a reflection of the differences in minority shareholder protection and the effects the protection has on the concentration of ownership. As mentioned, La Porta et al. (1999) suggests that French and German legal systems offers the lowest protection of minority shareholders, Scandinavian a somewhat higher and Anglo Saxon the highest protection of shareholders out results are consistent with such assumptions and the presumed levels of concentrated ownership.
It is also interesting to note how the concentration of ownership decrease at different pace for the four countries. This may be a result of the legal system, but also a reflection of control enhancing tools that are used in for example Sweden. These control enhancing tools are most often dual class shares which allows shareowners to exercise control of a firm with relatively few shares (see for example La Porta et al. 1999) .
The division of the controlling owners at a 10 percent and 20 percent levels depending on their classification is presented in table 3 and 4 respectively. The tables shows consistent results, suggesting that the division of ownership between the different types of owners does not change substantially between the 10 and 20 percent cut off for controlling ownership.
Table 4 Concentrated ownership and type of owner at 10 and 20 percent cut off Country Cut off
level Industrial firm ownership Family or individual ownership Financial firm or bank ownership Government or public ownership Other, unknown type of ownership Total number of firms France 10 % 23 [25.6%] 6 [6.7%] 22 [24.4%] 33 [36.7%] 6 [6.7%] 90 [94.7%] 20 % 22 [26.8%] 6 [7.3%] 16 [19.5%] 32 [39%] 6 [7.3%] 82 [86.3%] Germany 10 % 32 [38.1%] 13 [15.5%] 14 [16.7%] 21 [25.0%] 4 [4.8%] 84 [93.3%] 20 % 29 [37.7%] 11 [14.3%] 12 [15.6%] 21 [27.3%] 4 [5.2%] 77 [85.6%] Sweden 10 % 21 [25.3%] 14 [16.9%] 33 [39.8%] 5 [6.0%] 10 [12.0%] 83 [85.6%] 20 % 18 [30.0%] 7 [11.7%] 21 [35.0%] 5 [8.3%] 9 [15.0%] 60 [61.9%] Great Britain 10 % 10 [18.2%] 7 [12.7%] 38 [69.1%] 0 [0%] 0 [0%] 55 [56.7%] 20 % 6 [27.3%] 5 [22.7%] 11 [50.0%] 0 [0%] 0 [0%] 22 [22.7%]
The distribution between the different types of ownership shows clearly that due to a much higher level of dispersed ownership in Great Britain the number of owners classified as Government and unknown is zero. Corresponding figures for industrial, family and financial ownership is also low compared to the other three countries which have higher concentration of ownership. It is also interesting to note in the case of Great Britain how the number of controlling owners decrease especially for financial owners but also industrial owners when we increase the control cut off to 20 percent share ownership. The other countries does not experience the same drop with a small exception of Sweden and family ownership which is halved when the control cut off is increased to 20 percent.
We also note that for France, government ownership os the most common classification of an owner, while in Germany industrial ownership is most common. Both in Sweden and in Great Britain, the most common controlling ownership type ins this dataset is financial firms or banks. None of the countries have very high shares of family ownership. This may be explained mainly by two reasons: i) the firms are the largest listed firms in each of the countries and family ownership generally tends to be less common in the largest firms, and ii) the definition we use is very restrictive and based on the Bureau van Dijk definition. It does not consider pyramidal ownership or crossholdings, only direct ownership. It is therefore likely that the ownership data is partially skewed and that the figures for family ownership is somewhat lower than they should be, while industrial and financial ownership types probably is estimated a bit to high.
Measuring firm performance
We estimate the marginal q and the effects of ownership with an integrated dummy as illustrated in the model below.
1 , 1 , 1 , 1 , − − − − + + − = − t i it O t i it m t i t i it M I D M I q M M M δ (3)
The performance estimate represented by the marginal q for non family owned firms are included in the qm variable. Performance for firms with different types of owners is
represented by the estimated qm plus the estimated dummy coefficient. The dummy for
each type ownership is interacted with the investment over market value variable for enhancement of owner specific effects.
The top and bottom percentile is excluded from the dataset due to the existence of some extreme outliers most likely resulting from errors in the reported data. The remaining full dataset contains 350 firms and a total of 2 074 observations ranging from the years 2000 to 2006 (1999 is lost due to the estimation method of calculating changes in market values and investments).
The results from the marginal q estimates show some interesting characteristics in the performance of the largest listed firms in all four countries in the study. The marginal q (qm) is presented for each country in table 5 as well as the results from a previous study
by Gugler et al (2004) that includes all listed firms (small to large). Estimates of marginal for all different ownership categories are presented in the appendix, table A4-A11.
Table 5 Estimates of marginal q Large listed firms,
2000-2006 Gugler et al (2004) Data period 1985-2000 Country Marginal q Number of firms Marginal q Number of firms UK 0.46 97 0.85] 1331 France 0.40 89 0.57 495 Germany 0.52 82 0.57 425 Sweden 0.46 82 0.65 156
There are two important pieces of information in table 5: i) the ranking of performance is different in our study compared to Gugler et al (2004) and ii) marginal q is lower for large firms in the countries compared to Mueller (2006). Interesting from the perspective of the legal origin debate is the change in performance ranking between the two studies. Large German firms are performing better than the firms in Great Britain. This is also
true for Sweden, however, the difference between Sweden and Great Britain is negligible. Firms in France are showing the lowest levels in the performance measure. The fact that Germany shows the best performance in terms of marginal q is in line with the findings of Fagernäs et al (2007) that minority protection changes over time. They found that since the new millennium Germany actually has a stronger minority protection than Great Britain. According to them the cross-section approach used by La Porta et al (1998 and 1999) runs the risk of being obsolete over time.
The lower marginal q could be interpreted as a sign of weaker corporate governance in large firms. This is what can be expected with a larger number of shareholders and a more complex governance task. Hence, the relatively low performance estimates may not actually be that surprisingly low. In the study made by Gugler et al (2004) they found somewhat higher estimates. The dataset used in their study includes a larger number of firms. A lower marginal q estimate in this study, which focus on the largest firms, could thus be a support for the assumptions that there is more room for managerial discretion in the largest firms and hence less efficiency in the investments. This should be reflected in lower performance, in this case a lower marginal q.
Some types of ownership show significant results (appendix A4-A11). It is interesting to note that firms owned by other industries are generally much worse performers in France and much better in Great Britain. On the other hand, firms owned by financial firms or banks are showing worse performance in Great Britain, and again, in France, while being better performers in Sweden and Germany. Also, it is only France that shows that government ownership has a positive effect on performance.
Concluding remarks
The results from our study suggest that the static concept of legal origin might have some deficiencies as explanation why performance differs between countries. Minority protection is likely to change over time. The Anglo Saxon tradition is no guarantee for best shareholder protection. Our analysis of investment performance in the prime country
candidates for the four different legal origins shows a result that does not match previous studies. We find a lower performance and a change in performance ranking. That the performance is relatively low in all four countries studied can be explained by the fact that we only study the largest firms which may have lower performance due to higher possibilities of managerial discretion. That the performance ranking is different can be explained by the fact that shareholders protection changes over time. From this perspective the results are interesting and should be expanded to include whole European Union and more instruments controlling for firms size for more comprehensive results.
References
Anderson, R.C and Reeb, D.M (2003). “Founding-Family Ownership and Firm Performance: Evidence from the S&P 500”. Journal of Finance. 58:1301-1328.
Astrachan, J. and Shanker, C., (2003) Family Businesses’ Contribution to the U.S. Economy: A Closer Look. Family Business Review, vol. XVI, no. 3, September 2003 Astrachan, J., Klein, S.B. and Smyrnios, K.X., (2002) The F-PEC Scale of Family Influence: A Proposal for Solving the Family Business Definition Problem. Family Business Review, vol. XV, no. 1, March 2002
Barth, E., Gulbrandsen, T. and Schone, P., (2004) Family ownership and productivity: the role of owner-management. Journal of Corporate Finance
Berle, A. and Means, G., (1932), The Modern Corporation and Private Property, New York: Macmillan.
Bjuggren, P-O., Dzansi, J., and Palmberg, J., (2007) “Investment Performance of
Swedish Listed Family Firms”, working paper, Jönköping International Business School Barth, E., Gulbrandsen, T. and Schone, P., (2004) Family ownership and productivity: the role of owner-management. Journal of Corporate Finance
Bru, L. and Crespí, R., (2006??) Board Governance of Family Firms and Business Groups With a Unique Regional Dataset
Burkart, M., Panunzi, F. and Shleifer, A., (2003), “Family Firms” Journal of Finance, 58::2167-2201.
Claessens, S., Djankov, S., and Lang, L. H.P., (2000), “The Separation of Ownership and Control in East Asian Corporations”, Journal of Financial Economics, 58:81-112.
Coase, R.H., (1937), “The Nature of the Firm”, Economica 4:386-405
Faccio, M. and Lang, H.P.L., (2002), “The Ultimate Ownership of Western European Corporations”, Journal of Financial Economics, 65:365-395.
Fagernäs, S., Sarkar, P. and Singh, A., (2007) Legal Origin, Shareholder Protection and the Stock Market: New Challenges from Time Series Analysis” CBR, University of Cambridge, WP No.343
Gugler, K. and Yurtoglu, B. B., (2003), “Average q, marginal q, and the relation between ownership and performance”, Economic Letters, 78, 379-384.
Gugler, K., Mueller, D. C. and Yurtoglu, B. B., (2004), “Corporate Governance and the Returns on Investment,” Journal of Law and Economics, 47:589-633.
Gugler, K., Mueller, D. C., and Yurtuglo, B. B., (2002), “Separating the Wealth and Entrenchment Effects of Insider Ownership on Investment Performance”, University of Vienna, Department of Economics.
Jensen, M.C. and Meckling, W.H., (1976), “ Theory of the Firm: Managerial Behavior, Agency Costs and Ownership Structure.” Journal of Financial Economics, 3:305-60. La Porta, R., Lopez-De-Silanes, F., Shleifer, A and Vishny, R.. (2000), ”Investor Protection and Corporate Governance”, Journal of Financial Economics, 58:3-27.
La Porta, R., Lopez-De-Silanes, F. and Shleifer, A. (1999) “Corporate Ownership Around the World”. Journal of Finance. 54: 471-517
La Porta, R., Lopez-De-Silanes, F., Shleifer, A and Vishny, R.. (1997),”Legal Determinants of External Finance”, Journal of Finance, 52:1131-1150..
La Porta, R., Lopez-De-Silanes, F., Shleifer, A and Vishny, R.. (1998),”Law and Finance”, The Journal of Political Economy, 106:1131-1150..
La Porta, R., Lopez-De-Silanes, F., Shleifer, A and Vishny, R.. (2002),”Investor Protection and Corporate Valuation”, Journal of Finance, 62:1147-1170.
Morck, R., Stangeland, D. and Yeung, B., (200), “Inherited Wealth, Corporate Control, and Economic Growth: The Canadian Disease,” in Concentrated Corporate Ownership, R. Morck (ed.), Chicago: University of Chicago Press.
Mueller, D. C., (2003) The Corporation – Investment, mergers and growth, Routledge studies in business organizations and networks
Mueller, D. C., Reardon, E. A., (1993) “Rates of Return on Corporate Investment”,
Southern Economic Journal, Vol. (60), No. 2, pp 430-453
Mueller, D.C., (2006), “The Anglo-Saxon Approach to Corporate Governance and its Application to Emerging Markets”, Corporate Governance, 14:207-219.
Sharma, P., (2003) Stakeholder Mapping Technique: Toward the Development of a Family Firm Typology. Proceedings of 12th Annual Conference of International Association of Business and Society (pp. 254 – 259)
Sharma, P., (2004) An Overview of the Field of Family Business Studies: Current Status and Directions for the Future. Family Business Review, vol. XVII, no. 1. March 2004 Shleifer, A. and Vishny, R.W., (1996), “A Survey of Corporate Governance,” NBER, Working Paper 5554.
Villalonga, B. and Amit, R., (2004) How Do Family Ownership, Management, and Control Affect Firm Value?
Williamson, O. E. (1975) Markets and Hierarchies: Analysis and Antitrust Implications. New York: Free Press.
Williamson, O. E. (1985) The Economic Institutions of Capitalism. New York: Free Press.
Williamson, O. E. (1993) Managerial Discretion and Business Behavior. The American Economic Review, Vol. 53, No. 5 (Dec., 1963), pp. 1032-1057
Appendix
Table A1 Aggregated types of ownership
Ownership type Sub type of owners included Definition given by the Bureu van Dijk database Amadeus
Financial owner Banks -
Financial company -
Insurance company -
Private equity firm -
Family owner Family / Individual Besides single private individuals or families, shareholders designated by more than one named individual or families are in this category. The idea behind this is that they would probably exert their voting power together.
Industrial owner Industries This is a generic term; this category includes all companies that are not banks or financial companies nor insurance companies. They can be involved in manufacturing activities but also in trading activities (wholesalers, retailers, brokers, etc.). They include also companies active in B2B or B2C non-financial services.
Other type of owner Employees/Managers This category raises a delicate issue. It could be considered as a collectively designated category, unable to jointly exert a power of control (just as the "public" in the case of the publicly listed companies). It could also be considered as syndicated and jointly exerting its voting power. This is this last hypothesis that has been considered by BvDEP. This means that this category can be considered to be the Ultimate Owner of a given company (which is not the case for the categories "public" or for "Unnamed private
shareholders, aggregated") Foundation/research institute -
Other unnamed shareholders, aggregated
This category includes more than one unnamed shareholder, either companies (unnamed) or a mixture of companies and private owners.
Self-owned -
Unnamed private shareholders, aggregated
This category includes entries indicating that there are more than one private shareholders, collectively designated. This includes entries like:
State/public owner Public authorities, States, Governments
This category includes states, governmental agencies, governmental departments, or local authorities
Public Public is used only for publicly quoted companies.
Table A2 Description of included variables
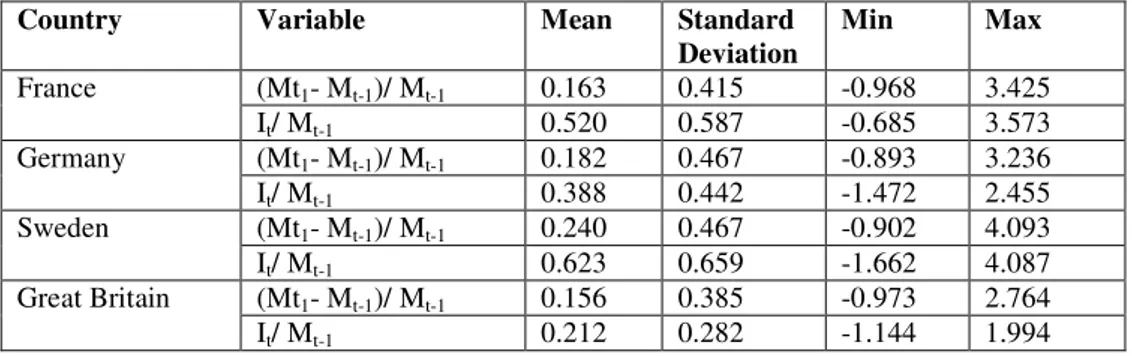
Table A3 Descriptive statistics for market value change and investment over market value for each country
Variable Description
It Investment in period t. Defined as:
I= After tax profit + Depreciation – Dividends + ∆Debt + ∆Equity + R&D + General selling expenses
(Mt1- Mt-1)/ Mt-1 Change in market value
It/ Mt-1 Investment ratio
Industrial owner * ( It/ Mt-1)
A controlling owner is defined as a industrial owner if the largest owner is a industry that has direct control over at least 10/20 percent of the outstanding shares. The variable is expressed as a dummy, which equals 1 if the owner is defined as a industry.
Family owner * ( It/ Mt-1)
A controlling owner is defined as a family owner if the largest owner is a family or an individual that has direct control over at least 10/20 percent of the outstanding shares. The variable is expressed as a dummy, which equals 1 if the owner is defined as a family.
Financial owner * ( It/ Mt-1)
A controlling owner is defined as a financial owner if the largest owner is a financial firm or bank that has direct control over at least 10/20 percent of the outstanding shares. The variable is expressed as a dummy, which equals 1 if the owner is defined as a financial owner. Government
owner * ( It/ Mt-1)
A controlling owner is defined as a government owner if the largest owner is a government or public that has direct control over at least 10/20 percent of the outstanding shares. The variable is expressed as a dummy, which equals 1 if the owner is defined as a government. Other owner *
( It/ Mt-1)
A controlling owner is defined as other owner if the largest owner is a unknown or other that has direct control over at least 10/20 percent of the outstanding shares. The variable is expressed as a dummy, which equals 1 if the owner is defined as another type of owner.
Country Variable Mean Standard Deviation Min Max France (Mt1- Mt-1)/ Mt-1 0.163 0.415 -0.968 3.425 It/ Mt-1 0.520 0.587 -0.685 3.573 Germany (Mt1- Mt-1)/ Mt-1 0.182 0.467 -0.893 3.236 It/ Mt-1 0.388 0.442 -1.472 2.455 Sweden (Mt1- Mt-1)/ Mt-1 0.240 0.467 -0.902 4.093 It/ Mt-1 0.623 0.659 -1.662 4.087 Great Britain (Mt1- Mt-1)/ Mt-1 0.156 0.385 -0.973 2.764 It/ Mt-1 0.212 0.282 -1.144 1.994
Marginal q estimates
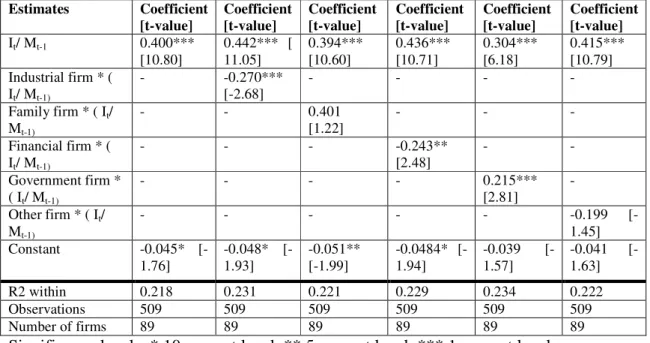
Table A4 France, 10 percent cut off
Significance levels: * 10 percent level, ** 5 percent level, *** 1 percent level
Table A5 France, 20 percent cut off
Significance levels: * 10 percent level, ** 5 percent level, *** 1 percent level
Estimates Coefficient [t-value] Coefficient [t-value] Coefficient [t-value] Coefficient [t-value] Coefficient [t-value] Coefficient [t-value] It/ Mt-1 0.400*** [10.80] 0.434*** [10.38] 0.394*** [10.60] 0.436*** [10.71] 0.306*** [6.16] 0.415*** [10.79] Industrial firm * ( It/ Mt-1) - -0.156* [-1.76] - - - - Family firm * ( It/ Mt-1) - - 0.401 [1.22] - - - Financial firm * ( It/ Mt-1) - - - -0.201** [2.11] - - Government firm * ( It/ Mt-1) - - - - 0.207*** [2.81] - Other firm * ( It/ Mt-1) - - - -0.199 [-1.45] Constant -0.045* [-1.76] -0.048* [-1.93] -0.051** [-1.99] -0.0402* [-1.66] -0.039 [-1.57] -0.041 [-1.63] R2 within 0.218 0.224 0.221 0.226 0.232 0.222 Observations 509 509 509 509 509 509 Number of firms 89 89 89 89 89 89 Estimates Coefficient [t-value] Coefficient [t-value] Coefficient [t-value] Coefficient [t-value] Coefficient [t-value] Coefficient [t-value] It/ Mt-1 0.400*** [10.80] 0.442*** [ 11.05] 0.394*** [10.60] 0.436*** [10.71] 0.304*** [6.18] 0.415*** [10.79] Industrial firm * ( It/ Mt-1) - -0.270*** [-2.68] - - - - Family firm * ( It/ Mt-1) - - 0.401 [1.22] - - - Financial firm * ( It/ Mt-1) - - - -0.243** [2.48] - - Government firm * ( It/ Mt-1) - - - - 0.215*** [2.81] - Other firm * ( It/ Mt-1) - - - -0.199 [-1.45] Constant -0.045* [-1.76] -0.048* [-1.93] -0.051** [-1.99] -0.0484* [-1.94] -0.039 [-1.57] -0.041 [-1.63] R2 within 0.218 0.231 0.221 0.229 0.234 0.222 Observations 509 509 509 509 509 509 Number of firms 89 89 89 89 89 89
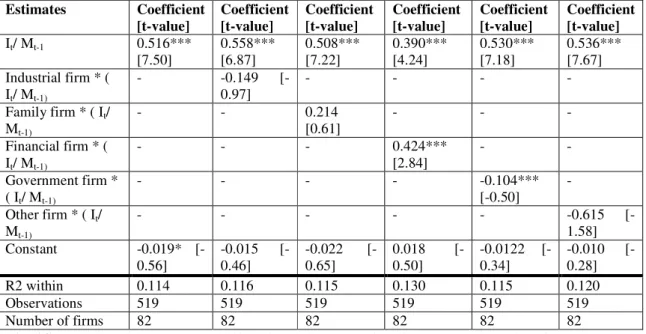
Table A6 Germany 10 percent cut off
Significance levels: * 10 percent level, ** 5 percent level, *** 1 percent level
Table A7 Germany 20 percent cut off
Significance levels: * 10 percent level, ** 5 percent level, *** 1 percent level
Estimates Coefficient [t-value] Coefficient [t-value] Coefficient [t-value] Coefficient [t-value] Coefficient [t-value] Coefficient [t-value] It/ Mt-1 0.516*** [7.50] 0.563*** [6.91] 0.511*** [7.23] 0.370*** [4.25] 0.530*** [7.18] 0.534*** [7.67] Industrial firm * ( It/ Mt-1) - -0.164 [-1.07] - - - - Family firm * ( It/ Mt-1) - - 0.110 [0.34] - - - Financial firm * ( It/ Mt-1) - - - 0.382*** [2.72] - - Government firm * ( It/ Mt-1) - - - - -0.104 [-0.50] - Other firm * ( It/ Mt-1) - - - -0.615 [-1.58] Constant -0.019* [-0.56] -0.015 [-0.44] -0.021 [-0.62] 0.0203 [-1.66] -0.0122 [-0.34] -0.010 [-0.28] R2 within 0.114 0.117 0.114 0.130 0.130 0.120 Observations 519 519 519 519 519 519 Number of firms 82 82 82 82 82 82 Estimates Coefficient [t-value] Coefficient [t-value] Coefficient [t-value] Coefficient [t-value] Coefficient [t-value] Coefficient [t-value] It/ Mt-1 0.516*** [7.50] 0.558*** [6.87] 0.508*** [7.22] 0.390*** [4.24] 0.530*** [7.18] 0.536*** [7.67] Industrial firm * ( It/ Mt-1) - -0.149 [-0.97] - - - - Family firm * ( It/ Mt-1) - - 0.214 [0.61] - - - Financial firm * ( It/ Mt-1) - - - 0.424*** [2.84] - - Government firm * ( It/ Mt-1) - - - - -0.104*** [-0.50] - Other firm * ( It/ Mt-1) - - - -0.615 [-1.58] Constant -0.019* [-0.56] -0.015 [-0.46] -0.022 [-0.65] 0.018 [-0.50] -0.0122 [-0.34] -0.010 [-0.28] R2 within 0.114 0.116 0.115 0.130 0.115 0.120 Observations 519 519 519 519 519 519 Number of firms 82 82 82 82 82 82
Table A8 Sweden 10 percent cut off
Significance levels: * 10 percent level, ** 5 percent level, *** 1 percent level
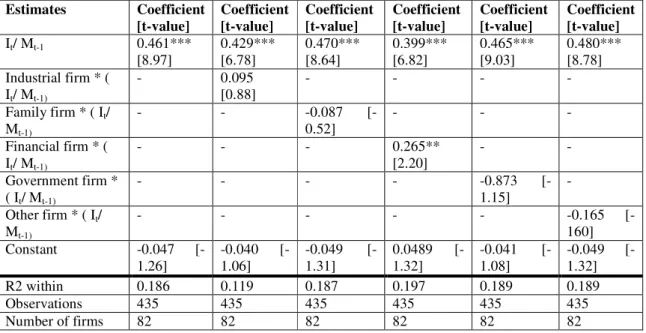
Table A9 Sweden 20 percent cut off
Significance levels: * 10 percent level, ** 5 percent level, *** 1 percent level
Estimates Coefficient [t-value] Coefficient [t-value] Coefficient [t-value] Coefficient [t-value] Coefficient [t-value] Coefficient [t-value] It/ Mt-1 0.461*** [8.97] 0.446*** [6.87] 0.488*** [7.22] 0.404*** [6.43] 0.530*** [7.18] 0.479*** [8.75] Industrial firm * ( It/ Mt-1) - 0.041 [0.38] - - - - Family firm * ( It/ Mt-1) - - -0.198 [-1.32] - - - Financial firm * ( It/ Mt-1) - - - 0.172 [-1.58] - - Government firm * ( It/ Mt-1) - - - - -0.873 [-1.15] - Other firm * ( It/ Mt-1) - - - -0.153 [-0.97] Constant -0.047 [-1.26] -0.045 [-1.18] -0.047 [-1.25] -0.057 [-1.50] -0.041 [-1.08] -0.049 [-1.31] R2 within 0.186 0.119 0.190 0.189 0.189 0.188 Observations 435 435 435 435 435 435 Number of firms 82 82 82 82 82 82 Estimates Coefficient [t-value] Coefficient [t-value] Coefficient [t-value] Coefficient [t-value] Coefficient [t-value] Coefficient [t-value] It/ Mt-1 0.461*** [8.97] 0.429*** [6.78] 0.470*** [8.64] 0.399*** [6.82] 0.465*** [9.03] 0.480*** [8.78] Industrial firm * ( It/ Mt-1) - 0.095 [0.88] - - - - Family firm * ( It/ Mt-1) - - -0.087 [-0.52] - - - Financial firm * ( It/ Mt-1) - - - 0.265** [2.20] - - Government firm * ( It/ Mt-1) - - - - -0.873 [-1.15] - Other firm * ( It/ Mt-1) - - - -0.165 [-160] Constant -0.047 [-1.26] -0.040 [-1.06] -0.049 [-1.31] 0.0489 [-1.32] -0.041 [-1.08] -0.049 [-1.32] R2 within 0.186 0.119 0.187 0.197 0.189 0.189 Observations 435 435 435 435 435 435 Number of firms 82 82 82 82 82 82
Table A10 Great Britain 10 percent cut off
Significance levels: * 10 percent level, ** 5 percent level, *** 1 percent level
Table A11 Great Britain 20 percent cut off
Significance levels: * 10 percent level, ** 5 percent level, *** 1 percent level
Estimates Coefficient [t-value] Coefficient [t-value] Coefficient [t-value] Coefficient [t-value] Coefficient [t-value] Coefficient [t-value] It/ Mt-1 0.463*** [7.89] 0.405*** [6.60] 0.484*** [8.03] 0.605*** [6.63] - - Industrial firm * ( It/ Mt-1) - 0.591*** [3.03] - - - - Family firm * ( It/ Mt-1) - - -0.378 [-1.48] - - - Financial firm * ( It/ Mt-1) - - - -0.242** [2.03] - - Government firm * ( It/ Mt-1) - - - - Other firm * ( It/ Mt-1) - - - - Constant 0.057*** [3.06] 0.057*** [3.05] 0.057 [3.05] 0.0478 [2.46] - - R2 within 0.108 0.124 0.112 0.116 - - Observations 611 611 611 611 - - Number of firms 97 97 97 97 - - Estimates Coefficient [t-value] Coefficient [t-value] Coefficient [t-value] Coefficient [t-value] Coefficient [t-value] Coefficient [t-value] It/ Mt-1 0.463*** [7.89] 0.405*** [6.60] 0.484*** [8.03] 0.605*** [6.63] - - Industrial firm * ( It/ Mt-1) - 0.591*** [3.03] - - - - Family firm * ( It/ Mt-1) - - -0.378 [-1.48] - - - Financial firm * ( It/ Mt-1) - - - -0.242** [2.03] - - Government firm * ( It/ Mt-1) - - - - Other firm * ( It/ Mt-1) - - - - Constant 0.057*** [3.06] 0.057*** [3.05] 0.057 [3.05] 0.0478 [2.46] - - R2 within 0.108 0.124 0.112 0.116 - - Observations 611 611 611 611 - - Number of firms 97 97 97 97 - -