UPTEC STS14 024
Examensarbete 30 hp
Augusti 2014
Investigation of a method to
extend the use of output data
from Scania´s Hardware-In-the-Loop
simulations
Development of database and search algorithm
Saman Akbarian Tari
Therése Svensson
Teknisk- naturvetenskaplig fakultet UTH-enheten Besöksadress: Ångströmlaboratoriet Lägerhyddsvägen 1 Hus 4, Plan 0 Postadress: Box 536 751 21 Uppsala Telefon: 018 – 471 30 03 Telefax: 018 – 471 30 00 Hemsida: http://www.teknat.uu.se/student
Abstract
Investigation of a method to extend the use of output
data from Scania’s Hardware-In-the-Loop simulations:
Development of database and search algorithm
Saman Akbarian Tari , Therése Svensson
In the automotive industry, Hardware-In-the-Loop (HIL) laboratories are used for testing vehicle functions and systems.
Swedish heavy truck manufacturer Scania recently upgraded its HIL lab resulting in an opportunity to save all data generated by simulations in the HIL lab for post analysis. Thus, Scania wished to investigate the possibility to extend the use of output data by examining a new test method. The new test method was intended to be used for disclosing a type of error that had not been possible to detect prior to the upgraded HIL lab.
The proposed test method was to store tests in a database and to run the tests upon output data generated in the HIL lab. The tests which were to be stored in the database existed as scripts written in the programming language Python. In order to insert tests into the database the data had to be extracted from the Python test scripts.
The investigation showed the database test method to be feasible in small scale for some test scripts but the results also indicated weaknesses with the method’s setup. Insertion of data, extracted from test scripts, into a relational database showed to be problematic as the data was highly heterogeneous and did not fit easily into relational tables. For future
implementations it is suggested that the method incorporates other information sources complementing the test scripts.
ISSN: 1650-8319, UPTEC STS14 024 Examinator: Elísabeth Andrésdóttir Ämnesgranskare: Matteo Magnani Handledare: Samuel Malinen
Table of Contents
Glossary ... 3
1. Introduction ... 4
1.2 Background... 4
1.2.1 SESAMM and Electronic Control Units ... 4
1.2.2 Hardware-in-the-loop LAB ... 5
1.2.3 Automated system and integration testing at Scania ... 5
1.3 Problem description ... 6
1.4 Aim of thesis ... 7
1.4.1 Delimitations ... 7
1.5 Relevance of the database test method ... 7
1.5.1 Database test method as a complement to current testing ... 8
1.5.2 Using test script database to test upon data generated without test scripts ... 8
2. Theory ... 9
2.1 Relational model ... 9
2.1.1 Relations in a relational database ... 9
2.1.2 Structured Query Language (SQL) ... 9
2.2 NoSQL database models ... 11
2.2.1 Document-oriented database, MongoDB ... 12
2.2.2 Column-oriented database, Hbase... 13
2.2.3 Key-value stores ... 14
2.3 Conceptual tools ... 14
2.3.1 Entity-relationship model ... 14
2.3.2 Unified Modelling Language ... 15
2.3.3 Flowchart ... 15
3. Method, methodology and tools ... 16
3.1 Method ... 16
3.2 Methodology ... 17
3.2.1 Block 1: Understanding the problem area ... 17
3.2.2 Block 2: Test script database development ... 17
3.2.3 Block 3: Algorithm development ... 18
3.3 Software tools ... 20
2
4.1 Analysing test script data ... 21
4.2 Evaluation of NoSQL models ... 22
4.3 Requirements ... 22
4.4 Presentation of database designs ... 24
4.4.1 NULL Solution ... 24
4.4.2 Entity attribute value solution ... 26
4.4.3 Redundant solution ... 28
4.4.5 Design of MongoDB ... 29
4.5 Evaluation of relational database designs with respect to requirements ... 29
4.6 Comparison between a MongoDB and a relational database ... 30
5. Algorithm design and development ... 33
5.1 Algorithm function overview ... 33
5.2 Requirements for algorithm ... 35
5.3 Software architecture ... 36
5.4 Results from testing the algorithm ... 37
5.4.1 First test case: Finding expected response, stimulus and state ... 37
5.4.2. Second test case: No matches... 42
5.4.3 Third test case: Fault injection ... 43
5.5 Evaluation of implemented algorithm with respect to requirements ... 45
6. Results discussion ... 47
7. Conclusions ... 50
3
Glossary
Automotive simulation models (ASM) - Simulink models of vehicle dynamics,
combustion engine, electrical components and driver assistance systems
Coordinator system (COO) - ECU acting as a gateway between ECUs on the CAN
network
Controller Area Network (CAN) - Data bus system allowing communication between
ECUs
Electronic Control Units (ECU) - Embedded device for controlling systems and
functions on the vehicle
Entity attribute value (EAV) - Database design that makes it possible to avoid sparse
tables
Entity-relation (ER) - A technique for building a semantic data model
Expected response – Assertions made in the test scripts comparing expected behaviour
with actual behaviour. Each expected response consists of a set of signals
Functional Product Characteristics (FPC) conditions - A form of a vehicular “DNA
string” which defines a particular vehicle customisation
Hardware-In-the-Loop (HIL) - Provides a simulated environment for testing of
embedded computer systems
Integration Testing - Testing the interaction between different components. Integration
testing at RESI focuses on system level testing
Local Interconnect Network (LIN) - Similar to the CAN network. Allowing
communication between ECUs
Regression Testing - Testing aimed at assuring that changes made to the system, such as
introducing new functionality, have not introduced new faults
Scania Electrical System Architecture for Modularization and Maintenance (SESAMM) - The electrical system of Scania's vehicles
Test scripts - Scripts written in Python. Executed in Scania's HIL lab with the purpose
of testing user functions
4
1. Introduction
Swedish heavy truck manufacturer Scania has an advanced module system that makes it possible for Scania to offer its customers to combine components and functions in order to tailor the customers’ trucks. Scania trucks therefore exist with many different component configurations which poses a challenge when testing the trucks’ ability to work correctly without errors. At Scania testing is being performed at several levels which mean that each part of a system is tested both individually and as a part of the bigger system. When testing components at a system level the components are treated as black boxes1 and are assumed to work correctly internally. Components being tested at Scania are Electronic Control Units (ECU), devices for controlling one or more systems or functions of a truck. Testing at a system level, here after referred to as integration testing, is performed to ensure that signals are being sent correctly on the Controller Area Network (CAN) buses which connects ECUs (Scania document 1422538 2003; Sundmark, Petersen and Larsson 2011).
To enable testing at a system level Scania has an advanced Hardware-in-the-loop (HIL) lab. In a HIL lab, real hardware and software components are tested in a simulated environment with simulated input. The HIL lab makes it possible to test functionalities of a truck which has not yet been manufactured and to perform tests which would be too perilous, too time consuming or for other reasons inappropriate to perform in an actual truck. Simulations in the Scania HIL lab generate a vast amount of data but analyses are currently performed on a very limited part.
As only a fraction of the data generated in Scania’s HIL lab is currently utilised in the test process this thesis aims to investigate the possibility of extending the use of data by examining a new test method. Information about the current testing and the testing environment is presented as background in the subsequent section in order for the reader to obtain sufficient knowledge to understand the new test method.
1.2 Background
The RESI group is responsible for system and integration testing of Scania Electrical System Architecture for Modularization and Maintenance (SESAMM). The group focuses on regression testing of User function (UF) scenarios. An example of a UF is the Cruise Control and an example of a UF scenario is a driver using the Cruise Control when driving at the velocity of 90 km/h. When adding new UFs, changes are commonly made in several ECUs. Thus, adding new UFs requires testing at a system level to ensure that the changes do not affect the whole system negatively (Sundmark and Kobetski 2013).
1.2.1 SESAMM and Electronic Control Units
The distributed system SESAMM2 is the electrical system in Scania’s vehicles and is used
to control electrical functions. The system consists of ECUs which are connected by Controller Area Network (CAN) and Local Interconnect Network (LIN) buses. The CAN bus network carries messages between the ECUs. A CAN message consists of a set of signals.
The ECUs are embedded systems used in vehicles to control different functions and systems. An example of an ECU is the Engine Control Module responsible for the engine.
1 Black box testing is a technique where the logic of the system under test is treated as unknown. A
5
The ECUs send and receive messages via the CAN and LIN buses. Some of the ECUs control functions essential for the vehicle whilst others are controlling functions which are desirable but not required (Scania document 1422538 2003; Sundmark, Petersen and Larsson 2011).
1.2.2 Hardware-in-the-loop LAB
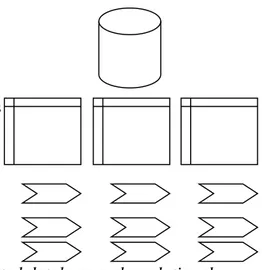
Hardware-In-the-Loop simulations is a technique frequently used in the automotive industry for testing of ECUs (Raman et al. 1999). At Scania the hardware tested is the ECUs and the buses connecting them. Automotive simulation models (ASM) created in Matlab are used to simulate the engine and vehicle dynamics. Furthermore the environment simulates sensors signals, i.e engine sensors, which are integrated in the lab providing the ECUs with data. The virtual vehicle, together with the connected hardware gives Scania the possibility to test different configurations without having to put them in an actual vehicle. A simplified illustration of the overall process is presented in figure 1.
Figure 1. Hardware In the Loop Simulation
1.2.3 Automated system and integration testing at Scania
The goal with the automated testing is to test that signals are being sent correctly on the main CAN buses between the ECUs. To simulate the actions of a driver, Scania uses scripts written in the programming language Python. Test cases included in the test scripts are often simple in nature, testing specific functions of the vehicle. A test case could consist of pressing and releasing the brake pedal or turning the hazard activation signal on and off.
Test scripts: The purpose of the test scripts is to test UF scenarios. Several UF scenarios
are tested3 in each test script. Test scripts contain acts and each act simulates one UF scenario. In addition to these test acts the test scripts always contain a pre act and a post act. The pre act sets the simulated vehicle in a state in which it is possible to test the UF scenarios. The post act resets the tested components so that the tests performed in the script do not affect tests in subsequent test scripts. In other words the post act ensures that all test scripts are independent and thus can be run in the HIL lab in any order.
6
The acts can be divided into smaller parts namely into states, stimuli and expected responses which in turn comprises sets of signals. The pre and post acts can include states and stimuli while each of the other acts contains stimulus and expected response.
Figure 2. Description of test script structure
States, stimuli and expected responses all consist of signals. Signals can attain different values but when referred to as parts of a state, stimulus or expected response they are always associated with specific values. In the test scripts, stimuli simulate actions taken by a truck driver such as pressing the brake pedal, releasing the brake pedal or pressing a light button. To each stimulus there is an expected response which represents the vehicle’s reactions to the human actions. A stimulus triggers an expected response. An expected response when pressing the brake pedal could be that the velocity of the truck is lowered. Another expected response to the same stimulus could be the activation of the brake lights. If the truck had been turned off, pressing the brake pedal would not have been expected to trigger any response at all. In a test script it is the task of the states to simulate a state of the vehicle in which a stimulus is a valid trigger of an expected response.
1.3 Problem description
The HIL lab used today have recently been upgraded, with the upgrade, it is now possible to log all signals in a simulation. This leads to that only a fraction of the data generated in the lab is currently utilised in the testing process. Executing a test script in the HIL lab equates to controlling that a predetermined set of 10-20 signals has changed value in a desired way. Currently, each script executed in the HIL lab generates one separate set of output data. The only signals that are logged and saved in the output are those 10-20 signals. The remaining signals are not logged having the effect that large amount of data goes unanalysed. To improve the test coverage, Scania wishes to investigate ways to utilise more data in the analysis process. The assumption is that a simulation could affect other signals than the ones that are foreseen to change and that are accordingly controlled. For example, pressing the brake pedal is not supposed to activate the hazard signal, but if it did it would currently go unnoticed.
To investigate the presence of this type of errors Scania would need a new test method4. A proposed test method is to store information from the test scripts in a database, log all
7
signals for each script5 and run all tests upon each set of output data generated by test
scripts in the HIL lab. The choice of using a database is based on the assumption that it is easier to store the test scripts in a database than to run them directly against the output data.
1.4 Aim of thesis
The aim of this thesis is to investigate the possibility to extend the use of output data by examining a new test method. The method is based on storing information from test scripts in a database and developing an algorithm to run tests upon output data from HIL simulations. The examination of the new test method will be performed by:
Determining whether a relational database or a NoSQL database is most suitable for storing the test scripts.
Establishing requirements for a test script database and a search algorithm.
Proposing different database designs and evaluate their suitability to support the functions of the search algorithm.
Developing an algorithm that utilises information stored in the test script database to run tests upon output data.
1.4.1 Delimitations
The target of this thesis is rather to present a proof of concept than to present a fully functional application. The extraction of data from the test scripts will be performed manually. As this is a time consuming work the number of test scripts inserted into the database will be limited to two.
1.5 Relevance of the database test method
The database test method is primarily intended to complement the test method which is currently applied at Scania for integration testing. The difference between the new test method and the test method currently applied at Scania is that the current one investigates errors which are foreseen to occur whilst the new test method is intended to help disclosing errors that are more difficult to foresee. The applied Scania test method is used to control that a stimulus triggers an expected response as desired while the database test method is meant to control if an expected response ever occurs without being triggered by a valid stimulus. In other words, the applied Scania test method is used to control that the fog lights turn on when toggling the fog light switch while the database test method controls if the fog lights are ever turned on without the switch being toggled. The two methods are intended to detect different types of errors. It would also be of interest to Scania to investigate if the database test method could replace the applied Scania test method as storing the tests in a database instead of in test scripts would enable testing in new ways.
5 Logging all signals for each script would mean that each database file would contain approximately
10 000 signals instead of containing 10-20 signals as they currently do. At the moment the logging has to be performed manually by copy and paste signals from one script to another and then run the chosen script in the HIL lab. In this thesis logging has been performed on a small scale, signals from one script have been logged in the execution of another script.
8
1.5.1 Database test method as a complement to current testing
The database test method would be used to detect errors that are difficult to foresee and thus not covered by the applied Scania test method. The database test method shall be able to detect expected responses occurring without being triggered by valid stimulus. Though it shall not be able to determine what actually triggered a faulty triggered expected response. Identification of the trigger lies beyond the delimitations of the database test method and is intended be performed manually.
1.5.2 Using test script database to test upon data generated without test scripts
Currently the executions which are tested are completely run by the test scripts. The test scripts are running the simulation as well as they are running the tests, i.e. confirming the expected value of a limited group of signals. In the HIL lab it is possible to simulate input signals without the test scripts and it would therefore be desirable also being able to run the tests without the test scripts. The alternative way to simulate input signals is to manually set the signals using an interface in the HIL lab. By storing the output data generated in this alternative way in a database and by storing the tests in another it would be possible to do testing without using test scripts.
9
2. Theory
This chapter begins with descriptions of different database models. First the relational database model is introduced followed by three different NoSQL database models. The aim of these sections is to familiarise the reader with different database concepts and lay a foundation for an evaluation of NoSQL databases. This is followed by a section were conceptual tools which have been used in this thesis project are presented.
2.1 Relational model
The relational database model was introduced in 1970 by the IBM employee Edgar Codd. The model builds its foundation on the mathematical concept of relations. Relations are based on the theoretical foundation of set theory (Elmasri and Navathe 2010). In mathematical terms, a relation is the mapping of elements from one set to another. In a relational database, relations can be perceived as two dimensional tables with columns and rows. In formal language the tables are called relations with tuples (rows) and attributes (columns) (Ponniah 2003). Relation-table, tuple-row and attribute– column are used interchangeably in the report, it is advised that the reader familiarise with the concepts and their meaning. The tables have a pre-determined structure (Leavitt 2010), from that follows that all the tuples stored in a table have the exact same number of attributes and the attributes are of the same type or format. The data needs to be homogeneous and structured to fit well into the tables (Parker, Poe and Vrbsky 2013).
2.1.1 Relations in a relational database
Relations are modelled by the use of primary and foreign keys. Each table has a primary key. The primary key is made up either of one attribute or a set of attributes which makes it unique so that a tuple can be identified by it. A tuple can sometimes be identified by more than one combination of attributes but there can only be one primary key. When one of these combinations is used in another table as a reference to the tuple it is called a foreign key. A foreign key is thus a set of attributes stored in one table with the purpose to identify a tuple in another table (Padron-McCarthy and Risch 2011).
2.1.2 Structured Query Language (SQL)
The Structured Query Language, SQL, is the standard language used for manipulating data inside a relational database. As SQL has been used to a large extent in the thesis some common features of the language will be presented. The most basic SQL commands are the SELECT, FROM and WHERE statements. SELECT specifies which attributes to include by stating the attributes name, FROM specifies the table from which the attributes are to be retrieved, WHERE is a conditional statement specifying conditions (Elmasri and Navathe 2010). Say that we have a table called Orders, the table contain the attributes orderId, customerId and date over some orders. Each tuple in the table represents one order. If we want to retrieve orderId and date from all orders with a customerId larger than 10 the SQL statement would be:
SELECT orderId, date FROM Orders
WHERE customerId>10
Resulting in orderId and date information from all tuples in the Orders relation satisfying the WHERE condition. Apart from these basic SQL statements, the language provides
10
more complex operations to be performed. The COUNT statement is an example of a built in aggregate function returning the number of tuples or values specified in the query. SELECT COUNT(*)
FROM Students
return the number of tuples in the table Students.
SQL operation JOIN: A distinguishing trait for SQL that other query languages lack is
the join operation. Joins6 have been used to a large extent in the algorithmic development
in this project. The main use of joins have been in matching signals from the test script database with signals in the output database files. The join statement enables queries that span multiple tables and thus allows for comparison between tuples of different tables returning the tuples satisfying the comparison condition. There are different types of joins. Inner joins match the tuples according to the comparison condition and only return the matches, tuples that are not meeting the criteria are eliminated. Outer joins keep all tuples from one of the joined tables also when there are no tuples in the other table that comply with the comparison criteria. This means that some tuples might be kept even though they are incomplete containing null values. A left outer join keeps all tuples from the left table (as specified in the query) and a Right outer join keeps all tuples from the right table (Elmasri and Navathe 2010). The example above had a table called Orders. Let us introduce another table called Customers, with attributes customerId, customerName, and country. To connect the customers in the Customers table with their orders a join between the tables Orders and Customers can be performed :
SELECT Customer.customerName, Customer.country, Orders.orderId FROM Orders, Customers
WHERE Orders.customerId = Customer.customerId
The FROM clause specifies which tables the join should be performed on, the condition in the WHERE clause assures that only the tuples fulfilling the condition are returned.
SQL operation VIEW: A view in SQL is a virtual table based on base tables. From our
previous examples, Students and Teachers are base tables, stored in the database. A view is not stored physically in the database. A view is a way of storing data obtained from a query. Views have been utilized in order to store certain information in a table for easy reference. Storing the query data in a view eases forthcoming queries by making them less complex. By making a view of joined tables it is possible to query for data from both tables without having to perform a join in each query (Elmasri and Navathe 2010). This approach, first creating views and then perform a join was a way to make the queries in the algorithm less complex. As a consequence of using views a lot of data that already exists is copied, this was however assumed to not affect the overall performance of the algorithm as the amount of data was small7. To create a view based on the Orders and Customers tables returning the customerName and orderId the query could be written as: CREATE VIEW CustomerOrders AS
SELECT Customer.CustomerName, Orders.orderId FROM Orders, Customers
6 There are three main algorithms for join operations inside a database. Nested loops, hash join and
merge join.
11
WHERE Orders.orderId= Customer.orderId
This creates a virtual table, or view, containing the customer’s name and order id.
2.2 NoSQL database models
The relational model presented above has dominated the database landscape for a long time. Recent years have seen a rise in new types of database models with fundamental differences from the traditional relational model. A catch all term for these models is NoSQL databases. This section will summarize some of the previous studies made on NoSQL databases and lay the foundation for the evaluation of NoSQL database models presented in the result section. NoSQL stands for Not Only SQL. The expression “NoSQL database” can be anything from a key-value store to a graph database.
According to Nayak et al. (2013) the rise of NoSQL databases has been driven by shortcomings of the traditional relational databases, for instance, regarding issues with scalability.8 This feature is presented as one important factor behind the growth of NoSQL models. Other important factors that are mentioned are NoSQL’s ability to better handle unstructured data (Aravindh,, Clarence and Shreeharsha 2012) and the ability to handle Big Data9 (Yishan and Manoharan 2013).
Scalability is a term that is repeated constantly in the literature regarding NoSQL databases. Nayak et al. (2013) argues that relational database performance degrades as data volume grows bigger. The statement is sweeping and not very precise but can be used as a general description of the motivation behind the emergence of NoSQL database models. It is out of the scope of this thesis to cover the large variety of NoSQL database that have emerged, furthermore, they all have their advantages and disadvantages. An evaluation of different NoSQL databases is not trivial, it all depends on the use case. To establish some common criteria for evaluation the criteria of previous studies has been investigated. Tiwari (2011) and Indrawan Santiago (2012) have performed extensive studies on NoSQL databases resulting in a couple of comparison criteria that will be used as benchmarks in this thesis when NoSQL models are evaluated. Tiwari’s (2011) comparison criteria consists of scalability, consistency, support for data models, support for queries and management vis. Santiago (2012) suggest the following as basis for comparison: data model, transaction model, support for ad hoc queries, indexing, sharding and license type. Not all of these are relevant regarding the problem in this thesis. The most relevant were kept disregarding the criteria that were not applicable to the thesis. The basis for evaluation used will be data models, support for queries and license type as they are best aligned with the problems associated with development of the test script database. The next section will introduce three10 different types of NoSQL database
models and their features. The review will later be used to determine which type of model is best suitable to further investigate.
8 Scalability in database terms refers to the ability of a database to expand efficiently as more data
and/or users are added to the database.
9 Big Data is another ill-defined term and have become a buzz word but it is usually described by three
characteristics: Volume, Variety and Velocity, Tiwari (2011) defines big data as any data set over a few terabytes.
10 There are many other models such as graph databases, object databases, XML stores etc, they will not
12
2.2.1 Document-oriented database, MongoDB
Document databases store data in the form of documents instead of using relational tables. The data format of the documents is usually JSON or XML (Arora and Aggerwal 2013). There are several different versions of document databases. The one that has been investigated more closely during this thesis, is MongoDB. The documents in MongoDB are similar to the tuples in a relational database. Furthermore, documents can be stored in collections which are similar to the concept of relations. The documents in MongoDB are stored in binary JSON format called BSON. Collections are not constrained by fixed schema, documents with different sets of attributes can be stored in the same collection (Arora and Aggerwal 2013; MongoDB 2014).
Document-oriented database Relational database
Collections Tables
Documents Rows
Figure 3. Illustration of the structure of a document-oriented database and a relational database.
The documents in Mongo consist of key-value pairs (Plugge, Membrey and Hawkins 2010). A simple illustration of a document called Person is depicted below. The document is stored in a collection called Citizens.
{“_id”: “002020311241”, "Name": "Sue", “Age”: “34” "City”: "Stockholm", "Phone_numbers": [”+46702334232","+469013816”], "Social_security_nr": "12345678",
"Children": {"Name": "Signe", "City": "Sydney", "Social_security_nr": "88382673"}} The document contains information about a person, the id uniquely identifies the document. “Name” is a key and “Sue” the value associated with the key. The document Person also contains information about the person’s children where the information about
13
the child is something called an embedded document, that is, a document inside a document. The use of embedded documents shows some of the flexibility with the MongoDB data model. Embedded documents make it possible to retrieve data about a person and it’s children in one query operation, while in a relational database this might required a join operation (depending on how the data is modelled).
Relation modelling in MongoDB: Relations can be modelled either by the use of
references or embedded documents. By storing the id of one document in another document, a relations between the two documents is created. A different approach concerns the use of embedded documents. As stated in the Citizen document example above, the embedded document Children creates a relation between the Person and the Children document.
Queries in MongoDB: Queries in MongoDB are executed with a syntax similar to the
JSON format. Queries are issued using the find() and findOne() methods. Queries in MongoDB select documents from a single collection. Running a query in Mongo equates to specifying a criterion or condition to determine what is returned (MongoDB 2014). In addition to the criteria, projections can be performed to further specify which fields to include. In its simplest form a query is executed with the following syntax:
db.collection.find()
The method accepts both the criteria and projections returning a cursor for all matching documents. An example of a query selecting all documents in the Citizen collection being older than 30 returning only the name field in matching documents.
db.Citizen.find({ age: { $gt: 30} } , {name:1} })
In the query above "db.Citizen.find" is telling Mongo to scan the collection Citizen,"{age: {gt:30} }" is the criterion with a query selector operator and “{name:1}” is the projection telling Mongo to only return the field “name” because the symbol 1 is equal to “true”. The query selection operator $gt ensures that the query returns only the documents where age is greater than 30. The same query in SQL would be:
SELECT name FROM Citizen WHERE age>30
Beside the document-oriented databases there exist two other NoSQL models that have been of interest in this thesis work, they are classified into two groups: key-value databases and column-oriented databases.
2.2.2 Column-oriented database, Hbase
A column database stores the data in a column-oriented fashion in contrast to the row-orientation of a traditional relational database. Big Table and Hbase, with the latter being open source, are examples of column storages, Hbase has been investigated a little closer. The original paper laying the foundation for the first column database Big Table, was produced by Google (Chang et al. 2008), Big Table was designed to be a distributed
14
storage system capable of scaling petabytes of data across hundreds of servers. Hbase is modelled after Google’s Big Table.
The model builds on column families where each column family can contain multiple columns. Column families offer flexibility by allowing different data types to be stored in each column in contrast to pre-defined types that are mandatory in a column belonging to a table in a relational database. Each column family has to be predefined, other than that, columns can be added when needed thus providing minimal need of upfront schema definition. Using a table from a relational database as comparison one can describe some features of the column model , a column family can be thought of as a column in a relational table, each row of the column database stores values only when data exist thus avoiding storage of null values. In a relational database, each cell stores one value, in Hbase, each cell in the table not only stores one version but multiple versions of the data thus providing good features for evolving data models (Tiwari 2011).
Query support in Hbase: Founders of Hbase, Apache software foundation, states that
Hbase does not support any advanced query language. The four primary data operations are Get, Scan, Delete and Put. Get returns attributes for a specified row, Put ads or update existing rows, Scan allows for iteration to be performed over multiple rows for a specified attribute and Delete simply removes a row in a table (Apache 2014).
2.2.3 Key-value stores
The key–value model has a similar structure to the document model. However the data structure in the key-value model is much simpler, data is stored as a value which corresponds to a key. In general, not all operations are being supported by the key-value model, such as joins and aggregate operations that are standard in SQL, which makes some functions impossible to conduct. The data is stored less structured than in, for example, a relational database (Pokorny 2011; Nayak, Poriya and Poojary 2013). Key-value stores allow for schema-less data storage where the key-Key-value pair usually consists of a string and a data type. The data can be of different types all depending on which programming language that is used, examples of data types are arrays or integers (Seeger 2009).
2.3 Conceptual tools
Conceptual tool is a term used by the authors to describe techniques and methods used within software engineering. The conceptual tools presented in this section were used to model the test script data or to describe the algorithm.
2.3.1 Entity-relationship model
The Entity-Relationship(ER) modelling is a technique for building a semantic data model. It is a method to visualise real-world information as graphical notations or symbols. ER models are easily transformed into relational database tables. The ER data model components are entities, attributes, relationships and keys (Ponniah 2003).
15
Figure 4. Description of the data model components which form an ER model.
2.3.2 Unified Modelling Language
Unified Modelling Language (UML) is a flexible and customizable language which can be used for different types of modelling. It is used in the field of software engineering and is a way for members of a software development team to communicate (Naiburg and Maksimchuk 2001).
2.3.3 Flowchart
A flowchart is a diagram which describes a process or an algorithm. It is a graphical visualisation of actions and decisions. It demonstrates in what sequence actions are being taken and the possible outcomes of decisions taken in the process (IBM 1970). Commonly, these are used in analysing or designing processes.
16
3. Method, methodology and tools
This chapter outlines the tools and methods used during this project. A presentation of used methods is followed by an overview of the work flow and a presentation of software tools used during this thesis project.
3.1 Method
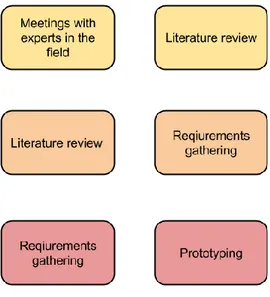
To achieve the aim of the thesis different methods were applied. The aim was to investigate a method already specified by Scania, this resulted in some constraints regarding the overall approach. Already specified was the choice of using a database for storage of the test scripts, moreover Scania requested that both a relational database and a NoSQL database were implemented to try the different alternatives. The choice of using a database was based on the assumption that this approach would be the easiest to implement. The problem area was divided in to three blocks. The actual working process was not nicely divided in to the blocks described below, overlaps between different blocks frequently occurred. Especially the requirements gathering process was pursued all along the project. As a consequence of this, development of both the database and the algorithm was performed with a living requirements document having the effect that solutions were based on incomplete specifications. In figure 4, the different parts of the problem are introduced with the methods used to solve the problems. The course of action is described in the methodology section.
17
3.2 Methodology
The initial block consisted of reaching an understanding of the problem area which was done by meetings with relevant Scania employees, literature review of Scania internal documents, literature review of research papers and scientific journal articles and a study of the code base for the simulation framework. The Scania internal documents were available on Scania's intranet while the remaining part of the studied material was found using Google Scholar and accessed by Uppsala University's library. After having reached a fundament knowledge of the problem the next block was initiated. Objective of the next block was to decide on a suitable database model for storing of test scripts. A literature review was performed to decide on one database management system to represent NoSQL databases. The representative of relational databases was initially elected owing to it having been used at Scania in similar contexts previously. Thereafter, suitable database designs for the two representatives were determined by an assessment of the different designs’ ability to live up to the requirements. Two databases were implemented and their impact on the algorithm complexity was assessed by testing how well necessary queries were performed. The last block consisted of development of an algorithm for running tests upon output data. Three test cases were formulated and the algorithm was tested by running it upon different sets of output data. Its ability to live up to the algorithm requirements was evaluated.
3.2.1 Block 1: Understanding the problem area
The first step prior to any development activities was to understand the testing procedure at Scania. An understanding was attained by meetings with Scania employees from the RESI group and by reviewing previous research, the Python test scripts and the code base surrounding the test scripts. Initially about 20 test scripts were studied in order to capture common features. Research papers and scientific journal articles were read to attain an understanding of integration testing in HIL labs and the tested components. Thereafter, a filtering of the test scripts started in order to extract necessary data to the test script database. To review the test scripts the software WingWare Python IDE was used.
Filtering process: To enable the transfer of the test script content into a database the
important elements of the test scripts had to be recognized. This was accomplished by analysing test scripts with all their functions and attributes and by consulting Scania employees. Most parts of the test scripts representing stimuli or expected responses were essential also to be represented in the test script database. It was however sufficient to extract 3-5 of the approximately 10-20 signals constituting a state. Those 3-5 signals were enough to identify the state and were recognised with the help of Scania employees.
3.2.2 Block 2: Test script database development
The development of the test script database was initiated by a literature review conducted in order to decide on a suitable NoSQL database management system and drafting of requirements for the database. It was not considered to be required to do an equally thorough investigation to decide on a representative of relational database management systems. This was due to that the common query language of relational databases makes them more interchangeable. The representative of relational databases was initially chosen to be SQLite. SQLite was chosen because it had been used by the RESI group in a previous project for storing HIL lab output data. Later in the project SQLite was replaced by PostgreSQL. The reason to the change was that PostgreSQL provided better management tools and a separate server process. Only one design of the NoSQL database was considered while three different relational database designs were evaluated. After the
18
evaluation of relational database designs one relational database design was implemented as well as one NoSQL database design. The requirements were updated and revised all throughout the project.
Requirements gathering: The requirements were, as mentioned earlier, collected and
formulated along the development process. They were collected at meetings with employees from the RESI group where the employees expressed their expectations on the new test method and its relevance to Scania. All collected requirements were graded on the basis of importance.
Determining NoSQL database representative: Research papers and scientific journal
articles on NoSQL databases were reviewed to obtain an understanding of advantages and disadvantages of the different NoSQL database models. Criteria, relevant for the test script database, for comparison of NoSQL database models was collected from previous studies. An evaluation based on the criteria resulted in that one NoSQL database model was selected to continue with. The selected NoSQL database model was MongoDB.
Database design: The database design started with modelling of data which was
performed mainly using Entity-Relation diagrams (ER) and Unified Modelling Language (UML). It was performed to provide an overview of the data, facilitating the database design. Four design drafts were evaluated more closely, one MongoDB design and three relational database designs. Document-oriented MongoDB offered more freedom when designing and modelling the data than the relational model did. MongoDB allowed storing the test script data in a way that was consistent with the test script structure. An obvious design was therefore to store the test script data in the database under the test script structure. Alternative ways of designing the Mongo database for storing the test scripts were not considered to offer any additional advantages. Thus, the only design regarded was the one preserving the test script structure. The relational model required the data to be modelled so that it would fit in tables. When modelling the data to fit into tables the data structure lost resemblance with the test scripts. To decide on an appropriate design for the relational model an evaluation of the designs’ ability to meet the requirements was made. Owing to the fact that the evaluation was done to determine the most suitable relational database design the MongoDB design was not a part of the evaluation.
Database implementation: In the implementation phase of the test script database the
data extracted from two python scripts was inserted into tables designed in the previous phase. The final relational database was implemented in PostgreSQL. The Mongo database was initially constructed from the shell. In order to get a graphical overview of the Mongo database the GUI MongoVUE was used. An online JSON editor was used to create the structure of the MongoDB documents which were then inserted in to the Mongo database using MongoVUE. SQL and the query language of MongoDB were tested and evaluated based on how these would affect the algorithm design. MongoDB was considered to require a more complex algorithm design.
3.2.3 Block 3: Algorithm development
The development of the algorithm was conducted as a proof of concept, the purpose was to test the database test method and to illustrate its field of application. It started by formulation of requirements followed by design drafting and prototyping. The phases of this block were performed iteratively.
19
Requirements: As the database requirements, the algorithm requirements were
formulated by meetings with employees from the RESI group and by analysing future use areas of the algorithm. The requirement gathering of the algorithm and the requirement gathering of the database started simultaneously even though the documentation of the former started first after the database development process had ended. The requirements of the algorithm were regularly updated throughout the project.
Design: When the first version of the requirements had been formulated a first flowchart
was created to show the overall design of the algorithm. The first design showed the main tasks of the algorithm and in what order these were to be done. To create flowcharts the web-based diagram editor Gliffy was used. The design process was restarted after having obtained better understanding of problems and tasks of the algorithm by developing prototypes.
Prototype development: The algorithm was written in the programming language
Python using WingWare Python IDE. Python was a natural choice as it was the programming language for the simulation framework. Flow control and embedded SQL were the main parts of the code. An alternative investigated was stored procedures, providing both branching and looping to be executed directly in the database without data being passed to an application. Stored procedures were never implemented but might be worth considering for future implementations, PostgreSQL fully supported this option whilst SQLite did not.
The prototype development started with a simplified prototype which was developed based on the first flowchart created. This prototype was tested against a mock-up database containing fabricated output data. The mock-up database was created with SQLite database manager. It contained data similar to the real output data but with only a few signals. The signals were represented for 25 timestamps. After having tested the algorithm on fabricated output data it was tested on real output data from the HIL lab. The two test scripts which had been inserted to the test script database were run in the HIL lab to generate output data.
The algorithm was at first developed using both output data and test script data from test script A. By using the output data from the same test script as from which the test script data was fetched it was assured that there were expected responses, states and stimuli for the algorithm to find in the output data. An expected response was expected to be present in the output data for a couple of seconds and since the output data was sampled every 0.002 second that meant the expected response would be found at several timestamps. The interesting timestamp was the one appearing first since it indicated when the search for stimulus should start. For an expected response to be considered to have been found all signals of the expected response needed to appear simultaneously. SQL queries made it possible to fetch all signals of an expected response from the test script database, search for them in the output database, establish how many of them that occurred at a given timestamp and determine which the first timestamp was where the highest number of expected response signals was to be found. After having formulated these queries and tested those on the output data it was discovered that not all signals where sampled at each timestamp. Signals were randomly sampled at odd or even timestamps each 0.002 second. The algorithm needed to be changed in order for it to treat signals sampled 0.001 seconds apart as signals appearing simultaneously. When the algorithm was able to determine whether or not it had found an expected response it was developed to search
20
for the valid stimulus and state using the same principles as for searching an expected response. The algorithm was expected to search through three different types of output data which made it relevant to formulate three test cases. The three test cases were formulated to tests the algorithm’s ability to;
1. find an expected response, stimulus and state when present in the output data 2. determine that no expected response was present and therefore abort the search 3. find an expected response and determine that no valid stimulus was present and
therefore abort the search
To give a better overview of the algorithm a new and more detailed flowchart was created using Gliffy. This flowchart is found Appendix C.
3.3 Software tools
All of the software tools used in this project are stated below together with a short description.
Gliffy Gliffy is a web-based diagram editor which offers online creation of flowcharts,
UML diagrams and ER diagrams amongs other things.
WingWare Python IDE Version 4.1 WingWare Python IDE is a development
environment for Python programmers.
MATLAB® Version R2011B (Matrix laboratory) Is a programming language and an
numerical computing environment developed by MathWorks. Matlab can be used to analyse data, develop algorithms and create models and applications.
Python Version 3.3.4. Python is a high level programming language which fully supports
object oriented programming and structured programming. It is often used as a support language for testing by software developers.
MongoVUE Version 1.6.9 MongoVUE is a desktop application for Windows OS which
provides a GUI interface to work with MongoDB.
Sqlite database browser 2.0 SQLite database browser is a GUI editor which eases
SQLite database using for non-technical users. It allows creating, modifying and editing SQLite databases.
PgAdmin Version 1.18.1 PgAdmin is an open source development and administration
platform for PostgreSQL.
PostgreSQL 9.3 PostgreSQL is an open source, object-relational database management
system.
SQLite Version 3.8.4.3 SQLite is a SQL database engine. It does not have a separate
server process like most other SQL databases. Instead it reads and writes directly to ordinary disk files of a cross-platform format.
SQLite manager Version 0.8.1 SQLite manager is an application available to Mozilla
Firefox web browser which provides a GUI interface to manage SQLite databases. (https://addons.mozilla.org/sv-se/firefox/addon/sqlite-manager/)
R Version 3.0.2 R is a programming language and an environment for statistical
21
4. Database design
In this chapter follows the results from the database design phase in which NoSQL database models were evaluated, requirements were established, different database designs were proposed and evaluated, one relational database design and one NoSQL database design were implemented and evaluated. The database design started with an analysis of the test script data which was to be stored in the database.
4.1 Analysing test script data
The purpose of the test scripts is to perform system and integration testing in the HIL lab by testing UF scenarios. System and integration testing is performed to test different component configurations. Not all UFs are available for every component configuration wherefore all test scripts contain information about which configuration it is valid for. This information is called Functional Product Characteristics (FPC) conditions.
The test scripts vary considerably. They contain a varied number of acts depending on the number of UF scenarios that are being tested. Each test script differs from the other not only depending on the number of acts but also depending on the structure of the acts. Commonly states are set in the pre and post acts and the other acts contain setting of a stimulus and the control of an expected response. Though, that is not always the case. States can be set in other acts as well and sometimes more than one stimulus is required to trigger an expected response.
Most test scripts contain time information. The time information is intended to slow down the execution of the test scripts so that the physical components get time to react to a stimulus before the expected response is controlled by the test script. An expected response is however not triggered correctly if it is delayed. Information about what is considered to be a delay is found in the test scripts.
In most test scripts there are some acts which are dependent on the previous act. The dependency is due to the test scripts being designed to be executed from top to bottom. One act might control that the brake lights go out when releasing the brake pedal. It requires that the brake pedal has been pressed to release it which is why there is a dependence between the act where the brake pedal is released and the previous one where it is pressed.
Test script signals can attain different values but when referred to as parts of a state, stimulus or expected response they are always associated with specific values. An expected response most often consists of checking that the signals are == to a certain value. In addition to equality assertions, checks can control if a signal is >=, <=,!= or found in a specific interval.
The signals that were determined to be necessary to be stored in the test script database were of three different types. There were CAN signals which correspond to the signals being sent on the CAN bus network. There were I/O11 signals which correspond to for example a brake light being active or not and there were signals corresponding to stimuli which mostly consisted of different driver variables and parameters belonging to the simulation framework.
22
4.2 Evaluation of NoSQL models
The results in this subsection are based on the literature review of NoSQL databases presented in the theoretical part. An observation made while scanning the NoSQL landscape was that many of the problems these models are aimed to solve are not present in the problem area of this thesis. The relevant criteria for a comparison of NoSQL models in this thesis was considered to be the three presented in the theoretical chapter: support for data models, support for queries and license type.
The column oriented database model that was investigated provided impressive scaling capabilities, this feature was however not relevant to the thesis problem. Furthermore, the column model provided good storage for evolving data models, the test scripts are however static and this feature would have been unnecessary. As Hbase is intended to be distributed across many servers the architectural pattern would not have been able to implement at Scania, the necessary hardware was not in place. Even if it would have been possible, one server had been enough as the amount of data to be stored by the test script database was fairly small. Furthermore, the query language of Hbase, although only briefly investigated, did not seem to provide any advanced features with its four basic operations get, put, scan and delete. The decision to label it as non-advanced was solely based on reading about the language, a more thorough investigation was not performed. MongoDB provided something in between, providing a more relaxed schema than a relational database but still providing the ability to model relations. With respect to the structure of the test scripts the data modelling options provided by Hbase and key-value stores were considered to be inadequate. Important to note is that no data modelling was tried with either Hbase or a key-value store. With Mongo the option to model each document differently was considered an advantage. The nature of the test scripts where each script had different attributes could easily be modelled with the document structure provided by Mongo. MongoDB also offered the most advanced query language which was an important factor when deciding which NoSQL model to choose. With respect to the problem MongoDB seemed like the best choice to further investigate. The evaluation is summarised in the table below grading the different models with either poor, ok, good or excellent.
Table 1. Summarisation of different database models’ ability to live up to given criteria.
Database model Support for queries Support for data model License type Document database, MongoDB Good Good Open source
Column database, Hbase Ok Ok Open source
Key – value store - Poor -
4.3 Requirements
The requirements for the test script database were summarized in a requirement table. Furthermore, they were placed in different categories depending on their nature. The following categories the performance, clarity, content, functions and design of the database.
23
Table 2. Requirements for test script database. Importance: 1 = mandatory, 2 = important, 3 = nice to have
Requirements for test script database
Special requests and constraints Shall be free and open source with an active community 1
Performance
Shall allow up to at least 1000 test scripts to be stored. 1
Clarity
The design shall be intuitively understandable for employees at the Scania department RESI. 2
Content
Shall contain data in the form of states, stimulus and
expected responses. 1
Shall contain information about which test script the states, stimuli and expected responses belong to. 1 Shall contain FPC conditions associated with test scripts. 1 Execution time between a stimulus and an expected response shall be stored. 3 Execution time between different stimuli in the same act
should be stored. 3
Shall contain a unique part identification number for each unique stimulus, state or expected response 2 Shall contain information regarding dependence in
between acts. 3
Function
It shall be possible to search for signals associated with a given state or expected response. 1 It shall be possible to search for names and properties of
the states. 1
It shall be possible to search for every stimulus that is a valid trigger of a certain expected response 2
Design
The database design shall support the functionalities of the
algorithm. 1
Special requests and constraints: It was a request from Scania that the database software
used in this project was free and open source with an active community.
Performance: The number of existing test scripts used by Scania in the HIL simulations
24
method to be useful for Scania it required that the database could store up to 1000 test scripts with respect to memory usage.
Clarity: The database test method would complement the integration testing performed
at Scania’s RESI department. The RESI employees were best able to determine the clarity of the database design since they had the deepest knowledge of the test scripts.
Content: The most essential information that the database was required to contain was
about whether a signal belonged to an expected response stimulus or state. The signals belonging to an expected response were supposed to be foregone by signals forming a stimulus. That is why one requirement of the database was to store the information about which one of the three categories the signals from the scripts belonged to. A certain expected response can occur in more than one test script being triggered by different stimuli in different test script. It is required to give each unique expected response and stimulus a unique part identification number to make it possible to keep track of all stimuli which can trigger a certain expected response. The same applies to states. The FPC conditions gave information about when the test scripts were valid to run against the output data. Thus, another requirement of the database was that it had to contain information about the association between FPC conditions and test scripts. The time in between a stimulus and the following expected response was not allowed to exceed a predetermined limit. If it did exceed the limit it meant that something was wrong. Thereof, a second requirement was to store information about the maximum execution time. More seldom was that several stimuli together triggered an expected response and in those cases it was of interest to store the maximum execution time between the stimuli.
Function: In order to run the tests from the test scripts on the data in the output database
files it was essential being able to query for all signals belonging to a certain expected response or a certain stimulus. When getting a match of an expected response in the output database the following step was to search for the stimulus that triggered it. It had to be possible to query for the information about which different stimuli that were valid triggers of a certain expected response. It was of interest to be able to query for the name of a state and information about all signals that the state included. This was desired to easily update a state.
Design: The test script database was developed as a part of the database test method
which made it important that the database was designed to support the algorithm. This means that all changes in the database design that could be made to reduce the complexity of the algorithm should be made.
4.4 Presentation of database designs
Three different relational database designs and one MongoDB design were considered for storing the test scripts. The three relational database designs derived from trade-offs which were made modelling the data so that it would fit into relational tables. One design meant storing null values while the other two meant storing redundant data.
4.4.1 NULL Solution
The NULL solution is a relational database design for storing of test scripts which results in storage of null values. The solution involves five tables, one for state, one for stimulus, one for expected response, one for test scripts and one relational table.
25
Figure 7. ER diagram illustrating the NULL solution. The attributes called Signals and FPC represent multiple attributes and examples of these attributes can be found in the squared boxes to the right.
The test script table contains information about FPC conditions. The attributes of the test
script table are several FPC conditions and the primary key is the test script id. State,
stimulus and expected response are entities. The table contains consists of foreign keys that identifies which specific states, stimuli and expected responses that belong to a certain test script.
Table 3. Illustration of a table for the test script entity.
Test script ID FPC1A FPCIB FPC2413A FPC2413B ... TestScriptC FPC1A NULL NULL NULL NULL TestScriptD NULL NULL FPC2413A FPC2413B NULL ... ... ... ... ... ... The primary keys of the stimulus and expected response tables are id codes which need to be specially invented for the database since they do not exist in the test scripts. The primary key of the state table is state name. State names are found in the test scripts. Each of the three tables has got signal names as attributes i.e. signal names are stored as meta data. Signal values are stored as data in the tables. Due to the signals being stored as attributes the table grows large. A tuple represents a specific state, stimulus or expected response having a unique set of signals. For each tuple there are many fields containing null values. A tuple that represents an expected response would contain signal values only in the fields of signals that were a part of that specific expected response.
26 Table 4. Illustration of a table for the state entity.
State Signal 1 Signal 2 Signal 3 ... Signal 55
Signal 56
... Parked 0 NULL NULL NULL 1 80 NULL Idling 1 NULL 1 NULL 0 80 NULL ... NULL NULL NULL ... NULL NULL ...
4.4.2 Entity attribute value solution
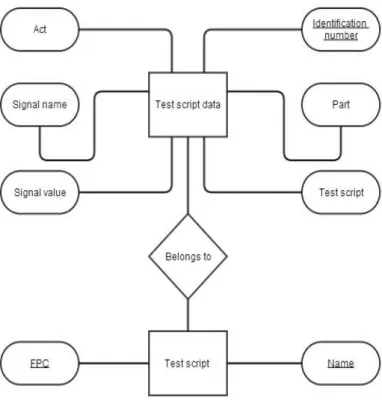
The Entity Attribute Value (EAV) model is used to avoid sparse tables which contain many null values. The EAV model is thus used when each entity has a small number of attributes but when the total amount of attributes for all entities is vast. Commonly an EAV table has got three columns where one is for a characteristic that identifies the entity, another one presents an attribute of that entity and the last one which adds a value to the attribute. (Thanisch et al. 2011) The EAV model was used when designing the Signals table and also inspired the design of the Test script table wherefore this solution goes by the name EAV solution. The EAV solution involves five tables; one for signals, one for test script parts, one for test scripts and two relational tables.
Figure 8. ER diagram illustrating the EAV solution.
The test script table contains information about FPC conditions. The composite primary key consists of its two only attributes namely test script id and FPC conditions. The table representing the test script part entity contains information about test script parts such as expected responses, stimuli and states. Attributes of the test script part entity are unique
number, type of group, test script number, specific type and part identification. The test script number declares which test script the part belongs to. Type of group indicates in
which act the part is found. Specific type is either expected response, stimulus or state.
27
means that when a certain expected response, state or stimulus occurs in more than one test script the part identification of that part will occur in more than one tuple.
Table 5. Illustration of a table for the test script entity.
Test script ID FPC conditions
TestScriptC FPC1A
TestScriptB FPC2413A TestScriptB FPC2413B Test script A FPC1A
... ...
Table 6. Illustration of a table for the test script part entity
Unique number
Test script no Type of group Part
identification
Specific type
1 Test script C Pre Parked State 2 Test script C Act1 STC001001 Stimulus 3 Test script C Act1 ETC001001 Expected response 4 Test script C Act2 STC001002 Stimulus 5 Test script C Act2 ETC001001 Expected response ... ... ... ... ...
One relational table, test script inner order, stores information about in which order the parts occurs in the test scripts. This table has a composite primary key consisting of the primary keys of the test script entity and the test script part entity namely test script ID and part identification.
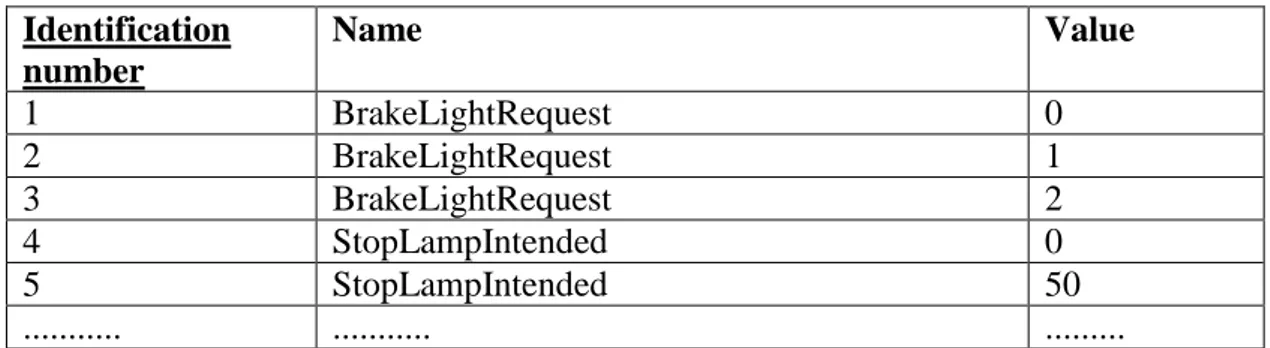
The signals table is designed as prescribed by the EAV model with an identification number, a signal name attribute and a signal value attribute. Every combination of names and values is unique with the identification number as the primary key. As a relation between test script part and signals there is one table which contains information about which signals a part consisted of. Both attributes in this table were foreign keys and constituted a composite primary key.
Table 7. Illustration of a table for the signals entity
Identification number Name Value 1 BrakeLightRequest 0 2 BrakeLightRequest 1 3 BrakeLightRequest 2 4 StopLampIntended 0 5 StopLampIntended 50 ... ... ...