Customers Sustainability Demand
A comparison between convenience goods and shopping goods
Bachelor’s thesis within Business Administration Author: Patrick Elfqvist
Viktor Höjman Lisa Nilsson
Bachelor’s Thesis in Business Administration
Title: Customers Sustainability Demand: a comparison between convenience
goods and shopping goods
Authors: Patrick Elfqvist
Viktor Höjman Lisa Nilsson
Tutor: MaxMikael Wilde Björling
Date: 2015-05-11
Subject terms: Sustainability, Sustainability demand, Customer attitude, Cus-tomer behaviour, Convenience goods & Shopping goods
Abstract
In pace with a growing awareness among customers, so does the demand for sustain-able products increase in various markets. Sustainability is even referred to become a mega-trend (Lubin & Esty, 2010). Although, extensive research can be found on sus-tainability and its three pillars; environment, social and economic, little is known whether there is a general customer demand for sustainability for any type of good. Therefore, this study’s purpose has been to compare sustainability demand for con-venience goods and shopping goods, with the research question ‘Is the customer’s sustain-ability demand different between different types of goods? And if so, what are the differences?’ By using a deductive approach, hypotheses has been drawn by examining existing research in the fields of consumer behaviour, customer behaviour and sustainability in general but also for the food and apparel industry respectively. With a quantitative method using a questionnaire, primary data has been collected of customers’ sustainability de-mand within the food and the apparel industries as representatives for convenience goods and shopping goods respectively. The questionnaire was designed to capture customers’ sustainability demand based on their perceived importance of the three pillars of sustainability. A comparison between the industries resulted in significant mean answers of 3,97 for food and 3,17 for apparel, on a six-point scale. Further, a marginally equal level was demanded for the three pillars within food whereas the en-vironmental pillar was considerably less ranked within apparel. The study further com-pares the sustainable attitude against sustainable behaviour. Actual buying of sustaina-ble goods within all three pillars was shown to be lower than demand for both types of goods. Lastly, an exploratory research was conducted on the two types of goods in combination with demographic factors, resulting in indications of what factors com-panies should take into consideration. The final conclusion of the research question was that there is a difference in customers’ sustainability demand for different types of goods.
Table of content
1 Introduction ... 2 1.1 Background ... 2 1.2 Problem discussion ... 2 1.3 Problem definition ... 3 1.4 Purpose ... 31.5 Target groups for the thesis ... 3
1.6 Delimitations ... 4
1.7 Definitions ... 4
1.7.1 Demand and perceived importance ... 4
1.7.2 Convenience goods and shopping goods ... 4
1.7.3 Sustainability ... 5
1.7.4 Sustainability in the Food industry ... 5
1.7.5 Sustainability in the Apparel industry ... 6
2 Theoretical Framework ... 7
2.1 Consumer behaviour ... 7
2.1.1 Consumer behaviour research ... 7
2.2 Demographics ... 8 2.3 Consumerism ... 8 2.4 Perception ... 9 2.4.1 Determinants ... 9 2.4.2 Intermediary states ... 9 2.4.3 Perception effects ... 10 2.5 Motivation ... 10 2.6 Attitudes ... 10
2.7 Social influence and Adoption ... 11
2.8 Customer behaviour research ... 11
2.9 Research on sustainability ... 12
2.9.1 Corporate Sustainability ... 13
2.10 Research on sustainability within food ... 14
2.11 Research on sustainability within apparel ... 14
2.12 Conceptual Framework and Hypotheses ... 16
3 Methodology ... 17 3.1 Choice of method ... 17 3.1.1 Inductive approach ... 17 3.1.2 Deductive approach ... 17 3.1.3 Quantitative research ... 17 3.1.4 Qualitative research ... 18 3.2 Implementation ... 18 3.2.1 Primary data ... 18 3.2.2 Secondary data ... 19
3.3 Design of the questionnaire ... 20
3.3.1 Pilot tests ... 20
3.3.2 Structure ... 20
3.3.3 Scales ... 20
3.3.4 Translation ... 21
3.4.1 Transformation of data ... 21
3.4.2 Exploratory data analysis ... 23
3.4.3 Segmentation analysis ... 24
3.5 Limitations of chosen method ... 24
4 Presentation of primary data from the questionnaire ... 26
4.1 Demographics and other affecting factors ... 26
4.1.1 Gender ... 26
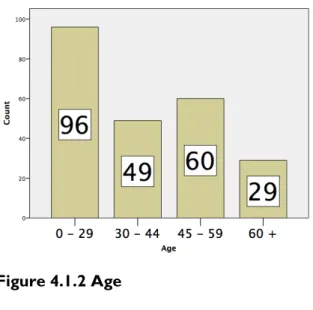
4.1.2 Age ... 26
4.1.3 Marital status ... 27
4.1.4 Children ... 27
4.1.5 Occupation ... 28
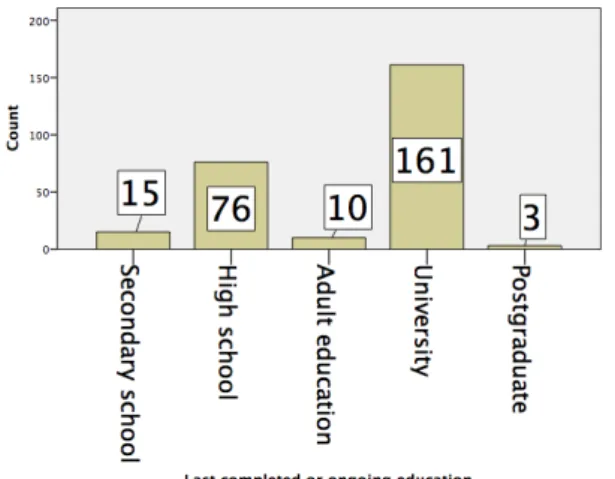
4.1.6 Last completed or on-going education ... 28
4.1.7 Annual income ... 28
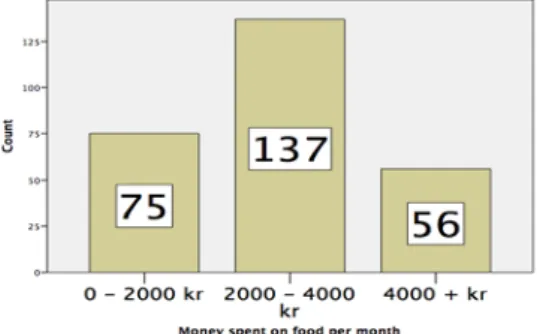
4.1.8 Money spent on food per month ... 29
4.1.9 Money spent on apparel per month ... 29
4.1.10 Frequency customers buy food ... 30
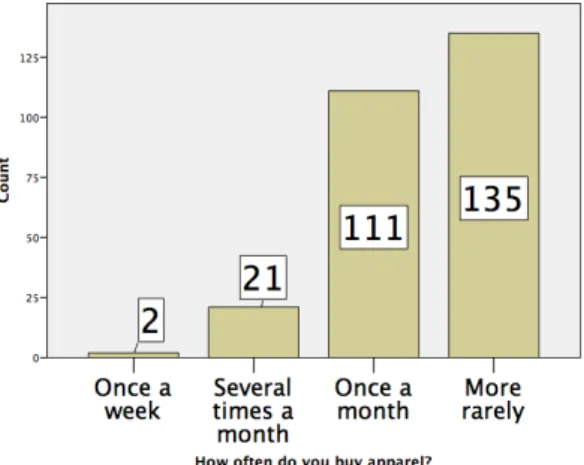
4.1.11 Frequency customers buy apparel ... 30
4.2 Hypotheses ... 31
4.2.1 Results for hypothesis 1 ... 31
4.2.2 Results for hypothesis 2 ... 31
4.2.3 Results for hypothesis 3 ... 33
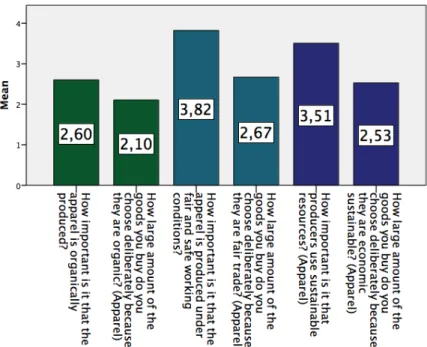
4.2.4 Results for hypothesis 4 ... 35
5 Analysis and discussion ... 39
5.1 Hypothesis 1 ... 39
5.2 Hypothesis 2 ... 40
5.2.1 Frequency as a reason ... 40
5.2.2 Perception as a reason ... 40
5.2.3 Adoptive and reflexive customers as a reason ... 42
5.2.4 The three pillars in the industries separately ... 42
5.3 Hypothesis 3 ... 43
5.3.1 Motivation as a reason ... 43
5.3.2 Issue-related factors as a reason ... 45
5.4 Hypothesis 4 ... 46 5.4.1 Gender ... 46 5.4.2 Marital status ... 47 5.4.3 Education ... 47 5.4.4 Age ... 47 5.4.5 Children ... 48
5.4.6 Remaining demographics which was excluded ... 49
5.4.7 The factors that influences customers most and least ... 49
6 Conclusions for customers sustainability demand ... 50
List of references... 52
Figures
Figure 2.7.1 Diffusion Process ... 11
Figure 2.9.1 Pyramid of Corporate Social Responsibility ... 13
Figure 3.1.2 Deductive Approach………...17
Figure 4.1.1 Gender ... 26
Figure 4.1.2 Age ... 27
Figure 4.1.3 Marital status ... 27
Figure 4.1.4 Children ... 27
Figure 4.1.5 Occupation ... 28
Figure 4.1.6 Last completed or on-going education ... 28
Figure 4.1.7 Annual income ... 29
Figure 4.1.8 Money spent on food per month ... 29
Figure 4.1.9 Money spent on apparel per month ... 29
Figure 4.1.10 Frequency customers buy food... 30
Figure 4.1.11 Frequency customers buy apparel ... 30
Figure 4.2.1.1 Aware customer ... 31
Figure 4.2.2.1 Sustainable demand food & apparel ... 32
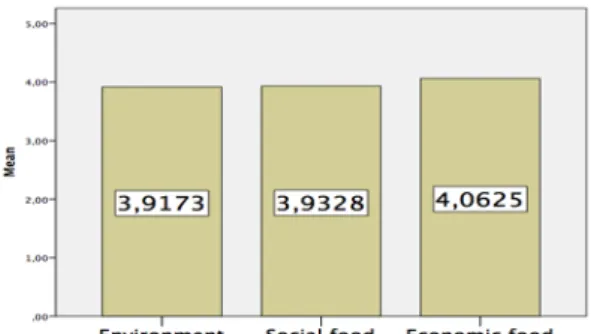
Figure 4.2.2.2 The three pillars within food……….32
Figure 4.2.2.3 The three pillars within apparel………...…33
Figure 4.2.3.1 Attitude versus behaviour within food industry ... 34
Figure 4.2.3.2 Attitude versus behaviour within apparel industry……….34
Tables Table 2.4.1 Determinants, intermediary states and effects of perception ... 9
Table 4.2.4.1 Men/ Women ... 35
Table 4.2.4.2 Marital status ... 36
Table 4.2.4.3 Education ... 36 Table 4.2.4.4 Age ... 37 Table 4.2.4.5 Children ... 38 Appendix Hypothesis 1………. 56 Hypothesis 2 ……… 56 Hypothesis 3 ……… 60 Hypothesis 4 ……… 62 Male/Female ……… 62
Single, Living apart/Married, Living together ……….. 64
Below university/University or higher ……….... 66
-45/45+ ……….………... 67 Children ……….. 69 Questionnaire ………. 72 Frequencies of Questionnaire ………. 75 Part 1 ………... 75 Part 2 ………... 82
1 Introduction
The following chapter will introduce to the topic and the intent of the essay, by discussing the topic in a broader context to the narrower issue.
1.1
Background
Business today is no longer the same as it was a few decades ago. Today we live in an infor-mation society, making inforinfor-mation more easily accessible for stakeholders to increase their awareness, according to their own preference and interest (Huang & Rust, 2011). Increasing amounts of the population gets aware of global problems, such as that according to the Global Footprint Network the humanity today uses 1,5 times as much resources as the world can produce in the same amount of time (Global Footprint Network, 2015).
This increased awareness has called for change and new trends have grown within the world of business. One of these is sustainability with its three underlying dimensions; environmen-tal, social and economic (Jackson, 2006; Drexhage & Murphy, 2010). It is the trend of sus-tainability Lubin and Esty (2010) in their article characterises as an emerging mega-trend. To call sustainability a mega-trend is not a nimble statement, since it then ends up in the same category of trends as electrification, globalisation and mass production (Lubin & Esty, 2010). For a trend to qualify as a mega-trend it shall present “inescapable strategic imperatives for corporate leaders” (Lubin & Esty, 2010, p.42).
According to Lubin and Esty (2010), what makes sustainability a mega-trend is how environ-mental factors has majorly affected businesses way of creating value for their stakeholders since the end of the 1990s. This has then developed through “escalating public and governmental concern about climate change, industrial pollution, food safety, and natural resource depletion, among other issues” (Lubin & Esty, 2010, p.43). To engage in sustainable actions is therefore crucial and increasingly important for businesses to stay competitive in the long run. “Sustainability has gone from a nice-to-do to a must-do. It is about what we do right here, right now, and for the rest of our working lives” (Howard, June 2013).
Early studies of Sustainable Corporate Performance (Collins, Steg & Koning, 2007) acknowl-edged the balance between the economic, social, and environmental pillars and found value adding attributes from such engagement. There is also extensive research to be found on how to manage businesses in a sustainable manner. For example, Kaptein and Wempe (2001) provide requirements for sustainability management in their research, as do Lowitt (2014) provide a checklist for business leaders to customise their strategies within the four fields of sourcing, manufacturing, distribution and consumption to act responsibly in relation to sus-tainability.
There are large numbers of scientific articles and research to be found on the subject of sustainability, but there are still parts that are less researched than others. It is within one of these areas this thesis will provide insights and contribute with its findings.
1.2
Problem discussion
Much of the existing research has either a very general view on sustainability demand or has business profitability itself as the main focus (Huang & Rust, 2011). However, if a company realise the significance to top prioritise customer’s interests, it can pursue competitive sus-tainability advantages by meeting the customer’s current and future needs (Day, 1994).
Sol-omon’s (2001) study reports that customers are the stakeholder group that is the most fre-quent factor to initiate change within an organisation. This is unsurprisingly as by buying or choosing not to buy a certain product or from a certain company, customers exercise a force-ful power on companies. Customers are however also shown to be the stakeholder group to receive the most attention by the management team (Agle, Mitchell & Sonnenfeld, 1999). As explained above large theoretical focus has been put on the perspective of the business side. This thesis will instead focus on customers’ sustainability demand between different types of goods. By comparing customers’ sustainability demand within two different types of industries this research will be able to either accept or reject that there is a general demand for sustainability that can be used for any type of good.
Lastly, before moving further into the thesis, a definition decision made by the authors is to be clarified. The customer are defined to have three roles; the buyer, the payer and the user of a good or service. While the consumer are defined as solely the one using the purchased good or service (Joseph, 2014). Consequently, in the problem and purpose as well as through-out the empirical research, results and analysis the authors refer to customers, as they are the one making the purchasing decision. Although, consumer behaviour research are used in the theoretical framework to explain customer behaviour, since the latter has derived from the former.
1.3
Problem definition
Sustainability is increasingly demanded on many markets and customers are increasingly gain-ing greater awareness of what impact their purchases have on the environmental, social and economic pillars. Today there is much research to be found in relation to sustainability, con-sumer preference, attitudes and behaviour within different fields, industries and goods sepa-rately. Although, there is not much research comparing and showing if customers’ sustaina-bility demand are equal for all types of goods they purchase. Hence, the authors are asking the question:
Is customers’ sustainability demand different between different types of goods? And if so, what are the differ-ences?
1.4
Purpose
The purpose of the thesis is to, through a set of hypotheses derived from the theoretical framework presented further into the report, identify how customers value sustainability within different types of goods. This study aims to provide businesses with a notion on pos-sible differences in sustainability demand between different types of goods. The empirical study and research will measure and compare customers’ sustainability demand, to accept or reject the hypotheses.
1.5
Target groups for the thesis
Writing the thesis, the authors has had in mind that their main audience and target group will consist of university level business students and business professionals. Therefore a certain language and level of prior knowledge within the field of business and economics is assumed. This has been taken into consideration upon defining some concepts and models, while oth-ers are mentioned without further explanation.
1.6
Delimitations
This study will be made in Sweden with a survey conducted in Swedish. Hence, limiting the respondents and consequently the result to reflect the Swedish population and mind-set whereby a more general conclusion cannot be made. The survey will be made available in two ways, (1) through the social media platform Facebook and (2) by a physical survey col-lection made in Jönköping, Sweden. This will further reduce the possibility to conclude a general result.
Second, the two different types of goods that will be compared in the research are conven-ience goods and shopping goods. Since both of these type of goods comprises a wide range of industries, and will therefore be too complex to measure in this report, two industries has been chosen to represent the two type of goods. In the process of electing the industries, two criteria were considered;
• The industries shall be available to a majority of the society
• The span of customers shall reflect as large parts as possible of the population With these criteria in mind the food industry and apparel industry was chosen to represent convenience goods and shopping goods respectively. These two industries are used in the empirical study and research to measure and compare customers’ sustainability demand, and to accept or reject the hypothesis. Therefore, this report will only be able to indicate on results of sustainability demand within the two chosen type of goods.
1.7
Definitions
1.7.1 Demand and perceived importance
‘Demand’ is a common term in business context where it refers to the “desire for certain good or service supported by the capacity to purchase it” (BusinessDictionary, 2015). In this study ‘demand’ will be considered from a non-monetary perspective. Sustainable alternatives are today avail-able throughout a range of goods and industries with great variety in prices, and therefore this study will look at different goods regardless of its price. Hence, in this case ‘demand’ will instead be measured by the populations’ perceived importance of sustainable goods. The authors argue that the demand for sustainable goods should be equal to the customers’ per-ceived importance; hence this is the quantity companies should supply to the market. Fur-ther, to be able to compare goods the study will have a non-monetary perspective on ‘de-mand’ in its investigation but may discuss monetary reasons in the analysis and conclusions.
1.7.2 Convenience goods and shopping goods
Although convenience goods and shopping goods may be the same or different items for each individual, the authors felt the need to some extent provide clarification between the two concepts. The following definitions can be found from the Business Dictionary (2015) and will be used it the thesis:
Convenience goods: “Widely distributed and relatively inexpensive goods which are purchased frequently and with minimum of effort, such as gasoline (petrol), newspapers, and most grocery items” (BusinessDic-tionary, 2015).
Shopping goods: “A higher end product occasionally bought by consumers that are usually compared for their appropriateness, quality, cost and features before purchase occurs. Consumers tend to take more time
when purchasing a shopping good produced by a business, and they might even travel to buy such goods” (BusinessDictionary, 2015).
These definitions are highly in line with Holton’s (1958) distinction between the goods. Hol-ton (1958) stresses the fact that the true difference can only be known from the individual consumer, but the tendency for convenience goods are the comparably low cost for search-ing in terms of time, money and effort relative to the perceived value of the purchased item. In contrast, shopping goods have from the consumers’ point of view a comparably high searching cost regarding the same parameters (Holton, 1958).
1.7.3 Sustainability
Sustainability is a fluid concept with a variety of definitions that have emerged over the last two decades. In this study the classic definition of sustainable development from the Brund-tland report (Drexhage & Murphy, 2010), Our Common Future, has been the basis of our in-terpretation:
“Development which meets the needs of the present without compromising the ability of future generations to meet their own needs” (Drexhage & Murphy, 2010).
It is widely accepted that sustainable development requires a convergence between the three pillars of environmental protection, social equity and economic development (Drexhage & Murphy, 2010). The three pillars will be used as a measurement and work as a common denominator between the two industries, providing comparability. The descriptions of the three pillars are:
• Environment: The components of the environmental pillar are substantially: ability to reduce emissions, resource reduction and product innovation. The relationship between company and the environment is in focus, concerning the actions that are taken in respect to the environment (Drexhage & Murphy, 2010).
• Social: The social pillar treats the ability of the social system and is composed of: diversity and opportunity, human rights, health and safety, among others (Drexhage & Murphy, 2010).
• Economic: The economic pillar refers to the ability to support a specific level of economic production and maintaining a balance between economic growth and the ecosystem (Drexhage & Murphy, 2010).
1.7.4 Sustainability in the Food industry
Sustainable development in the food industry is often compartmentalised to environmental issues, regarding for example pesticides and transportation of food (Baldwin, 2009). How-ever, Baldwin (2009) also reviews the social and economic pillar when defining sustainability in the food industry. Thus, in this study all of the three pillars will be taken into consideration when examining the food industry. To conclude, for this thesis, the definition of sustainabil-ity in the food industry is:
The way food is produced, transported, sold and disposed of while maintaining or improving environmental, social and economic levels.
1.7.5 Sustainability in the Apparel industry
The apparel industry is often oriented towards social and environmental issues, concerning working conditions and health safety of workers (Goworek, 2011). However, in order to be able to compare, all of the three pillars will be used in the definition of sustainability. For this thesis, the definition of sustainability in the apparel industry is:
The way apparel is produced, transported, sold and disposed of while maintaining or improving environmental, social and economic levels.
2 Theoretical Framework
The following paragraphs will describe consumer behaviour from a theoretical standpoint and its late movement into customer behaviour research. This section will also cover earlier research within the field of customers in relation to sustainability in general as well as for the chosen research goods respectively. The final part of this chapter provides a conceptual framework with drawn hypotheses for the quantitative research.
2.1
Consumer behaviour
Making sales forecasts and predicting customers preference and behaviour is by large an important factor for company’s profitability. However, consumer behaviour research also provides insightful information for the individual person to optimise its income spending. Antonides and van Raaij (1998) provides a comprehensive definition of consumer behaviour as:
“Mental and physical acts, including their motives and causes of individuals and groups regarding orientation, purchase, use, maintenance and disposal, and household production, of goods and services from the market-, public- and household sector. Leading to functionality and the achievement of consumer goals and values and thus to satisfaction and well-being, taking into account short-term and long-term effects and individual and societal consequences” (Antonides and van Raaij, 1998, p.4).
Antonides and van Raaij (1998) then explain their definition as follows: consumption may be concrete, physical and observable like purchasing a physical good. However, it might also be mental nature which is difficult to observe, such as participating in an activity or refrain from the same. Further the behaviour may be reasoned, impulsive or habitual. Consumer research also take into account the motives and causes of the behaviour, both as individuals and as a group. Like members in a household communicate and take mutual decisions, or a group of friends taking a collective decision, much consumption behaviour occurs on behalf of others. Through the process of orientation, purchase, use and disposal the consumer ex-perience functionality and the achievements of goals and values. Often, one can express one’s preference and identity through one’s consumption. Lastly the consumer's ultimate goal of satisfaction and well-being will be met.
2.1.1 Consumer behaviour research
After the Second World War an increasing part of consumers no longer had to struggle to survive and more alternatives became available to the consumer. More people also succeeded bringing in a larger income than needed to cover the basics of rent, food and clothes. Hence, discretionary income emerged, which is the income households can spend freely after cov-ering basic needs. Producers then realised the significance and benefits of observing con-sumers choice (Antonides & van Raaij, 1998).
In their book, Antonides and van Raaij (1998) describe the history of consumer research by several different approaches beginning already in the late 19th century. One approach worth
mentioning for this study is the single-concept approach where concepts of personality, per-ceived risk and cognitive dissonance were brought into light. Personality aspects were already then shown to be unsuccessful in explaining and predicting consumer behaviour (Kassarjian, 1971). Perceived risk however was shown relevant in consumer’s decisions in connection to high cost, physical danger or criticism from other people (Bauer, 1960). Cognitive dissonance (Festinger, 1957) implies that people are striving for order and consistency but which can be disturbed by conflicting behaviour. This may arise before the purchase situation when choos-ing between goods which both possess positive and negative attributes. It may also arise after
the purchase situation when the consumer experiences an appealing interest of the non-cho-sen alternative. To reduce the dissonance, the consumer might then mentally upgrade the features of one of the items and downgrade those of the other, or likewise for the chosen alternative compared to the non-chosen if the purchase has already been made. Cognitive dissonance can also mean that the knowledge is in conflict with the behaviour, as when en-gaging in something you know is harmful to your own health. Mistrusting or ignoring the source of information expressing the harmfulness may then reduce the dissonance.
The first published European book on consumer behaviour focused on the individual deci-sion process and brought forward other relevant characteristics of consumer behaviour (Hansen, 1972). “Consumers experience conflicts between alternatives, between spending and saving, and between egoistic and altruistic motives” (Hansen, 1972 from Antonides & van Raaij, 1998 p. 9). To decrease the discomfort the consumer can engage in information processing.
2.2
Demographics
Antonides and van Raaij (1998) gives in their book a number of demographic factors com-monly used within consumer behaviour research. In this paragraph only the most relevant demographics to this study are mentioned. Population age distribution in Europe is to be considered in respect to the increasing number of older people living even longer in combi-nation with a decreasing birth rate. Further, population levels are increasing more rapidly than household levels, in combination with the emerging of new and shrinking household constellations that will have a different demand than previous structures. Households are broadly defined as “shared residence and common housekeeping arrangement” (Askegaard, Bamossy, Hogg & Solomon, 2013, p. 449). Antonides and van Raaij (1998) explain that although edu-cation length is varied across Europe, the increasingly skilled essence of jobs are demanding a higher level of education overall. Continuously, educational differences create gaps of in-formation processing abilities. Hence, higher educational levelled inhabitants handle infor-mation more efficiently, and thereby demand different goods and services than less educated consumers. Whether education and employment experience has a significant relationship to sustainability and awareness remain unclear (Ferrell, Loe & Mansfield, 2000), but there seems to be indications for it.
2.3
Consumerism
Consumerism emerged during the 20th century as a social movement aiming to strengthen the rights and power of the buyers against the seller (Kotler, 1972). Consumers have become more critical which may have significant effect on their behaviour. Van Raaij (1974) has dis-tinguished several types of consumerism based on the political and societal opinions of the consumer. (1) ‘Liberal consumerism’ emphasises the importance of expanding the consum-ers’ knowledge and capacities to increase their market power. (2) ‘Responsible consumerism’ includes a larger context of social responsibility for the consumer. Except for value, the re-sponsible consumer seeks extended durability, lower levels of pollutant emission, more effi-cient energy use and use of recycled materials. (3) The ‘critical consumer’ questions the con-sumption system in general and takes actions against unnecessary and unsafe products by strengthening the consumers’ position through consumer actions, legislation and govern-ment measures. (4) The last, ‘the radical consumer’, is of anti-capitalistic manner, which con-sider consumerism to have a destroying nature due to the inequity of the social system.
2.4
Perception
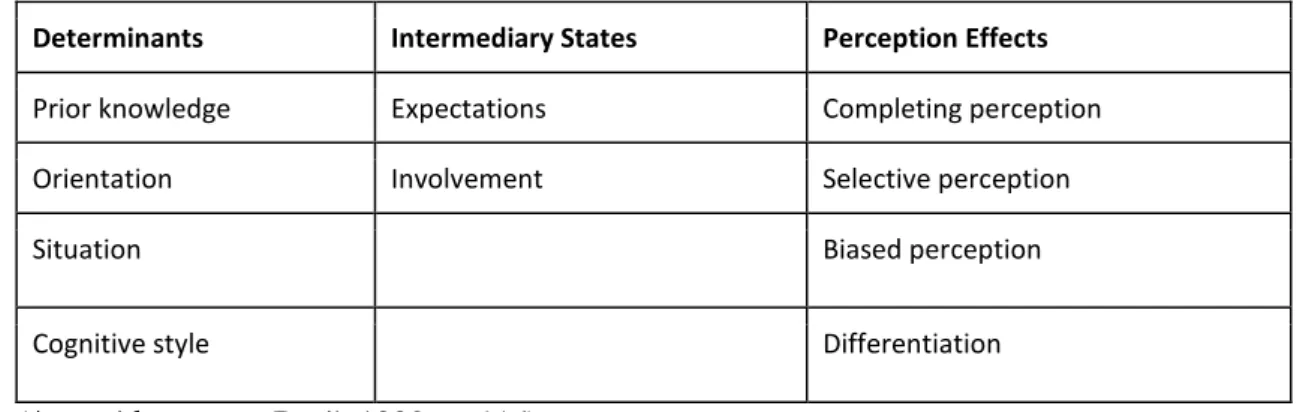
An important factor of consumer behaviour is the psychological process of perception. In Antonides and van Raaij’s book (1998) the authors have divided the concept into three stages: Determinants, Intermediary states and Perception effects, visible in Figure 2.4.1 be-low.
Table 2.4.1 Determinants, intermediary states and effects of perception
Determinants Intermediary States Perception Effects
Prior knowledge Expectations Completing perception
Orientation Involvement Selective perception
Situation Biased perception
Cognitive style Differentiation
(Antonides & van Raaij, 1998, p. 116)
2.4.1 Determinants
Antonides and Raaij’s (1998) determinants are divided into four categories: (1) ‘Prior knowledge’ and experience result in more efficient interpretation and different observation then less knowledgeable people. (2) The ‘orientation’ limits the consumer to observation of the environment through a mental frame. Antonides and Raaij (1998) exemplify orientation by when a consumer is considering buying a car, the consumer will start to notice more car advertisements. (3) The consumers’ ‘situational’ condition may also influence the perception. The consumer might be under time pressure, happen to be in a difficult situation, have a disturbing surrounding or feel informatively overloaded. Then the opportunity to process information in a desirable way is reduced. (4) ‘Cognitive style’ is a trait of the individual character of the person. The style depends on to what extent the person notices the context of the object that is being observed (Antonides & van Raaij, 1998). A field-dependent cog-nitive style implies an external orientation while a field-independent person has an internal orientation. The latter behave more independent, search for understanding within itself in uncertain situation and are less affected by its environment, which creates good skills in cog-nitive analysis and organising. The opposite field-dependent person makes greater use of external social reference due to its more emotionally openness and interpersonal nature (Goodenough & Witkin, 1977).
2.4.2 Intermediary states
In the ‘intermediary states’, Antonides and van Raaij (1998) distinguish the two factors ‘ex-pectations’ and ‘involvement’. ‘Ex‘ex-pectations’ create a window, filter or frame on reality which makes ones view limited to see what one expects to see. Information that does not fit into this filter is less likely to be taken into consideration. Consequently, information that fits into the frame but is less available is more likely to be observed than more available information with a lower fit. The other stage, ‘involvement’, concerns the level of one’s involvement in a situation or subject, the higher level of involvement the more knowledgeable and differenti-ated perception the person will create and possess. This generally leads to further engage-ment, more information processing and less superficial perceptions (Antonides & van Raaij,
2.4.3 Perception effects
Lastly, four forms of perception effects are described in the book by Antonides and van Raaij (1998). (1) ‘Completing perceptions’ may contain concepts such as principle of closure and principle of similarity (Askegaard et al., 2013). People tend to mentally complete an observa-tion to assimilate its message even though elements are vague or even missing. Antonides and van Raaij (1998) exemplify this by: if a product has three desirable qualities, a consumer tends to assume that a fourth quality is good too. This form is a highly possible effect of the determinant ‘prior knowledge’. (2) ‘Selective perception’ may occur from the situation deter-minant as the perception is limited to what the person wants or expects to see and exclude unwanted information. (3) ‘Biased perception’, is due to people's individual life stories, cir-cumstances, moods, and goals everyone perceives reality differently and one may question whether an objective reality even exists. In a positive mood a person might appreciate the sun shining while in a bad mood complain at the heat. (4) ‘Perceptual differentiation’ creates classifications of phenomena. A person with high differentiation includes and identifies more aspects into his or her judgment, creating more and narrower categories, than a person with less perceptual differentiation.
2.5
Motivation
Motivation is explained by Askegaard et al. (2013) as a process that is initiated by a sense of need that the consumer wants to reduce or satisfy. How the desired goal may then be reached depends on the motivational strength and direction. Motivational strength can be explained by the amount of energy the person is prepared to spend to reach the goal in mind whereas the motivational direction implies towards which way the person turns to satisfy the goal, which to some degree depends on to what alternatives are being available and offered from producers (Askegaard et al., 2013). The goal could further be distinguished by negative or positive sense. A positive goal is a goal the consumer wants to approach and reach whereas the consumer might be motivated to avoid a negative result (Banister & Hogg, 2004). Alt-hough, needs are seldom that simple, a need might be of both positive and negative nature and thus creating a conflict. Kramer and Yoon (2007) have in their study defined three gen-eral types of conflicts: (1) the ‘approach-approach conflict’ occurs when the consumer is confronted by two desirable alternatives. Here might the earlier mentioned cognitive disso-nance provide ease in the decision, by adding or reducing positive attributes from either alternative. (2) The ‘approach-avoidance conflict’ on the other hand deals with a wanted goal that also carries negative outcomes. Hence, a goal one wants to reach but simultaneously avoid. This goal creates a sense of guilt for the consumer who needs to find a substitute that reduces the guilt enough to accept the desire. A substitute might be ‘less sugar added’ prod-ucts for the person who desire sweets but are concerned by its weight. (3) The ‘avoidance-avoidance’ conflict concerns when one have to choose between two alternatives that both have a negative outcome.
2.6
Attitudes
A persons’ attitude are often describe in connection to behavioural studies. Through atti-tudes, people form opinions of what they like and dislike which are largely guiding the way they live and choices they make. An attitude may be defined as “the individual predisposition to evaluate an object or an aspect of the world in a favourable or unfavourable manner” (Antonides & van Raaij, 1998, p 197). It is commonly accepted that attitude consist of affect, behaviour and cognition, which in turn are referred to as the ABC model of attitudes (Askegaard et al., 2013). The significant feature of this model is that it emphasises that knowing, feeling and doing interrelates with each other. As a result of their correlation, the concept hierarchy of
effects was developed as a linear function depending the level of involvement for each com-ponent in the process of forming an attitude. The three hierarchies are the standard learning-, the low involvement-learning-, and the experiential hierarchy.
2.7
Social influence and Adoption
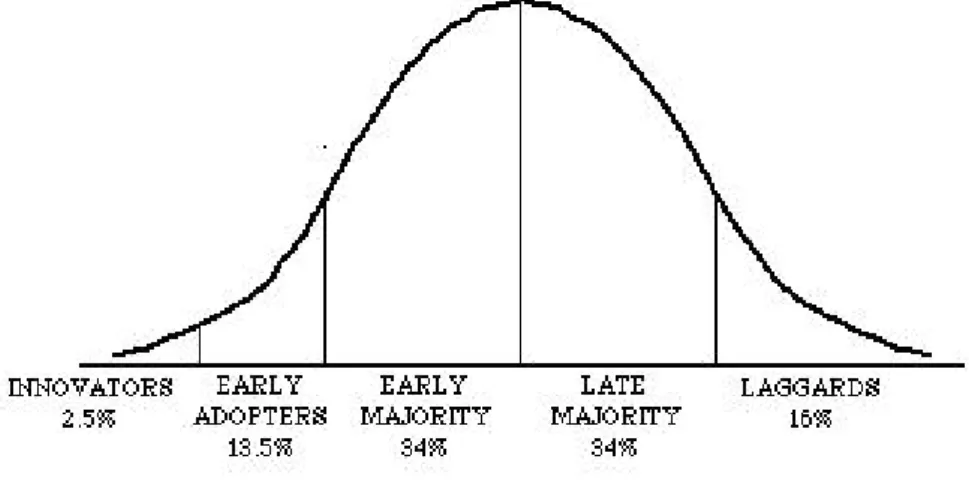
Household structure and group decision was earlier mentioned to have influence on con-sumer behaviour. To further develop this thought it is appropriate to introduce social influ-ence and group norms. The group norm works as a collective opinion that is motivated by the individual's psychological cost and benefits from being unique versus belonging to a group (Antonides & van Raaij, 1998). For opinions to be shared in society, there is also need for communication. The same person may simultaneously be an information source to others in one subject but an information gatherer in another depending on involvement and interest in different subjects (Antonides & van Raaij, 1998). Persons who catch on to new trends and innovations first are often referred to as opinions leaders who then transmit information to the opinion followers (Antonides & van Raaij, 1998). How effectively people catches on to information and how fast they adapt to new innovations can be distinguished in the ‘dif-fusion process’ (Rogers, 1983). The dif‘dif-fusion process, visible in figure 2.7.1 identifies the following categories: Innovators, early adopters, early majority, late majority and laggards.
Figure 2.7.1 Diffusion Process
(Rogers, 1983)
2.8
Customer behaviour research
In line with the distinction between customer and consumer in the background section, Mit-tal, Newman and Sheth’s (1999) definition of customer behaviour reads “the mental and physical activities undertaken by household and business customers that result in decision and actions to pay for, purchase, and use products and services” (Mittal et al., 1999, p. 5). The definition makers distinguish between the roles of a customer, which is (1) the user who consumes the product or service, (2) the payer who finance the purchase, and (3) the buyer who performs the actual purchase activity. The same or different persons might carry out all these customer roles, while the consumer could solely play the part of the user. Hence, customers have the final decisive judgment of their sustainability value and buyer power at the actual buying situation. Conse-quently, not only the consumers’ needs and wants have to be considered by companies now-adays, but also the customers buying behaviour and paying decisions. For these reasons, marketers study customer behaviour (Mittal et al., 1999).
2.9
Research on sustainability
Customers increased sustainability choices in Sweden are evident in the figures of 2013, where the value of sold Fairtrade products increased by 29%, and a vast majority of the increase was within the food industry (Fairtrade Sverige, 2013), compared to the general household expenditure increase of 2,5% (Statistiska Central Byrån, 2013). A general percep-tion of ethically produced goods to be more costly, hence less attractive for many buyers are questioned and converted as Freestone and McGoldrick’s (2008) findings supports that if customers are convinced of the products ethical credentials, there is now a widespread will-ingness to pay premium prices. Similarly, according to Regulatory Focus Theory (Higgins, 1997), different types of information affect customers differently. Customers with a promo-tion-focus are particularly sensitive to the presence or absence of a positive outcome, while a prevention-focus customer is particularly sensitive to the presence or absence of negative outcomes. When a product or service matches the regulatory orientation, people experiences fit and are willing to pay more for such purchase (Avnet & Higgins, 2006).
By looking at demographics, psychological and behavioural aspects Barbaro-Forleo, Ber-geron and Laroche (2001) investigate what consumer segments that are willing to pay more for environmentally friendly products. Their findings suggested that the segment likely to pay more for environmentally friendly products is females, married and with at least one child living at home. Further, they found it proper to state that the segment of customers willing to pay more for environmentally friendly products, 13.1 %, ought to be sufficiently large to gain marketers attention. Another important finding from their research is that cus-tomers who consider environmental issues when making a purchase are more likely to spend more on green products. Up to 80 % of their respondents claimed to boycott products from companies accused of polluting.
“Environmental concern refers to the degree to which people are aware of problems regarding the environment and support efforts to solve them and/or indicate a willingness to contribute personally to their solution” (Dunlap & Jones, 2002, p.485). Awareness may, as well as knowledge, be an important in-gredient that influences all phases in the decision making process. Initially, knowledge is rel-evant for the consumer’s process of gather and organise information (Alba & Hutchinson, 1987), the level of needed information for the decision making (Brucks, 1985) and how the customer evaluate products and services (Murray & Schlacter, 1990).
Whether a person is aware of a decisions’ sustainable or ethical dimension one can consider the issue-related factors of the decision (Crane & Matten, 2010). Crane and Matten (2010) explains in their book about the moral framing and moral intensity, which can explain if a person recognise the moral nature of a decision and the way to act upon it. While moral framing largely focus on the way a problem is communicated which may result in biased understanding, the moral intensity consider the relevance of the problem to the actual deci-sion maker. As proposed by Jones (1991), this intensity may vary according to the six fol-lowing factors: (1) ‘Magnitude of consequence’, where the decision maker estimates the ex-tent of harm or benefits the decision will have on others impacted by the decision. (2) ‘Social consensus’ occurs when a group of people or a society express a clear opinion about the ethical level of a decision. When social consensus is high, decision makers will more likely act according to the social approval. (3) ‘Probability of effect’ will intensify the moral judg-ment depending on, from the decision makers view, the probability of the harm and benefits to actually occur. (4) ‘Temporal immediacy’ refers to the timeframe of which the decisions consequences are likely to have effect. (5) ‘Proximity’, deals with the decision maker’s per-ceived social, cultural, psychological or physical nearness to the affected people or context
decisions consequences will have substantial impact on a few or very little impact on many. These factors may all more or less impact the decision makers to act in a sustainable manner or not.
2.9.1 Corporate Sustainability
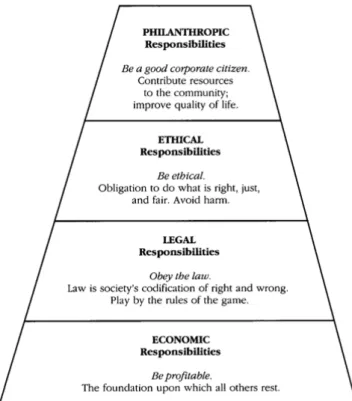
The pyramid of corporate social responsibility (Carroll, 1991) visible in Figure 2.9.1.1 pro-vides a helpful sketch to understand the components of corporate social responsibility. The pyramid was developed by Carroll (1991) and comprises the economic, legal, ethical and philanthropic responsibilities of businesses. The economic step creates the foundation for the remaining steps to build on. The economic responsibilities are essential in the way that a business cannot continue to operate if it is not financially efficient and profitable. The legal step in the pyramid should truly be seen as parallel to the economical responsibilities as it constitutes the playground for companies agreed upon by society, unfortunately this is not always the case. The next step for businesses to consider deals with societies unwritten rules and expectations. Even though laws are supposed to embody fair and justice practices there may be societal members or groups that has other values that are not secured by any law. This step does then expand the previous step whenever ethical agreements become big enough to form a new law. Consequently, ethical responsibilities are continuously placing higher expectations on businesses. The last and highest step of the pyramid concerns phil-anthropic responsibilities, which are more voluntarily, or optional in nature even though they may be expected or desired from society. A company engaging in philanthropic responsibil-ities are considered a good corporate citizen (Carroll, 1991).
Figure 2.9.1 Pyramid of Corporate Social Responsibility
2.10 Research on sustainability within food
The growing concern for environmental and social costs in relation to food production are further associated with wider changes in attitudes that has been analysed through ‘reflexive consumption’ (Giddens, 1991). Reflexive consumption explains how people perceive them-selves as active, discerning consumers, whose choices contribute to their sense of identity. Hence, customer’s purchase does not only cover their basic biological needs, but is also a way of self-expression and improve of psychological well being. Some examples of issues that influence people's behaviour towards food selection is health, fitness activities and cul-tural and ethical concerns, as people consume images and ideas as well as the basic nutritional content of food (Casey, 2009; Lee, Lowe & Phillipson, 2008).
The increased concern about the social and environmental consequences of the consumers attitudes and the raising interest in healthier lifestyles, have created large changes throughout the food chain, from the producer to the retailer (Aliguer, Falguera & Falguera, 2012). Ball, Lang, Pretty and Morison (2005) have when calculated on the environmental costs of the UK food basket, found that farm externalities, domestic road transport to retail outlets, do-mestic shopping transports and subsidies are the main contributors to an estimated hidden cost of £2.91 per person per week (11,8% more than the price paid). They claim that reducing farm and food mile externalities and change consumers shopping preferences and transpor-tation habits could reach a significant environmental improvement.
Although promoters of green consumerism hope to reduce environmental exploitation cre-ated by the increasing global consumption, a British survey reveals that a vast majority, 93 %, of organic food consumers are motivated by health reasons and/or because organic food is better for the children (Greenhalgh & Hutchins, 1997). Only a minority, 30 %, indicated some environmental concern as a reason for organic food purchase.
Butler, Chambers, Harvey, Lobb and Traill (2007) studied food consumer’s behaviour to-wards local, national and imported food. Findings revealed that even though there was a generally positive attitude for local food, few reported to buy it. Results reported the main barriers for actual purchase to be price and inconvenience. Although, consumers perceive locally produced food to be more nutritious, tasty and safe (Seyfang, 2004), there are groups of concerned consumers who rate basic product qualities and moral and health concerns to be more important than the origin of the food product (Allinson, Tregear & Weatherell, 2003). Further, by their study of customer preferences of apples, Denver and Dejgaard Jen-sen (2014), suggest that respondents who recognise the benefits of organic products have relatively high preferences of both organically and locally produced apples. However, re-spondents who recognise the benefits of locally produced products have high preference for domestically and locally produced apples but not for organic apples.
2.11 Research on sustainability within apparel
Similarly to the food industry, clothing customers are becoming increasingly aware of the environmental consequences of their purchases, as well as the impact on the workers who produce the products (Carrigan & Pelsmacker, 2009). When purchasing apparel, the con-cerned consumer is considerate against sweatshops, child labour, fair trade, fair wages, ex-ploitation of natural resources and harmful production activities (Bray, Johns & Kilburn, 2010; Attalla & Carrigan, 2001). Recent studies has further recognised the later stages of clothing consumption and studied how clothes are disposed of and concluded that there is a clear lack of customer knowledge within this field of environmental impact (Birtwistle & Morgan, 2009)
Dickson and Hustvedt (2009) intended to further identify the organic apparel customer. Their main contribution is the creation of a psychographic profile for consumers interested in purchasing blended organic cotton apparel. The segment of consumers they found to be most interested had a positive attitude to organic and sustainable agriculture and was more concerned than others about the impact the clothing production had on the environment. That segment also preferred to buy locally and perceived themselves as environmental, or-ganic, and socially responsible consumers. Although, Dickson and Hustvedt (2009) could also conclude that supporting organic farming in general was more important to customers than supporting organic cotton farmers or pro-environmental apparel companies in particu-lar.
Continuing on Dickson and Hustvedt’s study (2009), it revealed an unexpected relation be-tween buying organic cotton apparel and the recipient's perception of improved personal health or the health of his or her family. The researchers found it surprising as manufacturers and retailers of organic cotton apparel not usually market their products in association to health beneficial outcomes. Nonetheless, their results may suggest that organic cotton ap-parel industry are benefitting from the health benefits associated with organic food. With regard to that self-beneficial reason for buying organic apparel, neither did Dickson (2000) find altruism to be a strong support for buying from socially responsible apparel business. On the contrary, Garvill and Nordlund (2002) identified a significant relationship between altruistic values and environmental behaviour.
Continuously, although women are more likely than men to purchase organic apparel, par-ticularly for their children (The Hartman group, 2007), mothers were unwilling to pay more for the organic apparel (Cao, Gam, Farr & Kang, 2010). In fact, fabric qualities were ex-pressed to be the main reason for the majority of the mothers who bought organic cotton apparel for their children. Other researchers depicting the sustainable apparel consumer have shown that price and quality are better predictors than income level (Mandese, 1991). Also, recent research shows that customers who consider the environmental impacts base their decision on product qualifications rather than price (Barr, Ford & Gilg, 2005). On the other hand, Lin (2010) found no significant effect of gender, age, education level, income or eth-nicity on willingness to pay a price premium for organic cotton. Hence, it is possible to say that there are contradicting meanings of demographic variables, which makes them uncertain to decide in relation to the organic apparel customer.
Not focusing on demographics, Ellis, McCracken and Skuza (2012) found that the average participant in their study were willing to pay a 25% premium for an organic cotton t-shirt over the visibly similar t-shirt made from conventionally produced cotton. They could also conclude that customers who purchase organic food were willing to pay less for the conven-tionally produced cotton t-shirt but more for the organically produced cotton t-shirt. A sim-ilar relation has been discovered earlier by Lin (2010), that organic apparel customers are also purchasing organic food.
Another influence to buy organic apparel might be for social approval (O’Cass, 2001). Few organic apparel consumers consider only the organic feature without reflecting over the ap-parels’ appearance. Even for organic purchases the following qualities are considered before the purchase: texture, style, colour, fit, smell, price and durability (The Hartman Group, 2007).
2.12 Conceptual Framework and Hypotheses
From studying and interpreting the existing literature on sustainability, consumer behaviour and other models, the following summary will in short explain the underlying reasoning for the four hypotheses presented after the summation.
To begin with, since the discretionary income emerged there has been an increased con-sumption of products and services. In recent time has also Fairtrade concon-sumption increased (Fairtrade Sverige, 2013). The combined realisation of a present information society (Huang & Rust, 2011)and that the concept of sustainability is classified as a mega trend by Lubin and Esty (2010) gives the authors confidence to believe it exists a general awareness of sus-tainability and the consumptions effect on the three pillars. People’s awareness has further influenced the food industry in relation to sustainability through a rising interest in healthier lifestyles (Greenhalgh & Hutchins, 1997, Aliguer et al., 2012). Even the apparel industry has been affected by the health wave, but research on organic apparel has also shown that organic agriculture in general is more important than for apparel exclusively (Dickson & Hustvedt, 2009). Although, people tend not to live as they learn when it comes to sustainable purchases Butler et al., (2007). For apparel there are still other attributes that precede the sustainable criteria (The Hartman Group, 2007). For food there remains barriers of price and inconven-ience with regard to sustainable alternatives (Butler et al., 2007).
Hypothesis 1: There will be a majority of respondents of the survey claiming they are aware
customers.
Hypothesis 2: There is a difference in sustainability demand between food and apparel.
Hence, there is a difference in customers’ sustainability demand between convenience goods and shopping goods.
Hypothesis 3: The test values of attitudes towards importance of sustainability within both
food and apparel will be greater than the values of respondents admitting actual purchase of sustainable products within the industries.
Hypothesis 4: For any analysed segment groups the difference between their means of
3 Methodology
The following section will explain the design of the thesis, chosen method and the implementation, through discussing and explaining methodological choices made, evaluating alternative methods and describe how in-formation will be conducted.
3.1
Choice of method
Two approaches, which can be used in order to conduct a thesis, are described by existing literature as inductive and deductive.
3.1.1 Inductive approach
An inductive approach starts by collecting data and then connects this data with relevant theory (Jacobsen, 2002). The collection of data has to be supported by the earlier gathered knowledge by the researcher, requiring competent knowledge in the subject area at forehand. This approach rejects positivism and models of the natural scientific model, rather it relies more on how individuals interpret their social world (Bryman & Bell, 2011). It is a beneficial approach in the way it is not bounded to theory, thus it opens up for more possibilities. However, as it is not relying on theory it can lead the author astray without reaching a con-clusion.
3.1.2 Deductive approach
On the other hand, in a deductive approach the researcher begins by looking at existing theory and from that theory develop one or more hypotheses, which will work as a guidance to collect further information and empirical data (Bryman & Bell, 2011, Saunders et al., 2009). Figure 4.1.2 below provides an overview of the typical process for a deductive approach to research. The approach integrates practices and norms of the natural scientific model (Bry-man & Bell, 2011). It is also an advantageous approach when there is an abundance of liter-ature and theories to find within a topic. It is often seen as a more solid and infallible ap-proach as it rarely leaves the author astray (Bryman & Bell, 2011). However, it might limit the author’s thoughts to theory.
Figure 3.1.2 Deductive approach
(Research Methodology, 2015)
To conclude, a deductive approach is more suitable for this kind of study as it generates a more natural relationship between theory and research (Bryman & Bell, 2011). Also, there is an abundance of literature to find within the topic of sustainability, which can provide a good support for further investigations. Additionally, this approach is usually associated to be less time-consuming and entails less risk as it relies on existing theory (Bryman & Bell, 2011).
3.1.3 Quantitative research
When conducting the research there are two methods that can be used, quantitative and qualitative research. Many authors draw a distinction between qualitative and quantitative research, which can be helpful when deciding method to use. The quantitative method is derived from numbers and is a structured way of collecting peoples’ opinions (Saunders et
al. 2009). The research is essentially based on the collection of data and numerical conclu-sions in order to explain a particular phenomenon. Analysis in this type of research is con-ducted through the use of diagrams, charts and statistics (Saunders et al. 2009). This is a good method when the purpose of the research is to analyse characteristics of a population. Alt-hough the broad nature of the approach provides good measures for general conclusions, the drawback is that it does not provide deeper knowledge of underlying reasons for specific behaviour.
3.1.4 Qualitative research
The opposite way is to produce a qualitative method, which is a more in-depth approach. The qualitative method is based on meanings expressed through words rather than numbers. A qualitative research does not only focus on what people think, but also investigates the ‘why’ and underlying reasons. It is emphasising an understanding of people’s view and mo-tivation. The research is based on smaller but more focused samples. This data collection results in non-standardised data that is complex in its nature, which need to be summarised (Saunders et al., 2009). This often requires classification of data into categories and groups that then can be analysed in a meaningful way. The analysis is often conducted through the use of conceptualisation (Saunders et al., 2009). The qualitative research is often seen as a demanding option that requires large efforts in the analytical process when analysing and restructure data (Saunders et al., 2009).
This study used a quantitative method due to several reasons. The research question involves measuring the overall demand of customers, therefore a larger sample is more appropriate in order to reach an accurate result. Also, this choice of method gives a good view of what people think in general as it works as a cross-section of the population and thus creating a good overview of people’s opinions (Bryman & Bell, 2011). Furthermore, the research
ques-tion is based on ‘what’ people think, not ‘why’, therefore it is neither relevant nor necessary to exercise a more focused method in to fulfil this study’s purpose.
3.2
Implementation
The collection of data can be categorised into two categories, primary and secondary. The primary data is collected by the investigator, directly from the source of information such as persons. The secondary data is already collected data by someone else than the user (Jacob-sen, 2002).
3.2.1 Primary data
The primary data can be collected through the usage of different methods such as observa-tions, group interviews and questionnaires (Jacobsen, 2002, Saunders et al., 2009). In this study the empirical data has been collected through a questionnaire. The questionnaire was made to create a cross-section of the population and provide an overall understanding of customers’ attitude. The design of the survey contained two parts, were focus in part one was to primarily capture the attitudes, and secondarily the behaviour of customers. The main reason for this was that to some extent be able to compare what customers think with what they actually do, and thus create a higher credibility for the thesis. Focus in part two was to acquire information about the customer itself. This to investigate if common demographic factors could be reasons for their attitude and behaviour. This is not essential to the study’s purpose but was made for exploratory reasons to provide indications on possible relation-ships between segments and different customer demands.
Furthermore, the survey included three types of questions: multiple-choice questions, se-mantic differential scale questions and one open question. The majority of the questions were of the type semantic differential scale, ranging from 1 – 6. This type of design has no middle selection and requires the person to choose one side over another, which is valuable when capturing people’s attitude and behaviour. The open question had the function of in-tercepting people’s personal opinion to provide further dimension to the thesis that would otherwise not have been brought up. The survey was further structured with a general ques-tion in the beginning in order to explore the initial setting of each respondent, invite to the topic and activate their mind towards their own attitudes and behaviour.
The questionnaire was conducted both as an online survey, but also as a physical survey handed out directly to persons. The online survey was created using the online survey tool, Google Forms, which is an online survey tool created by Google. The survey can be found in the appendix. The reason for why this survey was given out through two different chan-nels, online and non-online, was because of the character of the research question. This study aims to measure the overall demand of customers, not targeting a specific segment. In order to reach out to as many segments as possible the survey had to be available for everyone. Therefore, factors such as place and time played an essential role when conducting the survey in general but for the physical survey in particular. The online survey was spread out through social media with the objective to gain a high amount of respondents and thus create validity for the research. The non-online survey was executed at various places and times, in order to cover as many segments as possible and thus create validity for the research. The survey was handed out at grocery stores, town centres and shopping centres at different dates and different times of the day.
In total 93 copies of the non-online survey was carried out. The first 46 copies were collected on a regular weekday from 10 - 12 a.m. at three different positions, a shopping centre, a town square and a grocery store. The last 47 copies were collected on a weekend from 1 p.m. - 3 p.m. at the same three positions mentioned above. The respondents were randomly selected by choosing every fifth person passing the investigator. By following this procedure it en-sured total randomness and reliability for the research.
3.2.2 Secondary data
Secondary data can be collected through literature review, by gathering information from journals, articles and books (Jacobsen, 2002). The literature for this study has been selected based on research area and relevance to the topic. The following keywords; consumer behaviour, sustainability, consumer preference, risk behaviour, apparel industry, food industry, consumer demand and customer research has all been used both individually and in combination with each other. Sev-eral different databases have been used in order to find accurate and suitable literature for this kind of topic. The following databases have been used, Google Scholar, ScienceDirect, SAGE, Emerald, Elsevier, Google Books, OECD library and Oxford Journals. The search generated a substantial base of scientific articles that were selected for further evaluation. The articles were then evaluated based on relevance, scope and contribution. Lastly, they were read more carefully and summarised to provide a better overview for the authors.
Physical sources such as books have also been of use. With professional help from the Uni-versity library at UniUni-versity of Jönköping, Sweden, accurate books within research methods and consumer behaviour could be found and used optimally.
3.3
Design of the questionnaire
The survey was designed to cover all relevant aspects of the research area to fulfil the purpose of the study. This was done by a variety of different steps, focusing on structure and design of the survey. The survey had to be concise and effective as well as it had to be short enough to attract many respondents, but also long enough to provide all the necessary data. There-fore, different versions of the survey were pilot tested in length and accuracy in order to find a good balance.
3.3.1 Pilot tests
According to Oppenheim (2010) pilot tests is a necessary step in the design process. This is due to several reasons. One, it will show how a variable will be perceived in the field and thus give the author important information regarding the structure and design of the ques-tionnaire. Two, the pilot test indicates how a variable, defined for this study’s purpose, can be measured in the field in the best possible way. Three, it can also show if further refinement in definition is required. Oppenheim (2010) states that an author never should shrink an opportunity to improve a dependent variable to be more precise and robust, as it reduces the risk of misinterpretations.
3.3.2 Structure
For this study to fulfil its purpose the survey had to be designed to provide data that either accepted or rejected the stated hypotheses. Therefore, the hypotheses had an essential role in the process of designing and shaping the survey questions.
As mentioned earlier, the survey was divided into two parts, which could further be divided into two sections for each industry. Section one was conducted to catch peoples’ attitudes and thereby provide essential data to fulfil the purpose of the study, if there are differences in sustainable demand or not. Section two is secondary and is focusing on actual behaviour of the customer to provide a further dimension for the study. In both sections though, the three pillars of sustainability provided a basis for the questions. Each pillar has two associated questions concerning attitude and one question concerning actual behaviour. Not to forget, to actually be able to compare the industries and goods, part one was duplicated in the way the same questions was asked both for the food industry and the apparel industry.
Furthermore, to provide a broader perspective of the topic, extended knowledge of the re-spondents’ self-perception and their perception of sustainability were collected through the general opening question and the later open-ended question.
Part two in the survey was conducted for exploratory reasons to provide extended infor-mation concerning the segments participating in the research. These questions were designed to acquire information about the respondents themselves. Although existing theory provided inspiration for the questions in part two, they were not essential to the purpose of the thesis other than providing the authors with data that could lead to interesting relationships, rec-ommendations for companies and indications for further research.
3.3.3 Scales
In part one, the majority of questions was measured using a semantic differential rating scale, with a scale item ranging from 1 – 6. This was due to several reasons, a scale item from 1 – 6 gives the respondent no middle selection, instead it has to choose one side over another and thus show his or her attitude in the question. By using this kind of scale, the questionnaire
provides better and more usable information, as the respondent has to make a stance in each question.
The bipolar scales were measured as 1 as the non-agreeable value and 6 as the total-agreeable value. The values took shape in three different forms depending on question. Option 1 dif-fered between three following values; not at all, unimportant and no items, while option 6 differed between the three values; very much, very important and all items.
3.3.4 Translation
The questionnaire was originally prepared and executed in Swedish and then the result has been translated into English. According to Saunders et al. (2009), translation has a significant importance to the quality and the perception of the study, since a badly translated question-naire may lead to misinterpretations and unreliability. Furthermore, the result has to be trans-lated correctly in order to avoid distortions that may affect the outcome of the study. Usunier (1998) suggests three aspects to consider when translating questionnaires. The first is con-cerning the ‘lexical meaning’, where focus is on the precise meaning of individual words. The second regards ‘idiomatic meaning’ which focuses on the meaning of a group of words. The third, ‘experimental meaning’, which focus on the equivalence of meanings of words that people use in their everyday life and how words are interpreted. These three aspects were taken into consideration when translating the results, ensuring reliability and correctness of the thesis.
3.4
Data analysis
The purpose of the data analysis is to sort out the large amount of data and make it useful, in other words, to turn it into information that can be used to draw any conclusions (Saun-ders et al., 2009). Quantitative data in raw form, which means data that have not been pro-cessed and translated into information, convey no meaning to most people, therefore these data need to be processed in order to be valuable and analysed (Saunders et al., 2009). In order to analyse the data, there are several techniques to be used such as diagrams, charts, graphs and statistics, which all can help explore, present, describe and examine relationships and trends within the data.
The authors of this study chose to use quantitative research approach, implying numerical data or data that can be quantified to answer the research questions. Quantitative data refer to all such data, it can range from smaller counts such as frequency of occurrences to more complex numbers such as test scores. (Saunders et al., 2009).
3.4.1 Transformation of data
After the questionnaire was conducted, both the online part and the non-online part had to be put together. This was done by computing all answers into an excel file were a simple data matrix was used in order to organise the data. Each row represented and contained data from one survey, consequently each column represented and contained one question of the survey. The data had also to be translated into numbers in order to be able to calculate it in the analytical software program SPSS. Therefore, the different alternatives in each question that contained letters had to be translated. This was done by replacing the text answer with a number for each alternative, for example:
1 = “Male” 2 = “Female”