Marine tourism and recreation
in Sweden
A study for the Economic and Social Analysis of the Initial
Assessment of the Marine Strategy Framework Directive
Marine tourism and recreation in Sweden
A study for the Economic and Social Analysis of the Initial Assessment of the Marine Strategy Framework Directive
Enveco Environmental Economics Consultancy
(Tore Söderqvist and Åsa Soutukorva)
DHI Sweden
(Patricia Moreno-Arancibia, Olof Liungman and Nick Ahrensberg)
Resurs AB
(Lars Paulsson)
Swedish Agency for Marine and Water Management, report 2012:2 Havs- och vattenmyndighetens rapport 2012:2:2
Havs- och vattenmyndigheten Datum: 2012-09-06
Ansvarig utgivare: Björn Risinger ISBN 978-91-87025-02-0 Havs- och vattenmyndigheten
Foreword
The tourism sector currently accounts for a significant portion of the Swedish economy, specifically marine-related recreation and tourism. This report provides an overview of the activities that can be classified under marine recreation and tourism and how they depend upon and impact our marine ecosystems. The development of the environment in marine areas is crucial for the possibility of future generations to enjoy recreation in these areas. The report describes how various activities may be affected in the future, along with the values that represent the people and Sweden in general.
Within Europe, the efforts to implement new legislation around the marine environment have begun in earnest. In order to gather all maritime activities into a single framework, the EU has formulated a maritime strategy designed after three main directions: the Common Fisheries Policy, marine spatial planning, and common environmental legislation for the marine environment. The common environmental legislation has been formulated within the EU Marine Strategy Framework Directive (2008/56/EG) which was introduced into Swedish legislation through the Marine Environmental Regulation (SFS 2010:1341).
In Sweden, marine issues received a new home on 1 July 2011 with the creation of a new, central administrative authority, the Swedish Agency for Marine and Water Management. The new agency will use an integrated approach in working with issues pertaining to water, marine, and fisheries management. The introduction of the Marine Strategy Framework Directive (MSFD) in Sweden and the development of marine spatial planning will become central to operations in the coming years.
As a first step in Sweden’s work with MSFD, an initial assessment of the marine environment’s status has been conducted and assembled into “Good
Environmental Status 2020 – Part 1: Initial Assessment of the State of the Environment and Socio-economic Analysis.” As the name suggests, the assessment gives an overall picture of the current state of the environment. It also describes the socio-economic importance of the different activities and operations currently in progress in marine areas as well as the stresses they generate on the ecosystem.
The report “Marine Tourism and Recreation in Sweden” is an important part of the documentation produced by the Swedish Agency for Marine and Water Management for the initial assessment. The connection made in the report between tourism and recreation and related ecosystem services provides a good overview of the impact on the marine ecology while it illuminates the sea’s importance to human activities such as recreation.
Förord
Turistsektorn utgör idag en betydande andel av den svenska ekonomin med den rekreation och turism som sker på eller i anslutning till havet som en viktig komponent. Denna rapport ger en bild över de aktiviteter som kan sorteras in under begreppet marin turism och rekreation och hur de är beroende av, och samtidigt påverkar, ekosystemen i våra hav. Utvecklingen av miljön i
havsområdena är avgörande för framtida generationers möjlighet till
rekreation vid havet. I rapporten beskrivs hur olika aktiviteter kan komma att påverkas i framtiden tillsammans med de värden som detta representerar för människorna och Sverige i allmänhet.
I Europa har arbetet med att genomföra ny lagstiftning på havsmiljöområdet inletts på allvar. Med syfte att samla all maritim verksamhet i ett och samma ramverk har EU formulerat en maritim strategi som utformats efter tre huvudriktningar; gemensam fiskeripolitik, fysisk planering till havs samt gemensam miljölagstiftning för den marina miljön. Den gemensamma miljölagstiftningen har formulerats i Havsmiljödirektivet (2008/56/EG) som omsatts i svensk lag genom Havsmiljöförordningen (SFS 2010:1341).
I Sverige fick de marina frågorna en ny hemvist 1:e juli 2011 genom inrättandet av en ny central förvaltningsmyndighet, Havs- och vattenmyndigheten. Den nya myndigheten ska arbeta på ett integrerat sätt med vatten-, havs och fiskförvaltningsfrågor. Införandet av havsmiljödirektivet i Sverige, samt
utvecklingen av den marina fysiska planeringen kommer att vara centrala delar av verksamheten under de kommande åren.
Som ett första steg i det svenska arbetet med Havsmiljödirektivet har en inledande bedömning av havsmiljöns tillstånd gjorts, God miljöstatus 2020 – Del 1: Inledande bedömning av miljötillståndet och socioekonomisk analys. Som namnet antyder ger den inledande bedömningen en bild av det nuvarande miljötillståndet. Den beskriver också den samhällsekonomiska betydelsen av olika aktiviteter och verksamheter som pågår i våra havsområden idag, samt den belastning på ekosystemen som nyttjandet ger upphov till.
Rapporten Marine tourism and recreation in Sweden är en viktig del i det underlag som tagits fram av Havs – och vattenmyndigheten för den inledande bedömningen. Kopplingen som görs i rapporten mellan turism och rekreation och berörda ekosystemtjänster ger en bra bild över påverkan på den marina ekologin samtidigt som den belyser havets betydelse för mänskliga aktiviteter som exempelvis rekreation.
INNEHÅLL
0 SUMMARY ... 7
1 INTRODUCTION ... 16
1.1 Background and methodology ... 16
1.2 Swedes’ recreation in or at the sea ... 20
2 DEFINITIONS ... 22
2.1 Tourism ... 22
2.2 Tourism sectors of economic activity ... 22
2.3 The ecosystem service of recreation ... 24
2.4 Total economic value (TEV) ... 27
3 USE OF MARINE WATERS ... 28
3.1 Sector A. Cruise-ship traffic ... 28
3.2 Sectors B-D. Other passenger ship traffic ... 29
3.3 Sector E. Leisure boating ... 29
3.4 Sector F. Holiday housing ... 30
3.5 Sector G. Commercial accommodation ... 32
3.6 Sector H. Same-day visits ... 33
3.7 Employment effects of sectors E-H ... 33
3.8 Summary for all sectors A-H ... 34
4 ECOSYSTEM SERVICE ANALYSIS ... 37
4.1 Sectors’ dependence on recreation ... 37
4.2 Recreation’s dependence on intermediate ecosystem services ...38
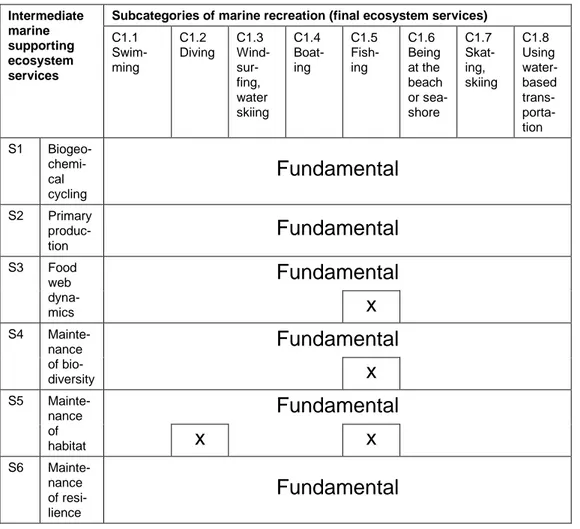
4.2.1 Supporting ecosystem services ... 39
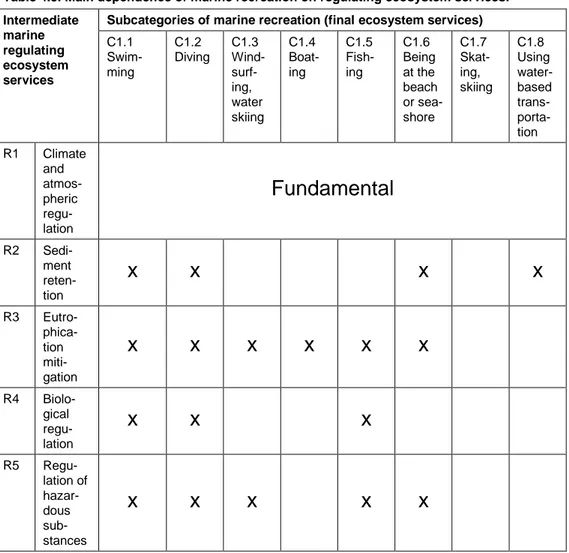
4.2.2 Regulating ecosystem services ... 41
4.2.3 Provisioning ecosystem services ... 43
4.2.4 Cultural ecosystem services ... 44
4.2.5 Conclusion ... 46
4.3 Status of ecosystem services ... 46
4.3.1 Linking selected intermediate ecosystem services to GES descriptors and indicators ... 46
4.3.2 Status of selected indicators and ecosystem services ... 52
4.4 The impact of tourism sectors on selected indicators ... 64
4.4.1 D5 Eutrophication ... 64
4.4.2 D8 and D9 Contaminants ... 65
4.4.3 D10 Marine litter ... 66
4.5.1 General driving force: Economic development ... 67
4.5.2 Specific driving forces ... 68
4.5.3 Summary ... 75
4.6 Trend for selected indicators and ecosystem services to 2020 and 2050 ... 77
4.6.1 Short-term trend to 2020 ... 77
4.6.2 Long-term trend to 2050 ...83
4.6.3 Impact of trends in marine recreation on selected indicators ... 84
4.7 What does BAU imply for the development of tourism sectors A-H? 84 5 TEV OF CHANGES IN RECREATIONAL OPPORTUNITIES... 88
5.1 Objective and scope of analysis ... 88
5.2 Literature review ... 88
5.3 Presentation of valuation studies and their relevance for GES ... 92
5.3.1 Östberg et al. (2010) ... 92
5.3.2 Östberg et al. (2011) ... 93
5.3.3 Söderqvist et al. (2005) ... 93
5.3.4 Vesterinen et al. (2010) ... 95
5.4 Summary of valuation findings ... 96
6 COST OF DEGRADATION ... 97
7 CONCLUDING DISCUSSION ... 101
0
Summary
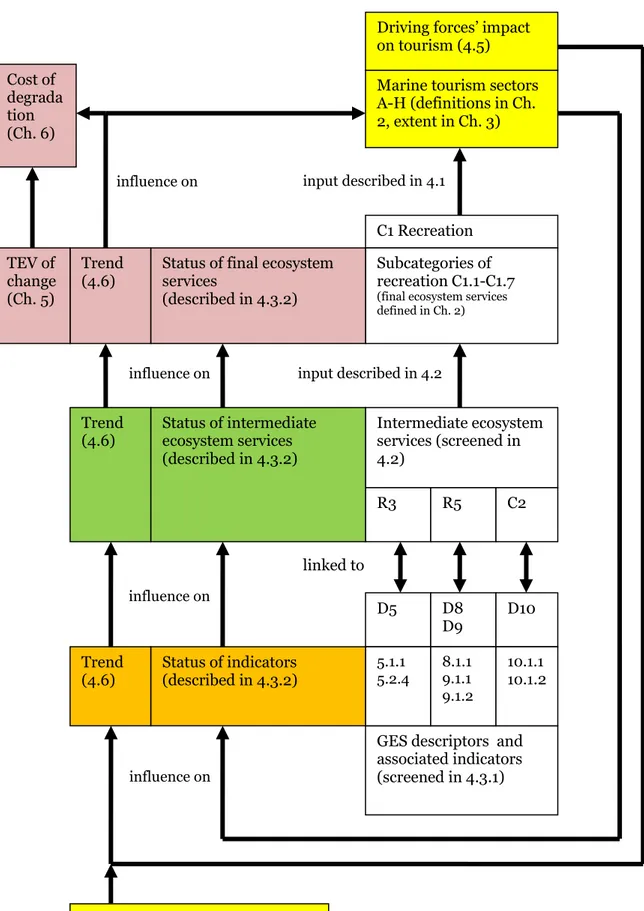
This report provides input regarding the marine recreation and tourism components of the ecosystem service approach to the Economic and Social Analysis of the Initial Assessment of the EU Marine Strategy Framework Directive. The main content of the report is the following. See also Figure 0.1 for an illustration that also provides an interpretation of the report in terms of the Drivers-Pressure-State-Impact-Response (DPSIR) framework.
Chapter 1 presents the general methodology followed in the report. It also gives
an introduction to Swedes’ recreation in or at the sea.
Chapter 2 presents a number of definitions related to marine recreation and
tourism. Six sectors of marine tourism are identified: A. Cruise-ship traffic in marine waters
B. International passenger ferry traffic in marine waters C. National passenger ferry traffic in marine waters
D. Other commercial passenger transportation in marine waters E. Leisure boating in marine waters
F. Holiday housing associated with marine recreation
G. Commercial accommodation (e.g. hotels, camping sites, etc.) associated with marine recreation
H. Same-day visits associated with marine recreation
For sectors A-E, the connection to marine waters is unambiguous since the activities in these sectors take place in marine waters. Sectors F-H have a less direct connection but are still relevant to include because a substantial proportion of these sectors is likely to depend on the enjoyment of marine recreation. However, including sectors F-H requires a reasonable and objective delimitation of these sectors. It was chosen to use two alternative geographical definitions for these sectors; one (called MAX) that is likely to result in an overestimate of the sectors in relation to their association with marine
recreation and one (called MIN) that is likely to result in an underestimate. The MAX definition is to include those parts of sectors F-H which are located in Swedish coastal municipalities or on islands in marine waters. The MIN definition is to include those parts of sectors F-H which are located in sub-drainage basins that drain directly into coastal or transitional water bodies (typology from the Water Framework Directive, 2000/60/EG)
(delavrinningsområden som avvattnas direkt till kustvattenförekomster eller
Marine tourism sectors A-H (definitions in Ch. 2, extent in Ch. 3) C1 Recreation Subcategories of recreation C1.1-C1.7
(final ecosystem services defined in Ch. 2) input described in 4.1 Intermediate ecosystem services (screened in 4.2) input described in 4.2 R3 R5 C2
GES descriptors and associated indicators (screened in 4.3.1) D5 D8 D9 D10 linked to 5.1.1 5.2.4 8.1.1 9.1.1 9.1.2 10.1.1 10.1.2 Status of indicators (described in 4.3.2) Status of intermediate ecosystem services (described in 4.3.2) Status of final ecosystem services (described in 4.3.2) influence on influence on Trend (4.6) Trend (4.6) Trend (4.6) influence on on tourism (4.5)
Other factors, e.g. other nutrient sources than tourism (4.6)
influence on TEV of change (Ch. 5) Cost of degrada tion (Ch. 6)
Based on the classification of marine ecosystem services in Garpe (2008) and SEPA (2009) and a survey of people’s use of marine waters (SEPA, 2010a, 2010b), Chapter 2 identifies the following seven subcategories of the ecosystem service C1 Enjoyment of recreational activities:
C1.1 Swimming
C1.2 Diving
C1.3 Windsurfing, water skiing
C1.4 Boating
C1.5 Fishing
C1.6 Being at the beach or seashore for walking, picnicking, sunbathing, visiting touristic or cultural sites, etc. C1.7 Using water-based transportation
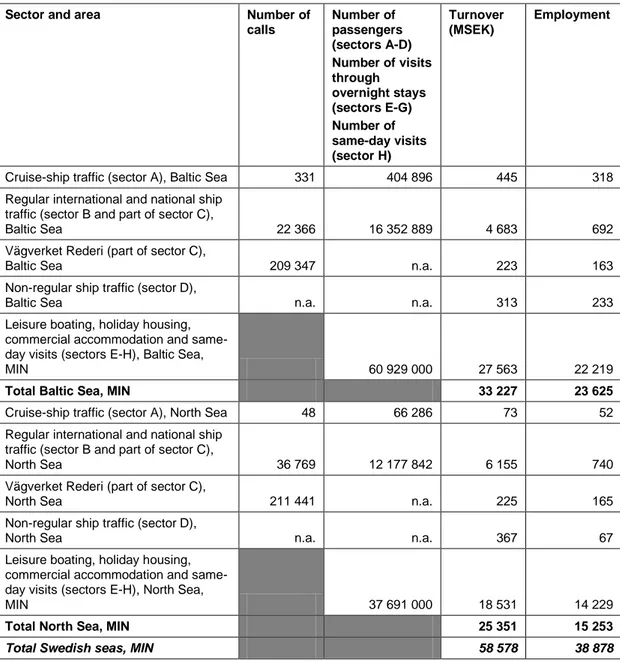
Chapter 3 describes the extent of use of Swedish marine waters by the sectors
of marine tourism. The findings are summarized in Tables 0.1 and 0.2, where the former is based on the MIN definition for sectors E-H and the latter is based on the MAX definition for these sectors. When interpreting the figures, note that turnover and employment are defined differently for the different sectors: For sector A, they are about passengers’ expenditures ashore and the jobs these expenditures create; for sectors B-D, turnover and employment are for the companies found in these sectors – for employment this implies an underestimation because a substantial part of the employment is accounted for in the country where ships are registered; and for sectors E-H, turnover and employment are about tourists’ spending when boating, having holiday housing, making use of commercial accommodation and making same-day visits and the jobs associated with this turnover. The tables illustrate the considerable extent of coastal and marine tourism in Sweden. For example, the estimated turnover of this part of the Swedish tourism industry is between SEK 58 578 million (MIN) and SEK 75 153 million. The turnover of the Swedish tourist industry as a whole in 2010 was SEK 255 000 million (Tillväxtverket, 2011), which means that coastal and marine tourism accounted for between 23 % (MIN) and 29 % (MAX) of the total turnover.
Table 0.1. Summary table for the extent of sectors A-H in 2010 for the Baltic Sea and the North Sea, the case of the MIN definition for sectors E-H. Source: Resurs AB (2011a). Sector and area Number of
calls Number of passengers (sectors A-D) Number of visits through overnight stays (sectors E-G) Number of same-day visits (sector H) Turnover (MSEK) Employment
Cruise-ship traffic (sector A), Baltic Sea 331 404 896 445 318 Regular international and national ship
traffic (sector B and part of sector C),
Baltic Sea 22 366 16 352 889 4 683 692
Vägverket Rederi (part of sector C),
Baltic Sea 209 347 n.a. 223 163
Non-regular ship traffic (sector D),
Baltic Sea n.a. n.a. 313 233
Leisure boating, holiday housing, commercial accommodation and same-day visits (sectors E-H), Baltic Sea,
MIN 60 929 000 27 563 22 219
Total Baltic Sea, MIN 33 227 23 625
Cruise-ship traffic (sector A), North Sea 48 66 286 73 52
Regular international and national ship traffic (sector B and part of sector C),
North Sea 36 769 12 177 842 6 155 740
Vägverket Rederi (part of sector C),
North Sea 211 441 n.a. 225 165
Non-regular ship traffic (sector D),
North Sea n.a. n.a. 367 67
Leisure boating, holiday housing, commercial accommodation and same-day visits (sectors E-H), North Sea,
MIN 37 691 000 18 531 14 229
Total North Sea, MIN 25 351 15 253
Table 0.2. Summary table for the extent of sectors A-H in 2010 for the Baltic Sea and the North Sea, the case of the MAX definition for sectors E-H. Source: Resurs AB (2011a). Sector and area Number of
calls Number of passengers (sectors A-D) Number of visits through overnight stays (sectors E-G) Number of same-day visits (sector H) Turnover (MSEK) Employment
Cruise-ship traffic (sector A), Baltic Sea 331 404 896 445 318 Regular international and national ship
traffic including Vägverket Rederi
(sectors B-C), Baltic Sea 22 366 16 352 889 4 683 692
Vägverket Rederi (part of sector C),
Baltic Sea 209 347 n.a. 223 163
Non-regular ship traffic (sector D),
Baltic Sea n.a. n.a. 313 233
Leisure boating, holiday housing, commercial accommodation and same-day visits (sectors E-H), Baltic Sea,
MAX 78 950 000 38 558 31 928
Total Baltic Sea, MAX 44 222 33 334
Cruise-ship traffic (sector A), North Sea 48 66 286 73 52
Regular international and national ship
traffic (sectors B-C), North Sea 36 769 12 177 842 6 155 740 Vägverket Rederi (part of sector C),
North Sea 211 441 n.a. 225 165
Non-regular ship traffic (sector D),
North Sea n.a. n.a. 367 67
Leisure boating, holiday housing, commercial accommodation and same-day visits (sectors E-H), North Sea,
MAX 46 825 000 24 112 19 108
Total North Sea, MAX 30 932 20 132
Total Swedish seas, MAX 75 154 53 466
Chapter 4 provides an ecosystem service analysis that in principle follows the
procedure of a Corporate Ecosystem Services Review (ESR) as designed by WRI (2008). Such a procedure relies heavily on a number of different screenings, e.g. to sort out the most important services in terms of the dependence and the impact of marine tourism sectors on ecosystem services. The ecosystem service analysis in Chapter 4 consists of the following parts:
An analysis how the sectors of marine tourism are depending on the ecosystem service subcategories C1.1-C1.7.
An identification of the following intermediate ecosystem services on whose input C1.1-C1.7 primarily depend:
o R3 Eutrophication mitigation
An identification of the Good Environmental Status (GES) descriptors that are covering each of the identified intermediate ecosystem services and selecting those GES indicators associated with these descriptors that give the most relevant information on the status of the supply of the identified intermediate ecosystem services. This screening resulted in the following list of GES descriptors and associated indicators as defined by COM (2011):
o D5 Eutrophicaton
5.1.1 Nutrient concentration in the water column 5.2.4 Bloom events of nuisance/toxic algal blooms
caused by human activities o D8 and D9 Contaminants
8.1.1 Concentration of contaminants
9.1.1 Actual levels of contaminants that have been detected and number of contaminants which have exceeded maximum regulatory levels
o D10 Marine litter
10.1.1 Litter washed ashore or found along the coast
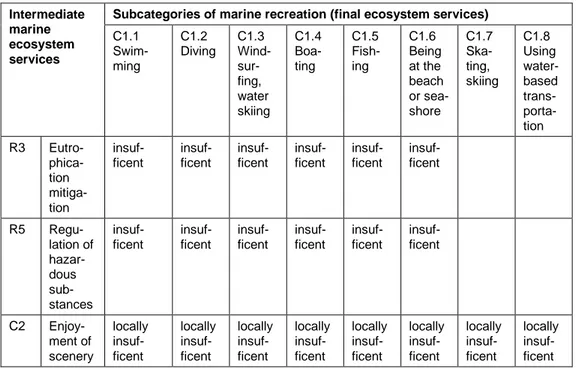
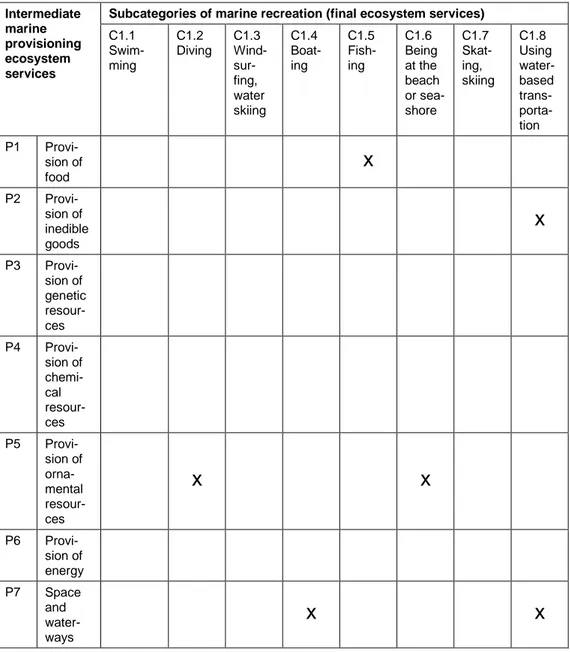
A description of the status of the selected GES indicators and the associated intermediate ecosystem services. As is indicated by Table 0.3, this resulted in the assessment that the marine ecosystems are not providing enough input for having a sustainable supply of the
subcategories C1.1-C1.6, and that the marine ecosystems are locally not providing enough input for having a sustainable supply of C1.7 and C1.8.
Table 0.3. Summary of status assessment for selected intermediate ecosystem services. Intermediate
marine ecosystem services
Subcategories of marine recreation (final ecosystem services)
C1.1 Swim-ming C1.2 Diving C1.3 Wind- sur-fing, water skiing C1.4 Boa-ting C1.5 Fish-ing C1.6 Being at the beach or sea-shore C1.7 Ska-ting, skiing C1.8 Using water-based trans- porta-tion R3 Eutro- phica-tion mitiga-tion insuf-ficent insuf-ficent insuf-ficent insuf-ficent insuf-ficent insuf-ficent R5 Regu-lation of hazar-dous sub-stances insuf-ficent insuf-ficent insuf-ficent insuf-ficent insuf-ficent insuf-ficent C2 Enjoy-ment of scenery locally insuf-ficent locally insuf-ficent locally insuf-ficent locally insuf-ficent locally insuf-ficent locally insuf-ficent locally insuf-ficent locally insuf-ficent
An analysis of the impact of the sectors of marine tourism on the selected GES indicators.
A description of driving forces influencing the sectors of marine tourism and assessing what these forces might imply for the future development of these sectors.
A description of a business-as-usual (BAU) trend for the selected GES indicators and the associated intermediate ecosystem services to 2020 and 2050. It is concluded that the situation in 2020 is likely to be similar to the situation described by Table 0.3. For 2050, it is suggested that the implementation of the Baltic Sea Action Plan might imply improvements in terms of reduced eutrophication effects and less toxic substances in the water and fish. However, the considerable
uncertainties are also emphasized. These uncertainties include what climate change would imply for the effects the proposed nutrient reductions.
A discussion what the BAU trend might imply for the development of the sectors of marine tourism. Until 2020, the sectors that are likely to be primarily affected by a non-sustainable supply of the subcategories of marine recreation are sectors E-H. Sectors A-D are likely to be only locally affected. This is illustrated by Table 0.4. As to the development until 2050, it is concluded that the Swedish marine tourism sectors might benefit considerably from climate change, given that their competitiveness is not diminished because of reduced water quality and/or heavy algal blooms.
Chapter 5 presents findings about the total economic value (TEV) of changes in
recreational opportunities. Based on a literature review, a number of valuation studies are identified that are judged to be useful for valuing recreational activities in the marine environment and their links to GES descriptors and indicators.
Chapter 6 assesses the cost of degradation based on the results of the earlier
chapters. The review of valuation studies in Chapter 5 is used for indicating what GES could imply in economic terms, and conversely also what is lost if BAU is reached instead of GES. The result describes the extent to which different recreational activities is likely to bear the cost of degradation and is summarized in Table 0.5. The table shows that the marine recreation activities that will most likely have to bear a cost of degradation if GES is not reached are swimming, diving, fishing and being at the beach. The recreation activities that seem the least sensitive to a scenario where GES is not reached are boating, skating, skiing and using water-based transportation.
Table 0.4. “No” in the table denotes those subcategories of marine recreation which are not likely to have a sustainable supply in 2020 for BAU. The table also shows what sectors are dependent on each subcategory, based on Chapter 4.
Subcatego ry of marine recreation Sector A. Cruise ship traffic B. Inter- natio-nal pas-senger ferry traffic C. Natio-nal pas-senger ferry traffic D. Other com- mer-cial pas-senger trans- porta-tion in marine waters E. Leisure boating F. Holiday houses G. Com-mercial accom- moda-tion H. Same-day visits C1.1. Swimming No No No C1.2 Diving No No No C1.3 Wind-surfing, water skiing No No No C1.4 Boating No No No No C1.5 Fishing No No No No C1.6 Being at the beach or seashore No No No C1.7 Skating, skiing No, locally No, locally No, locally C1.7 Using water based transportati on No, locally No, locally No, locally No, locally No, locally No, locally
Table 0.5. To what extent would different recreational activities bear the cost of degradation? The table indicates this for different recreation activities based on the activities’ links to GES, according to findings in Chapters 4 and 5.
Descriptors and indicators of GES
Subcategories of marine recreation
C1.1 Swim-ming C1.2 Diving C1.3 Wind-surfing, water skiing C1.4 Boa-ting C1.5 Fishing C1.6 Being at the beach or sea-shore C1.7 Ska-ting, skiing C1.8 Using water-based trans- porta-tion D5 Eutrophication 5.1.1 (nutrient concentration) +++ +++ + + ++ ++ - - 5.2.4 (toxic algal blooms) +++ +++ ++ ++ ++ ++ - + D8 Contaminants 8.1.1 (concen-tration of contaminants) +++ +++ ++ - - + - -
D9 Contaminants in fish and other seafood 9.1.1 (actual levels of contaminants) - - - - +++ - - - D10 Marine litter 10.1.1 (litter washed ashore) ++ + + + + +++ + + Legend:
+++ = the activity is likely to bear the cost of degradation to a high degree ++ = the activity is likely to bear the cost of degradation to a fairly high degree + = the activity is likely to bear the cost of degradation to a low degree
- = the activity is not likely to bear the cost of degradation
Finally, Chapter 7 contains a concluding discussion. It is emphasized that a further development of an ecosystem service analysis as that carried out in Chapter 4 would require ecological-economic studies allowing a more
quantitative analysis. Such studies would preferably include, inter alia, more precise definitions of the various ecosystem services. In this report, a step towards this was taken by dividing the broad ecosystem service C1 Enjoyment of recreational activities to seven subcategories C1.1-C1.7. Further efforts to provide precise definitions of ecosystem services, also other than recreation, would greatly facilitate assessments of the economic (and social) consequences of programmes of measures, such as those PoMs which will be a part of the MSFD implementation. Another effort that would be of great help for such assessments is to define GES indicators that serve as useful links between environmental change and nature’s provision of ecosystem services.
1
Introduction
1.1
Background and methodology
The initial assessment (IA) of the implementation of the EU Marine Strategy Framework Directive (MSFD) includes an economic and social analysis (ESA). This analysis is about two areas: (1) the use of marine waters and (2) the cost of degradation of the marine environment. COM (2010) describes two different approaches for analysing (1): the ecosystem service approach and the marine water accounts approach; and three different approaches for analysing (2): the ecosystem service approach, the thematic approach and the cost-based
approach.
The Swedish ESA will be based on the ecosystem service approach associated with each of the two areas. For the use of marine waters, this approach entails the following components (COM, 2010:17):
1a. Identifying ecosystem services of marine areas in cooperation with the analysis of status, pressures and impacts
1b. Identifying and, if possible, quantifying and valuing the wellbeing derived from the ecosystem services
1c. Identifying the drivers and pressures affecting the ecosystem services For the cost of degradation, the ecosystem service approach is about the following (COM, 2010:35):
2a. Defining good environmental status (GES) using qualitative descriptors, list of elements and list of pressures.
2b. Assessing the environmental status in a business-as-usual (BAU) scenario.
2c. Describing in qualitative and, if possible, quantitative terms the difference between the GES and the environmental status in the BAU scenario. This difference at a particular point of time defines the degradation of the marine environment at this point of time.
2d. Describing the consequences to human well-being of degradation of the marine environment, either qualitatively, quantitatively or in monetary terms. These consequences are the cost of degradation.
This report provides input regarding marine recreation and tourism components of these two ecosystem service approaches. After a general introduction to Swedes’ recreation in or at the sea in Section 1.2, the report contains the following. See also Figure 1.1 for an illustration of the contents of the report that also provides an interpretation of the contents in terms of the Drivers-Pressure-State-Impact-Response (DPSIR) framework.
Chapter 2: Definitions related to marine recreation and tourism. For example, this chapter defines sectors of marine tourism and suggests subcategories of the ecosystem service of providing recreational opportunities. These subcategories turn out to be of great importance for making an analysis of marine recreation and tourism operational.
Chapter 3 describes the extent of use of Swedish marine waters by the sectors of marine tourism.
Chapter 4 provides an ecosystem service analysis by:
o Analyzing how the sectors of marine tourism are depending on subcategories of the ecosystem service to provide recreational opportunities (4.1).
o Viewing the subcategories of the ecosystem service of providing recreational opportunities as final ecosystem services and identifying on which intermediate ecosystem services they primarily depend (4.2).
o Identifying which GES descriptors are covering each of the identified intermediate ecosystem services and selecting those GES indicators associated with these descriptors that give the most relevant information on the status of the supply of the identified intermediate ecosystem services (4.3.1).
o Describing the status of the selected GES indicators and the associated intermediate ecosystem services (4.3.2).
o Analyzing the impact of the sectors of marine tourism on the selected GES indicators (4.4).
o Describing driving forces influencing the sectors of marine tourism and assessing what these forces might imply for the future development of these sectors (4.5).
o Describing a BAU trend for the selected GES indicators and the associated intermediate ecosystem services to 2020 and 2050 given BAU (4.6).
o Discussing what the BAU trend might imply for the development of the sectors of marine tourism (4.7).
Chapter 5 presents findings about the total economic value (TEV) of changes in recreational opportunities.
Chapter 6 assesses the cost of degradation based on the results of the earlier chapters.
Chapter 7 contains a concluding discussion.
For carrying out the ecosystem service analysis in Chapter 4, we follow in principle the procedure of a Corporate Ecosystem Services Review (ESR) as designed by WRI (2008). The purpose of an ESR is to evaluate a company’s dependence of and impact on ecosystem services as a basis for identifying the resulting business risks and opportunities. ESR emphasizes the importance of both looking at dependence and impact, which is relevant also for the case of marine tourism because marine tourism both has an impact on marine ecosystem services and is in the same time highly dependent on a sufficient supply of those services. An ESR consists of five steps:
I. Determine the corporate boundaries related to e.g. markets, geographical area, products, customers, etc.
In this report, this is done by the definitions in Chapter 2 and the associated descriptions of the extent of the sectors of marine tourism in Chapter 3.
II. Identify the company’s impact and dependence on ecosystem services and select those services that are the most important ones in terms of impact and dependence.
This is done in Section 4.1 for the sectors of marine tourism and Section 4.2, in which the final ecosystem services are related to intermediate ecosystem services.
III. Analyze the status and trends in the selected ecosystem services.
This is done in Sections 4.3-4.6.
IV. Identify business risks and opportunities based on the trends in the selected ecosystem services.
This is done in Section 4.7 for the sectors of marine tourism. V. Develop strategies for minimizing the risks and maximizing
opportunities.
This last step is rather a part of the future Programmes of Measures than the Initial Assessment of the MSFD. The usefulness of an ESR hinges upon carrying out different kinds of
screenings. To define the boundaries in step I is one kind of screening, but the most important one is the selection in step II of the most important ecosystem services in terms of impact and dependence. This selection must sort out relatively few ecosystem services; otherwise the analysis will be subject to the cannot-see-the-wood-for-the-trees problem. Such screenings are in this report also necessary for e.g. the selection of GES descriptors and associated
indicators. Since an ecosystem service analysis of this kind still is a relatively uncharted territory, it is unavoidable that those screenings and other parts of the work are to a large extent based upon professional judgments.
Marine tourism sectors A-H (definitions in Ch. 2, extent in Ch. 3) C1 Recreation Subcategories of recreation C1.1-C1.7 (final ecosystem services defined in Ch. 2) input described in 4.1 Intermediate ecosystem services (screened in 4.2) input described in 4.2 R3 R5 C2
GES descriptors and associated indicators (screened in 4.3.1) D5 D8 D9 D10 linked to 5.1.1 5.2.4 8.1.1 9.1.1 9.1.2 10.1.1 10.1.2 Status of indicators (described in 4.3.2) Status of intermediate ecosystem services (described in 4.3.2) Status of final ecosystem services (described in 4.3.2) influence on influence on Trend (4.6) Trend (4.6) Trend (4.6) influence on on tourism (4.5)
Other factors, e.g. other nutrient sources than tourism (4.6)
influence on TEV of change (Ch. 5) Cost of degrada tion (Ch. 6)
1.2
Swedes’ recreation in or at the sea
There is a strong dependence between the marine environment of the Baltic Sea and the North Sea1 and recreation and tourism in Sweden. The importance of the sea from a recreational point of view is evident from a recent survey study (BalticSurvey). BalticSurvey was an internationally coordinated survey study among the general public in all nine littoral Baltic Sea countries. Identical questions were posed in all countries in April-June 2010 to about 1000
respondents per country, using either telephone interviews or face-to-face interviews. See SEPA (2010a, 2010b) for details. In Sweden, a sample of Swedish residents of at least 16 years of age was used, which implies a survey population of about 7.74 million people (SCB, 2011). The questions in
BalticSurvey was both about people’s use of the sea and attitudes towards the marine environment. In this chapter, we employ the results of the former type of questions for introducing the importance of marine recreation among Swedes in the Baltic Sea and the North Sea.2
When answering the questions, the respondents were asked to perceive “the sea” as both the waters of the shores of the Baltic Sea and the North Sea. This means, for example, that activities that take place in the water as well as at the water were reported by the respondents. The focus below is on the results of the following questions:
Q4: “Have you ever been to the sea to spend leisure time there? This could be about swimming, boating and fishing, but also for example walking along the seashore, skating and going on a cruise.”
Q5 was posed to those respondents who have visited the sea at least once: “When was your last visit to the sea to spend leisure time there? Was it ‘in the last 12 months, that is in April 2009 to March 2010’, ‘in the last 5 years, but not in the last 12 months’ or ‘more than 5 years ago’”?
Q6 and Q7 were posed to those respondents who had visited the sea in the last 12 months:
o Q6a: “Now think about the months of April to September 2009. This means about 180 days. At about how many of these days did you spend at least some leisure time at the sea?”
o Q6b: “Now think about the months of October 2009 to March 2010. This means about 180 days. At about how many of these days did you spend at least some leisure time at the sea?” o Q7: “Now think about the last 12 months, i.e. April 2009 to
March 2010, and the days you spent at least some leisure time
1 If not otherwise stated, ”the Baltic Sea” refers in this report to the Swedish marine waters of
the Bothnian Bay, the Bothnian sea and Baltic Sea Proper. “The North Sea” refers to the Swedish marine waters of the Skagerrak, the Kattegat and the Sound (Öresund). The Sound is interpreted as having its southern border at the Drogden threshold, i.e. at the Öresund Bridge.
2
In BalticSurvey, respondents were asked to also consider non-Swedish marine waters in the Baltic Sea and the North Sea. This means that the figures presented below include, for example, Swedes’ visits to the German Baltic Sea coast. On the other hand, e.g. Germans’ visits to the Swedish coast are not included.
at the sea. At about how many of these days did you do the following?
Swimming (in the sea) Diving (in the sea)
Windsurfing, water skiing
Boating –e.g. sailing, power boating, rowing, canoeing/kayaking
Jigging
Other types of fishing than jigging
Being at the beach or seashore for walking, picnicking, sunbathing, visiting touristic or cultural sites, etc. Skating, skiing
Going on a cruise/using water-based transportation for recreation”
It is important to note that the activities listed in Q7 cannot take place if the marine environment does not provide opportunities for them. That is, the marine environment supply the ecosystem service of “recreation”, or more precisely, providing opportunities to enjoy recreational activities (ecosystem service C1 in Garpe, 2008 and SEPA, 2009). Even more precisely, the list in Q7 suggests that the marine environment provide opportunities for different recreational opportunities. These opportunities might be of different quality or quantity. These opportunities are henceforth referred to as subcategories of the ecosystem service of “recreation”. Ecosystem services are further defined in Chapter 2.
The answers to BalticSurvey indicate that 98 % of the sampled population has visited the Baltic Sea and the North Sea at least once to spend leisure time there. 78 % of this part of the population had visited the sea in the last 12 months and for 5 %, the latest visit occurred more than five years ago. For those who visited the sea in the last 12 months, the mean number of days during the period of April-September 2009 that they spent at least some leisure time at the sea was 35 days (median: 15 days). The corresponding mean
number of days for the period of October 2009-March 2010 was 17 (median: 3 days). These numbers are likely to indicate that for many Swedes, leisure visits to the sea is a part of their everyday life. For example, many Swedish cities are coastal ones, offering a convenient opportunity to enjoy the sea view just by taking a walk along the seashore. The answers to Q7 indeed showed that “being at the beach or seashore for walking, picnicking, sunbathing, visiting touristic or cultural sites, etc.” was the most common recreational activity.
The results from BalticSurvey suggest that about 7.74x0.98x0.78 = 5.92 million Swedes made at least one visit to the sea to spend leisure time there in the period of April 2009-March 2010. During April-September, they visited on average the sea every fifth day (35/180). The corresponding figure for October-March is every tenth day (17/180). A lower boundary for the number of Swedes’ visits to the sea during April-September is 35x5.92 = 207 million visits. (This is a lower bound since some people might have visited the sea several times per day.) The corresponding lower boundary for October-March is 17x5.92 = 101 million visits. For the whole year, this means at least 308 million visits. To put this figure in perspective, it might be mentioned that the total number of nights spent by foreign tourists in the whole of Sweden was about 12.8 million in 2010 (Tillväxtverket, 2011).
2
Definitions
In this chapter, we suggest a number of definitions and categorizations of “tourism” and “recreation” on which the subsequent analysis will build.
2.1
Tourism
For tourism, our part of departure is the well-established and general definition established by the World Tourism Organization (UNWTO): “The
activities of persons traveling and staying in places outside their usual environment for not more than one consecutive year for leisure, business and other purposes.” (UNWTO, 1995:1)
Further, visitors are those persons engaging in tourism, a group which in turn is divided into tourists and same-day visitors. A tourist is an overnight visitor. Visitors are distinguished from other travellers by applying three fundamental criteria: (1) the trip should be to a place other than that of the usual
environment, (2) the stay in the place visited should not last more than twelve consecutive months, and (3) the main purpose of the visit should be other than the exercise of an activity remunerated from within the place visited (Eurostat, 1998). Some examples of travellers who are not visitors are those who are regular commuters because of work or studies and those who travel to a place in which they receive a reward for labour (Turistdelegationen, 1995).
Sweden has adopted this definition of tourism (Turistdelegationen, 1995), which also involved an adaption to Swedish conditions so that tourism is defined as the activities of persons who make an overnight stay away from
their usual residence or make a same-day visit outside their municipality of residence. This definition is the basis for the data collection to the Travel and
Turist Database (Rese- och Turistdatabasen, TDB®), which is the most extensive source of travel and tourist data in Sweden. The data collection for TDB began in 1989 and is based on telephone interviews in which about 2 000 randomly selected Swedish residents per month are asked about their
travelling behaviour.
2.2
Tourism sectors of economic activity
For the analysis, we are interested in those visitors who enjoy the opportunities for recreation that the marine environment in Swedish marine waters offers, i.e. those visitors who consume the ecosystem service of “marine recreation” provided by Swedish marine waters. Those visitors can be associated with different sectors of economic activity, with the main sectors being:
A. Cruise-ship traffic in marine waters
B. International passenger ferry traffic in marine waters C. National passenger ferry traffic in marine waters
D. Other commercial passenger transportation in marine waters E. Leisure boating in marine waters
F. Holiday housing associated with marine recreation
G. Commercial accommodation (e.g. hotels, camping sites, etc.) associated with marine recreation
For sectors A-E, the connection to marine waters is unambiguous since the activities in these sectors take place in marine waters. Sectors F-H have a less direct connection but are still relevant to include because a substantial proportion of these sectors is likely to depend on the enjoyment of marine recreation. To not account for this proportion would imply that the economic activity that is dependent on marine waters would be understated.
However, including sectors F-H requires a reasonable and objective delimitation of these sectors. To illustrate the problem, whereas some
commercial accommodation situated at the coast (e.g. a camping site adjacent to a beach on the island of Gotland) is likely to be dependent to a very high degree on the opportunity to enjoy marine recreation, other accommodation facilities situated at the coast (e.g. a hotel in a coastal city such as Stockholm) might be almost independent on marine recreational opportunities.
This problem relates to a general difficulty to delimit “coastal tourism”, with the consequence that it does not exist any precise and widely accepted definition of this part of the tourism sector (Eurostat, 2009). The definitions that have in fact been used are in most cases based on a geographical
delimitation, such as sorting out administrative areas situated at or close to the sea. Another approach is to use data on visits based on surveys in which visitors themselves have classified their visits as coastal ones. As noted by Eurostat (2009), these approaches are to some extent complementary and there are thus opportunities to combine them.
For sectors F-H, we have chosen the approach of making a geographical
delimitation by using two alternative geographical definitions for these sectors; one (called MAX) that is likely to result in an overestimate of the sectors in relation to their association with marine recreation and one (called MIN) that is likely to result in an underestimate. When describing the extent of these sectors, an interval derived from these two definitions will be used instead of a point estimate.
The MAX definition is to include those parts of sectors F-H which are located in Swedish coastal municipalities or on islands in marine waters. The MIN
definition is to include those parts of sectors F-H which are located in sub-drainage basins that drain directly into coastal or transitional water bodies (typology from the Water Framework Directive, 2000/60/EG)
(delavrinningsområden som avvattnas direkt till kustvattenförekomster eller
övergångsvatten) or on islands in marine waters.
The definitions are illustrated by Figure 2.1, showing the municipality of Karlskrona (within blue line). For this municipality, the area covered by the MAX definition is the whole municipality of Karlskrona (including the islands along the coast). The MIN definition implies a considerably smaller area, viz. the greyish green and dark green sub-drainage basins and the grey islands along the coast.
Figure 2.1. Map of the municipality of Karlskrona (SW Sweden), illustrating the MAX definition (the whole municipality) and the MIN definition (the dark green and grey green sub-drainage basins and the grey islands).
2.3
The ecosystem service of recreation
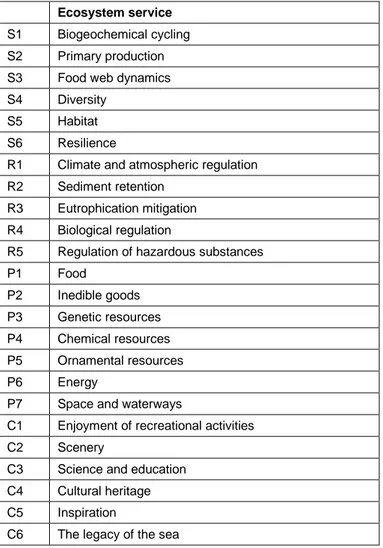
Ecosystems provide support to human life and contribute to human well-being in numerous different ways. In recent years, this fact has increasingly been conceptualized by using the terms “ecosystem goods” and “ecosystem services”, and a number of definitions and classifications are available in the literature, see TEEB (2010, p. 17) for references. The Millennium Ecosystem Assessment (MA, 2005) provided a definition and categorization that has been much employed, also by Garpe (2008) and SEPA (2009) for the case of marine ecosystems. Sometimes a distinction between “ecosystem goods” and “ecosystem services” is made, with the former referring to products that are provided by ecosystems and that usually can be traded on a market – fish is a typical example. However, we follow Garpe (2008) and SEPA (2009) and use “ecosystem services” as a general term also covering “ecosystem goods”. The concept of ecosystem services represents an instrumental perspective on ecosystems – it is about the ways in which ecosystems are useful to humans. As noted by Garpe (2008), the concept thus views ecosystems from a utilitarian perspective. As emphasized by TEEB (2010, Figure 1.4), the concept provides a link between what is going on in an ecosystem in terms of its structures, processes and functions and human well-being. Based on the four categories of provisioning, supporting, regulating and cultural ecosystem services suggested by MA (2005) and illustrated in Figure 2.2, Garpe (2008) and SEPA (2009) identified a number of ecosystem services provided by the marine ecosystems of the Baltic Sea and the Skagerrak, see Table 2.1.
In the discussion of ecosystem services, it has been observed that some of them tend to be input in ecosystems’ production of other services. For example, the regulating service of mitigation of eutrophication might be manifested in improved opportunities for recreation, i.e. a cultural service. Ecosystem
services, see e.g. Fisher et al. (2009). As emphasized by COM (2010), this division is likely to help avoiding a narrow focus on final services when making a full listing of ecosystem services and also avoiding double counting when making a monetary assessment of ecosystem services.
Table 2.1. List of identified marine ecosystem services provided by the Baltic Sea and the Skagerrak (S=supporting, R=regulating, P=provisioning, C=cultural). Source: Garpe (2008) and
SEPA (2009).
Ecosystem service
S1 Biogeochemical cycling S2 Primary production S3 Food web dynamics S4 Diversity
S5 Habitat S6 Resilience
R1 Climate and atmospheric regulation R2 Sediment retention
R3 Eutrophication mitigation R4 Biological regulation
R5 Regulation of hazardous substances P1 Food P2 Inedible goods P3 Genetic resources P4 Chemical resources P5 Ornamental resources P6 Energy
P7 Space and waterways
C1 Enjoyment of recreational activities C2 Scenery
C3 Science and education C4 Cultural heritage C5 Inspiration
C6 The legacy of the sea
We noted above that the tourism sectors reflect economic activities of visitors that in one way or another make use of the ecosystem service of providing opportunities to enjoy recreational activities. Ecosystem service C1 is therefore in focus for this report. Garpe (2008) suggested the following definition of this ecosystem service:
“Enjoyment of recreational activities refers to economic and societal values of activities carried out in the marine environment such as sport fishing, boating, diving, swimming and bird watching. The service further includes the use of coastal and marine environments to promote and sustain national and international tourism”. (Garpe,
2008:134)
This definition thus lumps together the opportunities to enjoy many different types of marine and coastal recreational activities. In order to make the definition operational for an analysis of tourism sectors, there is a need to separate these different opportunities. As was suggested in Chapter 1, we therefore divide C1 into a number of subcategories according to what specific opportunities are provided. These subcategories are defined as the
BalticSurvey, with a few minor modifications. This means that we define the following different types of opportunities to enjoy recreational activities:
C1.1 Swimming
C1.2 Diving
C1.3 Windsurfing, water skiing
C1.4 Boating
C1.5 Fishing
C1.6 Being at the beach or seashore for walking, picnicking, sunbathing, visiting touristic or cultural sites, etc. C1.7 Using water-based transportation
Each of these subcategories might, if required for the analysis, be subject to further breakdown. For example, it might be of interest to divide “boating” in different types of boating since, for example, consuming opportunities for power boating might decrease the opportunities for canoeing/kayaking, at least as regards quality aspects of these opportunities.
2.4
Total economic value (TEV)
Finally, the concept of total economic value (TEV) should be explained, because it plays an important role in Chapter 5 when valuation studies of changes in marine recreational opportunities are reviewed. As explained in COM (2010), various valuation methods can be applied for estimating the TEV of a changed provision of an ecosystem service.3 In general, “total” in TEV refers to that TEV is the sum of two different types of economic values: use values and non-use values. That is, TEV=use values+non-use values. Use values are due to individuals’ direct or indirect use of an ecosystem service, and non-use values refer to that people might regard it as important to know that there are a sufficient supply of ecosystem services and that these services may also be available to future generations (COM, 2010). For example, people might be willing to make trade-offs (i.e. having an economic value) for saving a particular coastal habitat even if they have no intention of making use of this habitat, neither directly through diving nor indirectly through its input in the provision of final ecosystem services. As emphasized by Turner et al. (2010), TEV must not be confused with the “total value” of an ecosystem service, because potential intrinsic values of nature are typically regarded as independent of human preferences and therefore not reflected by TEV.
3
See e.g. Hanley and Barbier (2009), Kinell and Söderqvist (2011) and SEPA (2008) for introductions to valuation methods.
3
Use of marine waters
This chapter reports how the tourism sectors defined in Chapter 2 make use of marine waters by describing the extent of sectors in terms of, for example, the number of passengers/overnight stays/same-day visits, turnover in SEK and employment in number of full-time year-round employed. All data are for 2010 and are primarily based on official statistics from Statistics Sweden and TDB (cf. Section 2.1). In addition, a model for tourism economics
(Turistekonomiska modellen, TEM®) was used for processing data. See Resurs AB (2011a) for details. Note that “visits” are not defined in the same way as in SEPA (2010a, 2010b), which means that figures on visits below give
complementary information to those presented in Section 1.2.
3.1
Sector A. Cruise-ship traffic
Cruise-ship traffic in Swedish marine water occurs during the summer months when ships are making round trips in the Baltic Sea and/or the North Sea. Norwegian fjords are common destinations included in the trips. In 2010, calls made by cruise-ships were reported at ten Swedish ports, and Stockholm accounted for almost 80 % of the total number of passengers, see Table 3.1. Table 3.1 also includes an estimation of the turnover because of shopping etc. by the passengers when they are ashore. This estimation is based on a study carried out by Stockholms Hamnar AB. The figures on turnover are in turn used for an estimate of the employment generated ashore by the passengers, based on the average turnover per employee in the affected industries (shops, restaurants, etc.). However, turnover and employment for ports and ships are not included; these figures are reported in IVL and Enveco (2012).
Table 3.1. Description of the extent of sector A in 2010 (cruise-ship traffic in marine waters) for the Baltic Sea and the North Sea. Source: Resurs AB (2011a).
Port Number of calls Number of passengers Turnover ashore (MSEK) Employment ashore Luleå 2 1 538 1.7 1 Piteå 0 0 0 0 Sundsvall 2 1 271 1.4 1 Skärnes, Iggesund 0 0 0 0 Stockholm 242 318 327 350.2 250 Nynäshamn 15 30 664 33.7 24 Gotland 66 52 067 57.2 41 Kalmar 2 320 0.4 0.3 Karlskrona 2 709 0.8 0.6
Total Baltic Sea 331 404 896 445.4 318
Malmö 1 410 0.5 0.3
Helsingborg 6 15 635 17.2 12
Göteborg 41 50 241 55.3 40
Total North Sea 48 66 286 72.9 52
3.2
Sectors B-D. Other passenger ship
traffic
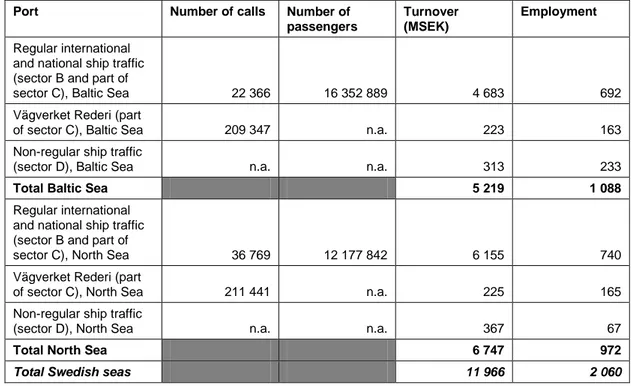
Table 3.2 reports the number of calls and passengers, turnover and
employment associated with the Swedish companies carrying out international and national ship traffic (sector B-C) and non-regular ship traffic. Non-regular ship traffic refers to taxi boats and other types of on-demand traffic. The figures in Table 3.2 for turnover and employment concern those reported by the
companies, i.e. in contrast to sector A, passengers’ expenditures ashore are not included.
Table 3.2. Description of the extent of sectors B-D in 2010 for the Baltic Sea and the North Sea. Source: Resurs AB (2011a).
Port Number of calls Number of passengers
Turnover (MSEK)
Employment
Regular international and national ship traffic (sector B and part of
sector C), Baltic Sea 22 366 16 352 889 4 683 692
Vägverket Rederi (part
of sector C), Baltic Sea 209 347 n.a. 223 163
Non-regular ship traffic
(sector D), Baltic Sea n.a. n.a. 313 233
Total Baltic Sea 5 219 1 088
Regular international and national ship traffic (sector B and part of
sector C), North Sea 36 769 12 177 842 6 155 740
Vägverket Rederi (part
of sector C), North Sea 211 441 n.a. 225 165
Non-regular ship traffic
(sector D), North Sea n.a. n.a. 367 67
Total North Sea 6 747 972
Total Swedish seas 11 966 2 060
3.3
Sector E. Leisure boating
The number of seaworthy leisure boats owned by Swedish residents are about 881 000, of which 47 % is reported to have home harbour in marine waters (Transportstyrelsen, 2011a). This suggests that there are about 414 000 leisure boats owned by Swedish residents and primarily used for boating in marine waters. There is no separate reporting in Transportstyrelsen (2011a) for the Baltic Sea and the North Sea, but a rough approximation of the number of boats in each area might be based on the proportion of overnight stays in each of the sea areas. Based on Table 3.3, this implies (762000/1164000)x414 000 = about 271 000 leisure boats in the Baltic Sea and 414 000-271 000 = 143 000 in the North Sea.
The turnover reported in Table 3.3 is the expenditures made by people in connection to their boating in 2010. Data about the size and types of expenditures are collected through TDB interviews.
Table 3.3. Description of the extent of sector E for 2010 for the Baltic Sea and the North Sea. Source for overnight stays and turnover: Resurs AB (2011a). Source for number of boats:
Transportstyrelsen (2011a) and own computations.
Area Number of boats Number of overnight stays Turnover (MSEK) Baltic Sea 271 000 762 000 164.6 North Sea 143 000 402 000 125.8
Total Swedish seas 414 000 1 164 000 290.4
3.4
Sector F. Holiday housing
Three categories of the holiday housing sector are investigated: Holiday houses (Table 3.4), visits to relatives and friends, which might also take place in their permanent homes (Table 3.5) and other types of mainly non-commercial accommodation (Table 3.6).
The turnover reported in Table 3.4-3.6 is the expenditures made by people in connection to their holiday housing in 2010. Data about the size and types of expenditures are collected through TDB interviews.
Table 3.4 shows that the total number of holiday houses at the coast is between 214 894 and 275 655, depending on whether the MIN or MAX definition is used. This means that 38-49 % of the in total 564 700 holiday houses in Sweden are situated at the coast. To put this figure into perspective, it can be mentioned that the total number of buildings for homes (permanent and holiday) and work situated not more than 100 metres from the coastal shoreline of Sweden was about 117 000 in 2000 (SCB, 2004).
Summing figures from Tables 3.4-3.6, the total number of overnight stays for the two sea areas together for the three different parts of sector F is between 37.4 million (MIN) and 50.4 million (MAX). As to turnover, the corresponding figures are SEK 9378.3 million (MIN) and 12 696.7 million (MAX). Visits to relatives and friends account for about 50-60 % of the total number of overnight stays and the turnover.
Table 3.4. Description of the extent of the holiday house part of sector F for 2010 for the Baltic Sea and the North Sea. Source: Resurs AB (2011a).
Area Number of holiday houses Number of overnight stays Turnover (MSEK)
Baltic Sea, MIN 155 878 9 507 000 1 625.7
North Sea, MIN 59 016 4 585 000 866.6
Total Swedish seas, MIN 214 894 14 092 000 2 492.3
Baltic Sea, MAX 205 649 12 542 000 2 144.7
North Sea, MAX 70 006 5 439 000 1 028.0
Total Swedish seas, MAX 275 655 17 981 000 3 172.7
Table 3.5. Description of the extent of the visits to relatives and friends part of sector F for 2010 for the Baltic Sea and the North Sea. Source: Resurs AB (2011a).
Area Number of overnight stays
Turnover (MSEK)
Baltic Sea, MIN 13 325 000 3 517.7
North Sea, MIN 6 105 000 1 740.0
Total Swedish seas, MIN 19 430 000 5 257.7
Baltic Sea, MAX 19 035 000 5 025.2
North Sea, MAX 8 722 000 2 485.8
Total Swedish seas, MAX 27 757 000 7 511.0
Table 3.6. Description of the extent of the other-types-of-non-commercial-accommodation part of sector F for 2010 for the Baltic Sea and the North Sea. Source: Resurs AB (2011a). Area Number of
overnight stays
Turnover (MSEK)
Baltic Sea, MIN 2 092 000 841.1
North Sea, MIN 1 746 000 787.2
Total Swedish seas, MIN 3 838 000 1 628.3
Baltic Sea, MAX 2 676 000 1 075.8
North Sea, MAX 2 078 000 937.2
3.5
Sector G. Commercial accommodation
Statistics for three categories of commercial accommodation are reported below: Hotels (Table 3.7), cabin villages and hostels (Table 3.8) and camping sites (Table 3.9).
The turnover reported in Table 3.7-3.9 is the expenditures made by people in connection to their use of commercial accommodation in 2010. Data about the size and types of expenditures are collected through TDB interviews.
Viewing the Baltic Sea and the North Sea as a whole, the tables show that there are altogether between 1346 (MIN) and 1792 (MAX) places for commercial accommodation. The corresponding aggregates for the number of overnight stays and turnover are 17.6-28.1 million and SEK 16 257.1-27 847.0 million. The hotel category of commercial accommodation is larger than the two other categories, especially in terms of turnover.
Table 3.7. Description of the extent of the hotel part of sector G for 2010 for the Baltic Sea and the North Sea. Source: Resurs AB (2011a).
Area Number of hotels Number of overnight stays Turnover (MSEK)
Baltic Sea, MIN 450 6 227 000 8 624.2
North Sea, MIN 195 3 570 000 4 491.1
Total Swedish seas, MIN 645 9 797 000 13 115.2
Baltic Sea, MAX 652 11 370 000 15 747.5
North Sea, MAX 277 6 213 000 7 815.8
Total Swedish seas, MAX 929 17 583 000 23 563.3
Table 3.8. Description of the extent of the cabin villages and hostels part of sector G for 2010 for the Baltic Sea and the North Sea. Source: Resurs AB (2011a).
Area Number of cabin villages and hostels Number of overnight stays Turnover (MSEK)
Baltic Sea, MIN 262 1 187 000 685.0
North Sea, MIN 95 472 000 305.7
Total Swedish seas, MIN 357 1 660 000 990.7
Baltic Sea, MAX 326 1 739 000 1 003.6
North Sea, MAX 112 617 000 400.1
Table 3.9. Description of the extent of the camping sites part of sector G for 2010 for the Baltic Sea and the North Sea. Source: Resurs AB (2011a).
Area Number of camping sites Number of overnight stays Turnover (MSEK)
Baltic Sea, MIN 238 3 883 000 1 281.4
North Sea, MIN 106 2 271 000 869.8
Total Swedish seas, MIN 344 6 154 000 2 151.2
Baltic Sea, MAX 308 4 400 000 1 452.0
North Sea, MAX 117 3 728 000 1 428.0
Total Swedish seas, MAX 425 8 128 000 2 880.0
3.6
Sector H. Same-day visits
For TDB, interviewees are normally asked to report information about same-day visits due to one-way trips that are at least 100 km. In order to obtain a more complete picture of the number of same-day visits to the Swedish coast, a question was added about one-way trips shorter than 100 km in the TDB interviews carried out in June, July and August 2011. The figures in Table 3.10 are thus based on all one-way trips, regardless of length.
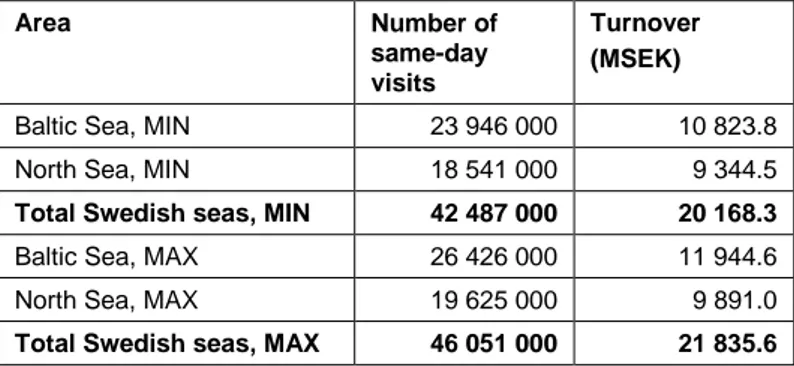
The turnover reported in Table 3.10 is the expenditures made by people in connection to their same-day visits in 2010. Data about the size and types of expenditures are collected through TDB interviews.
The total number of same-day visits for both sea areas are between 42.5 million (MIN) and 46.1 million (MAX). The corresponding interval for turnover is SEK 20 168.3-21 835.6 million.
Table 3.10. Description of the extent of sector H for 2010 for the Baltic Sea and the North Sea. Source: Resurs AB (2011a).
Area Number of same-day visits
Turnover (MSEK)
Baltic Sea, MIN 23 946 000 10 823.8
North Sea, MIN 18 541 000 9 344.5
Total Swedish seas, MIN 42 487 000 20 168.3
Baltic Sea, MAX 26 426 000 11 944.6
North Sea, MAX 19 625 000 9 891.0
Total Swedish seas, MAX 46 051 000 21 835.6
3.7
Employment effects of sectors E-H
The turnover associated with people’s spending when boating, having holiday housing, making use of commercial accommodation and making same-day visits gives rise to employment in six different industries: Food stores,
restaurants, transportation, shopping, various activities and accommodation. Information from TDB is used for conclusions about how people’s expenditures are distributed among these different industries. This is combined in TEM with
facts about turnover per employee in the different industries in each
municipality. The results are shown in Table 3.11, which indicates that about 36 000 (MIN)-51 000 (MAX) jobs are associated to the turnover caused by people’s visits to the Swedish coast in 2010.
Table 3.11. Employment effects of the turnover caused by people’s spending in sectors E-H for 2010 for the Baltic Sea and the North Sea. Source: Resurs AB (2011a).
Area Employment (number of employees)
Baltic Sea, MIN 22 219
North Sea, MIN 14 229
Total Swedish seas, MIN 36 448
Baltic Sea, MAX 31 928
North Sea, MAX 19 108
Total Swedish seas, MAX 51 036
3.8
Summary for all sectors A-H
The facts above about the extent of sectors A-H are summarized in Tables 3.12-3.13. Table 3.12 is based on the MIN definition for sectors E-H and Table 3.13 on the MAX definition. When interpreting the figures, it should be kept in mind that turnover and employment are defined differently for the different sectors: For sector A, they are about passengers’ expenditures ashore and the jobs these expenditures create; for sectors B-D, turnover and employment are for the companies found in these sectors – for employment this implies an
underestimation because a substantial part of the employment is accounted for in the country where ships are registered; and for sectors E-H, turnover and employment are about tourists’ spending when boating, having holiday housing, making use of commercial accommodation and making same-day visits and the jobs associated with this turnover. This implies a double-counting for turnover and employment for all tourists that have paid for a trip by ship. For example, such expenditures for going to Gotland by ferry are included in sector C as well as in sectors E-H. However, the turnover and employment caused by visits by foreign tourists to relatives and friends are not included because lack of satisfactory data about such visits on municipality level. Resurs AB (2011a) judges the turnover caused by such visits to be considerably larger than the turnover that has been subject to double-counting, e.g. to Gotland. Tables 3.12-3.13 illustrate the considerable extent of coastal and marine tourism in Sweden. For example, the estimated turnover of this part of the Swedish tourism industry is between SEK 58 578 million (MIN) and SEK 75 153 million. The turnover of the Swedish tourist industry as a whole in 2010 was SEK 255 000 million (Tillväxtverket, 2011), which means that coastal and marine tourism accounted for between 23 % (MIN) and 29 % (MAX) of the total turnover. The corresponding percentages for employment are 23 % and 33 %, since the total employment in Swedish tourist industry in 2010 was 162 100 (Tillväxtverket, 2011).
Table 3.12. Summary table for the extent of sectors A-H in 2010 for the Baltic Sea and the North Sea, the case of the MIN definition for sectors E-H. Source: Resurs AB (2011a). Sector and area Number of
calls Number of passengers (sectors A-D) Number of visits through overnight stays (sectors E-G) Number of same-day visits (sector H) Turnover (MSEK) Employment
Cruise-ship traffic (sector A), Baltic Sea 331 404 896 445 318 Regular international and national ship
traffic (sector B and part of sector C),
Baltic Sea 22 366 16 352 889 4 683 692
Vägverket Rederi (part of sector C),
Baltic Sea 209 347 n.a. 223 163
Non-regular ship traffic (sector D),
Baltic Sea n.a. n.a. 313 233
Leisure boating, holiday housing, commercial accommodation and same-day visits (sectors E-H), Baltic Sea,
MIN 60 929 000 27 563 22 219
Total Baltic Sea, MIN 33 227 23 625
Cruise-ship traffic (sector A), North Sea 48 66 286 73 52
Regular international and national ship traffic (sector B and part of sector C),
North Sea 36 769 12 177 842 6 155 740
Vägverket Rederi (part of sector C),
North Sea 211 441 n.a. 225 165
Non-regular ship traffic (sector D),
North Sea n.a. n.a. 367 67
Leisure boating, holiday housing, commercial accommodation and same-day visits (sectors E-H), North Sea,
MIN 37 691 000 18 531 14 229
Total North Sea, MIN 25 351 15 253