Faculty of Veterinary Medicine and Animal Science
Mineral elements in clover- and grass
forage in Sweden
Kajsa Lätt
Master’s Thesis • 30 credits
Agricultural Science programme – Animal science Uppsala 2019Mineral elements in clover- and grass forage in Sweden
Mineralämnen i klöver- och gräsvall i Sverige
Kajsa Lätt
Supervisor: Horacio Gonda, Swedish University of Agricultural Sciences, Department of Animal Nutrition and Management
Assistant supervisor: Maria Åkerlind, Växa Sverige
Assistant supervisor: Anna Skarin, Swedish University of Agricultural Sciences, De-partment of Animal Nutrition and Management
Examiner: Rolf Spörndly, Swedish University of Agricultural Sciences, De-partment of Animal Nutrition and Management
Credits: 30 credits
Level: Advanced
Course title: Independent project in Animal Science, A2E Course code: EX0872
Programme/education: Agricultural Science programme – Animal Science Uppsala 2019 Kajsa Lätt Place of publication: Year of publication: Cover picture:
Online publication: https://stud.epsilon.slu.se
Keywords: Soil, Maps, Forage, Macro minerals, Micro minerals
Swedish University of Agricultural Sciences Faculty of Veterinary Medicine and Animal Sciences Department of Animal Nutrition and Management
Minerals are essential elements for all living organisms. Plants and animals need minerals to function and maintain a balanced physiological state. Minerals are also important in the ecological cycle. The minerals originate in the soil and makes the foundation of the plants nutritional value for the animals. The minerals can later re-circulate to the soil in form of manure.
Forage is the main feed giving to ruminants and knowledge about the mineral content in the forage is important to avoid deficiencies or toxicities and to get a good under-standing about the mineral balance of the farm.
This study aimed to map the contents of calcium, phosphorus, magnesium, potas-sium, sodium, chlorine, sulphur, iron, manganese, zinc, copper, cobalt, selenium, io-dine and molybdenum in clover- and grass forage in Sweden and to correlate those with the content of minerals in the soil of Sweden.
The results generated 15 different maps showing the content of each mineral in sam-ples of forages from all over Sweden. The results from the regression analysis be-tween minerals in soil and feed, showed a varied relation, where calcium, phospho-rus, copper and molybdenum had the strongestdeterminations coefficient of 50% - 65%.
It was concluded that this study showed mean concentration of calcium, phosphorus, magnesium, potassium, sulphur and copper comparable, to previously reported for Swedish forage. The mean contents of zinc, manganese and selenium, were however higher than those reported earlier and should therefore be the new refrence values for Swedish forage. This study also showed a difference in the phosphorus concentration between the northern and southern Sweden, which contradicts previously reported values of phosphorus in Swedish forage.
Keywords: Soil, Forage, Macro minerals, Micro minerals
Mineraler är livsnödvändiga för alla levande organismer. Växter och djur behöver mineraler för att fungera och upprätthålla ett normalt biologiskt tillstånd. Mineraler är också viktiga i det ekologiska kretsloppet. Mineraler kommer ursprungligen från jorden och är grunden till växtens näringsinnehåll för djuren. Näringsämnena kan sedan återvända till jorden i form av gödsel.
Vall är den huvudsakliga födokällan till idisslare i Sverige och kunskap om vallens mineralinnehåll är därför viktig att känna till för att undvika brister eller förgiftningar hos djuren och ha en god kännedom om gårdens mineralbalans.
Syftet med denna studie var att kartlägga innehållet av, kalcium, fosfor, magne-sium, kalium, natrium, klor, svavel, järn, mangan, zink, koppar, kobolt, selen, jod och molybden i svensk gräs- och klövervall och att korrelera dessa data med motsvarande mineraler i jorden.
Resultatet genererade 15 olika kartor, som visade variationen av innehållet för varje mineral i svensk vall. Resultatet för determinationskoefficienten mellan mine-raler i jorden och fodret, visade en varierad regressionsanalys, där kalcium, fosfor, koppar och molybden hade det tydligaste sambandet mellan 50%-65%.
I denna studien drogs slutsatsen att medelvärden i vallen för kalcium, fosfor, mag-nesium, kalium, svavel och koppar, var jämförbara med tidigare tabellvärden för svensk vall. Innehållet av zink, mangan och selen, visade dock högre medelvärden i vallen, än tidigare visat och borde därför bli de nya tabellvärdena för svensk vall. Den här studien visade även skillnader i fosforkoncentrationen i vallen mellan norra och södra Sverige, vilket motsäger tidigare tabellvärden för fosfor i svensk vall.
Nyckelord: Jord, Vall, Makromineraler, Mikromineraler
Växter och djur behöver mineraler för att upprätthålla normala biolo-giska funktioner. Mineraler är också viktiga i det ekolobiolo-giska kretsloppet. Mineraler kommer ursprungligen från jorden och är grunden till väx-tens näringsinnehåll, som i sin tur förser djuren. Mineralämnena åter-vänder sedan till jorden i form av gödsel.
God kännedom om mineralin-nehållet i foder är viktigt för att
kunna utfodra rätt mängd till dju-ren. En obalans av mineralerna i foderstaten kan ge brister, förgift-ningar och ekonomiska förluster. Analys av mineralämnena i fodret kan även ge en uppfattning om gårdens mineralbalans.
Mineralinnehållet i vallfodret på-verkas, förutom innehållet i jor-den, främst av artsammansätt-ningen av vallen, vilken typ av jordmån man har, vilket klimat gården ligger i och hur man sköter vallen. Syftet med detta examens-arbete var att kartlägga djurens livsnödvändiga mineraler i svensk vall och undersöka sambandet av dessa mineraler med motsvarande mineraler i jorden.
Kartorna från den här studien
var baserade på ca 52 000 foder-analyser från kött- och mjölkpro-ducenter från hela Sverige. Foder-analyserna var hämtade från Växa Sverige och var sammanställda under åren 2010–2017. Jordana-lyserna var hämtade från en tidi-gare studie från SLU (Eriksson et
al. 2010). Jämförelsen mellan
jord- och foderprover baserades på ett urval av 26 kommuner från 21 län.
Sambandet mellan jord och fo-der var högst för kalcium, fosfor,
koppar och molybden, för de ut-valda kommunerna. Kalcium och fosfor påverkar varandra och det är därför viktigt att ha god känne-dom om halten i både jorden och fodret. Likadant påverkas koppar och molybden av varandra och år-liga foderanalyser är därför vik-tiga.
Resultaten för makrominera-lerna visar att medelvärden i
val-len för kalcium, fosfor, magne-sium, kalium och svavel var jäm-förbara med äldre tabellvärden för svensk vall. Den här studien vi-sade dock, högre fosforkoncent-ration i vall från södra Sverige jämfört med norra, vilket motsäger tidigare tabellvärden för fosfor i svensk vall (Spörndly, 2003).
Kaliumhalten i vallen har stor
be-tydelse vid utfodring av bland an-nat sinkor. En hög mängd kalium i vallen kan påverka kalciumom-sättningen tiden före kalvning och bidra till ökad risk för
kalvningsförlamning. Mängden tillförd kalium från stallgödsel och konstgödsel på vallen, i kombinat-ion av jordmånen, kan inverka på mängden kalium i vallfodret.
Resultaten för mikrominera-lerna visar att medelvärdet för
koppar var jämförbart med äldre tabellvärden av koppar (Spörndly, 2003). Innehållet av zink, mangan och selen, visade dock högre me-delvärden i vallen, än tidigare vi-sat.
Molybdenhalten i vallen kan på-verka andra mineralämnen och höga halter kan orsaka bland annat kopparbrist. I den här studien hade
ca 20% av proven högre molybden än rekommenderade värden. Går-dar i dessa områden kan ha högre risk för kopparbrist. För att minska risken bör totalfoderstatens inne-håll av koppar vara minst fyra gånger högre än molybden.
Resultaten visar stor variation
inom varje mineralämne. Kartorna gjorda i denna studie kan användas för att få en uppfattning om hur va-riationen ser ut inom ett visst om-råde. Dock är kontinuerliga ana-lyser av mineralämnen viktiga att göra för användning vid foderpla-neringen på gården.
I would like to thank, my supervisors Horacio Gonda, Maria Åkerlind and Anna Skarin for the help and support of the writing of this report.
I would also like to thank Katarina Kyllmar at the department of Soil and Environment at SLU, for the help and support with the information about the soil samples, used in this report.
Acknowledgements 8
List of Tables 11
List of Figures 12
Abbreviations & Definitions 14
1 Introduction 16
2 Literature review 18
2.1 Mineral content in forage 18
2.1.1 Species 19
2.1.2 Management and other external factors 20
2.1.3 Attributes in the soil 22
2.1.4 Mineral requirement and available minerals in forage-based diets for
ruminants 23
3 Materials and Methods 27
3.1 Data 27
3.1.1 Feed samples 27
3.1.2 Soil samples 28
3.2 QGIS and preparing of maps 29
3.3 Statistical analysis 29
4 Results & Discussion 31
4.1 Macro minerals 31 4.2 Micro minerals 43 4.3 General discussion 54 5 Conclusion 55 References 56 Unpublished reference 58
Appendix 1 Map of calcium (kalcium) concentration 59 Appendix 2 Map of phosphorus (fosfor) concentration 60
Appendix 3 Map of magnesium (magnesium)concentration 61 Appendix 4 Map of potassium (kalium) concentration 62 Appendix 5 Map of sodium (natrium) concentration 63 Appendix 6 Map of chlorine (klor) concentration 64 Appendix 7 Map of sulphur (svavel) concentration 65
Appendix 8 Map of iron (järn) concentration 66
Appendix 9 Map of manganese (mangan) concentration 67
Appendix 10 Map of zinc (zink) concentration 68
Appendix 11 Map of copper (koppar) concentration 69 Appendix 12 Map of cobalt (kobolt) concentration 70 Appendix 13 Map of selenium (selen) concentration 71
Appendix 14 Map of iodine (jod) concentration 72
Table 1. Mean values of mineral content in different forages 18 Table 2. Content of Ca, P, Mg and K (g/kg DM) in samples of silage and hay from different
parts of Sweden and content of S (g/kg DM), Mn, Cu, Zn and Se of mixed ley
(Spörndly, 2003) 19
Table 3. Requirements and maximal tolerance of the total feed ration, function in body, symptoms and antagonists of macro minerals in dairy cattle 25 Table 4. Requirements and maximal tolerance, based on a DMI, function in body,
symptoms and antagonists of micro minerals in dairy cattle 26 Table 5. Measurement uncertainty and detection level of analysed mineral elements27 Table 6. Definition of feed code in NorFor feed analysis system and number of samples for
each feed code, used in the study 28
Table 7. Descriptive statistics of macro minerals in samples of forages from all Sweden 31 Table 8. Descriptive statistics of micro minerals in samples of forages from all Sweden
43
Figure 1. Histogram of the Ca content in forage samples. Red column is where the mode
value of 5.0 g/kg DM lays. 32
Figure 2. Regression analysis between Ca in soil and Ca in forage, where each dot represents the mean value of the soil sample and forage sample for each
selected municipality. 33
Figure 3. Histogram of the P content in forage samples. Red column is where the mode
value of 2.8 g/kg DM lays. 34
Figure 4. Regression analysis between P in soil and P in forage, where each dot represents the mean value of the soil sample and forage sample for each
selected municipality. 35
Figure 5. Histogram of the Mg content in forage samples. Red column is where the mode
value of 1.8 g/kg DM lays. 36
Figure 6. Regression analysis between Mg in soil and Mg in forage, where each dot represents the mean value of the soil sample and forage sample for each
selected municipality. 36
Figure 7. Histogram of the K content in forage samples. Red column is where the mode
value of 25 g/kg DM lays. 37
Figure 8. Regression analysis between K in soil and K in forage , where each dot represents the mean value of the soil sample and forage sample for each
selected municipality. 38
Figure 9. Histogram of the Na content in forage samples. Red column is where the mode
value of 0.5 g/kg DM lays. 39
Figure 10. Regression analysis between Na in soil and Na in forage, where each dot represents the mean value of the soil sample and forage sample for each
selected municipality. 39
Figure 11. Histogram of the Cl content in forage samples. Red column is where the mode
value of 0.4 g/kg DM lays. 40
Figure 12. Histogram of the S content in forage samples. Red column is where the mode
value of 2.0 g/kg DM lays. 41
Figure 13. Regression analysis between S in soil and S in forage, where each dot represents the mean value of the soil sample and forage sample for each
selected municipality 42
Figure 14. Histogram of the Fe content in forage samples. Red column is where the mode
value of 110 mg/kg DM lays. 43
Figure 15. Regression analysis between Fe in soil and Fe in forage, where each dot represents the mean value of the soil sample and forage sample for each
selected municipality. 44
Figure 16. Histogram of the Mn content in forage samples. Red column is where the mode
value of 56 mg/kg DM lays. 45
Figure 17. Regression analysis between Mn in soil and Mn in forage, where each dot represents the mean value of the soil sample and forage sample for each
selected municipality. 45
Figure 18. Histogram of the Zn content in forage samples. Red column is where the mode
value of 28 mg/kg DM lays. 46
Figure 19. Regression analysis between Zn in soil and Zn in forage, where each dot represents the mean value of the soil sample and forage sample for each
selected municipality. 47
Figure 20. Histogram of the Cu content in forage samples. Red column is where the mode
value of 5.1 mg/kg DM lays. 48
Figure 21. Regression analysis between Cu in soil and Cu in forage, where each dot represents the mean value of the soil sample and forage sample for each
selected municipality. 48
Figure 22. Histogram of the Co content in forage samples. Red column is where the mode
value of 0.04 mg/kg DM lays. 49
Figure 23. Regression analysis between Co in soil and Co in forage, where each dot represents the mean value of the soil sample and forage sample for each
selected municipality. 50
Figure 24. Histogram of the Se content in forage samples. Red column is where the mode
value of 0.02 mg/kg DM lays. 51
Figure 25. Regression analysis between Se in soil and Se in forage, where each dot represents the mean value of the soil sample and forage sample for each
selected municipality. 51
Figure 26. Histogram of the I content in forage samples. Red column is where the mode
value of 0.1 mg/kg DM lays. 52
Figure 27. Histogram of the Mo content in forage samples. Red column is where the mode
value of 0.8 mg/kg DM lays. 53
Figure 28. Regression analysis between Mo in soil and Mo in forage, where each dot represents the mean value of the soil sample and forage sample for each
Ca Calcium
CEC Cation Exchange Capacity
Cl Chlorine
Co Cobalt
Cu Copper
DCAD Dietary Cation and Anion Difference
DM Dry Matter
ECM Energy Corrected Milk
Fe Iron
I Iodine
K Potassium
Kommun Swedish community, defined as municipality
Län Region in Sweden with several municipalities, defined as county
Mg Magnesium
Mn Manganese
Mo Molybdenum
Na Sodium
P Phosphorus
QGIS Quantum Geographical Information System
S Sulphur
Se Selenium
SLU Swedish University of Agricultural Sciences
Zn Zinc
Minerals are essential elements for all living organisms. Plants and animals need minerals to function and maintain a balanced physiological state. Minerals are also important in the ecological cycle. The minerals originate in the soil and makes the foundation of the plants nutritional value for the animals. Minerals that are not re-tained in animal tissues, will recirculate to the soil in the form of manure.
The essential minerals can be categorized as macro minerals, gram per kilogram dry matter (g/kg DM) and micro minerals, milligram per kilogram dry matter (mg/kg DM), depending on the amount present in the plant or required by the ani-mal. Macro minerals and micro minerals essential for both plants and animals are calcium (Ca), phosphorus (P), magnesium (Mg), potassium (K), sulphur (S), man-ganese (Mn), zinc (Zn), copper (Cu), cobalt (Co) and molybdenum (Mo). Some minerals are essential for animals but are nonessential for plants, which includes sodium (Na), chlorine (Cl) and iron (Fe). Boron is a micro mineral for plants but not essential for animals, while selenium (Se) and iodine (I) are both essential micro minerals for animals but not for plants (Whitehead, 2000). In this study boron will not be investigated.
Forage is the main feed of ruminants in Sweden. In this study, forage will be defined as cultivated grassland, used as fodder. Knowledge about the mineral con-tent of the forage is important to avoid deficiencies and toxicities (Suttle, 2010). This study will mainly focus on the effect on lactating dairy cattle. An excessive use of some minerals can also lead to environmental pollution (Öborn et al., 2003) and therefore, knowledge about the farm’s mineral status and animals’ requirements are important.
Researcher at SLU have, on behalf of Swedish Environmental Protection Agency, performed inventory and environmental monitoring of Swedish arable land for 30 years. Samples of soil have been collected from the same coordinates, once every ten years. The results were presented in maps where the mineral status of the soil was illustrated (Eriksson et al., 2010).
The aim of this study was to map the concentration of macro minerals, Ca, P, Mg, K, Na, Cl and S and the micro minerals, Fe, Mn, Zn, Cu, Co, Se, I and Mo of forage samples from all over Sweden, and to correlate those data with concentration of minerals in the soil. For the present study, data on chemical composition of feed samples (2010-2017) from Växa Sverige, and data from SLU on topsoil analyses were used.
2.1 Mineral content in forage
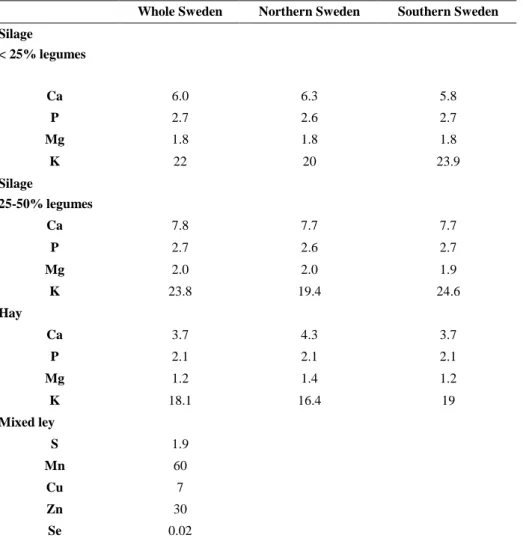
Mineral content in forage is influenced by many different factors such as species, management, weather and soil attributes. Minson (1990) has reviewed mineral con-tent in forage from different countries in the world and mineral concentration in legumes and grasses. Concentration of K, S and Se in forage in the UK has been reviewed by MAFF (1990) (see Suttle, 2010) (Table 1). New data on mean concen-tration of all essential mineral in forages in Nordic countries are scarce. However, the content of Ca, P, Mg and K in silage and hay from different parts of Sweden and the content of S, Mn, Cu, Zn and Se in mixed ley, have been compiled by Spörndly (2003) (Table 2).
Table 1. Mean values of mineral content in different forages
2
Literature review
Unit Forage Temperate legume Temperate
grass Reference
Ca g/kg DM 9 14.2 3.7 Minson, 1990
P g/kg DM 2.9 3.2 3.5 Minson, 1990
Mg g/kg DM 2.3 2.6 1.8 Minson, 1990
K g/kg DM - 27.4 25.8 MAFF, 1990; see Suttle, 2010 Na g/kg DM 2.2 1.6 1.9 Minson, 1990
S g/kg DM - - 2.2 MAFF, 1990; see Suttle, 2010
Mn mg/kg DM 86 - - Minson, 1990
Zn mg/kg DM 36 38 34 Minson, 1990
Cu mg/kg DM 6.1 7.8 4.7 Minson, 1990
Se mg/kg DM 0.05 - - MAFF, 1990; see Suttle, 2010
Table 2. Content of Ca, P, Mg and K (g/kg DM) in samples of silage and hay from different parts of Sweden and content of S (g/kg DM), Mn, Cu, Zn and Se of mixed ley (Spörndly, 2003)
Whole Sweden Northern Sweden Southern Sweden Silage < 25% legumes Ca 6.0 6.3 5.8 P 2.7 2.6 2.7 Mg 1.8 1.8 1.8 K 22 20 23.9 Silage 25-50% legumes Ca 7.8 7.7 7.7 P 2.7 2.6 2.7 Mg 2.0 2.0 1.9 K 23.8 19.4 24.6 Hay Ca 3.7 4.3 3.7 P 2.1 2.1 2.1 Mg 1.2 1.4 1.2 K 18.1 16.4 19 Mixed ley S 1.9 Mn 60 Cu 7 Zn 30 Se 0.02 2.1.1 Species
The macro- (Kuusela, 2006; Pirhofer-Walzl et al., 2011) and micro- (Lindström
et al., 2013; Lindström et al., 2014a; Lindström et al., 2014b) mineral content of the
sward is dependant of the species that are present. Several studies have shown that legumes, in general, have higher mineral content than grasses (Minson, 1990; Kuu-sela, 2006; Suttle, 2010; Lindström et al., 2013; Lindström et al., 2014a; Lindström
et al., 2014b).
In the study by Lindström et al. (2014b) the concentrations of Fe, Mn, Zn, Cu, Co and Mo in common grasses (timothy and meadow fescue), legumes (red- and white clover) and chicory were compared. The authors concluded that even though the concentration of micro minerals were higher when chicory was present in the sward, the total concentration of the minerals in relation to DM showed that
inclusion of red clover in the mixture contributed to increased micro mineral con-tent. This agrees with Pirhofer-Walzl et al. (2011) who studied the levels of macro- and micro minerals of grasses, forage legumes and forage herbs and concluded that legumes had higher concentrations of micro minerals than grasses. The study also concluded that an inclusion of herbs in forage mixtures could increase the levels of some of the minerals.
Kuusela (2006) studied the content of Ca, Mg, P, K and Na as affected by bo-tanical composition. In general, the mineral content was higher in swards with high inclusion of clover, mostly in white clover mixtures, than in grass mixtures. The content of Ca, Mg and Na were higher in clover mixtures, while P and K were higher in grass mixtures. Schlegel et al. (2016) studied the influence of botanical compo-sition on mineral content. The different mixtures consisted of grass (>70% grass), clover- grass mixture (50–70% grass) or herbaceous plants (>50% other herbaceous plants). The grass rich and clover- grass mixture both had a subclass with a lager inclusion of ryegrass, (>70% grass with more than half as ryegrass) and (50–70% grass with more than half as ryegrass). In general, the grass rich classes had lower concentration of minerals than the other mixtures. The two classes with ryegrass had however, even lower concentrations compared to classes with less ryegrass. Lindström et al. (2014a) showed that the content of micro minerals was higher in red clover with highest content of Fe, Mn, Cu, and Co concentration. Timothy had in general lower concentrations of all micro minerals but higher concentration of Zn in comparison to red clover and ryegrass (Lindström et al., 2014a).
The plants different morphological parts can differ in mineral content (White-head, 2000). In common forage grasses timothy, meadow fescue, perennial ryegrass and cocksfoot, the concentration of Ca and Mg were higher in the leaves, while the content of P was higher in the inflorescence. The concentration of K had similar levels in the leaves and the stems of all the grasses except for perennial ryegrass, where the content was higher in the leaves (Fleming, 1963). The content of micro minerals was lower in the stems of all species and particularly in timothy grasses (Lindström et al., 2014a).
2.1.2 Management and other external factors
The growth stage of the plants can have an impact on the nutritional value and can differ between grasses and legumes. As the plants grow, the fibre content will increase and thereby the nutritive value might change. Due to the different morphol-ogy of grasses and legumes, the nutritive value including the mineral content might differ (McDonald et al., 2011). The time of harvest and maturity state of the plant is therefore important to be aware of when dealing with minerals in forage. Schlegel
macro and micro, in fresh herbage was assed. The results showed that the concen-tration of all minerals, except for Fe, increased with the cutting number. This agrees with Pirhofer-Walzl et al. (2011), who found an increase in mineral content in grasses and herbs from first to third cut, while the mineral concentrations in legumes remained more stable among cuts. Schlegel et al. (2016) also looked at mineral con-centration in relation with growth stage. The concon-centration decreased for most of the minerals as the growth continued. The exceptions were Na and Cl, which had increasingly concentrations and Ca, which was stable throughout the process (Schle-gel et al., 2016). The effect of phenological development on micro minerals in tim-othy, perennial ryegrass and red clover was investigated by Lindström et al. (2014a). The mineral concentration had a significant decreased for all micro minerals in the grasses, except for Mo in timothy grass and Mo and Co in perennial ryegrass. In red clover, the concentrations of Fe, Mn and Co were stable throughout the growth stage, while the concentration of Mo decreased in red clover, by more than 50%. For all three species the content of Cu and Zn decreased through all the phenological stages. Due to the decreased content of Cu and Zn, the harvest time might have a large impact on the total amount of these micro minerals in the forage (Lindström
et al., 2014a).
How the forage is conserved can have an impact on the content of minerals (Whitehead, 2000; Schlegel et al., 2018). Hay production (barn-dried and field-dried) and silage production were compared for mineral concentration during har-vest and conservation process (Schlegel et al., 2018). At each harhar-vest, samples were taken from fresh herbage, wilted herbage (not from field-dried) and conserved herb-age. The mineral content for barn-dried hay changed through the conservation. Iron and Co had a significant increase (p<0.01), mainly due to soil contamination, ac-cording to the authors. Calcium, Mg and Zn decreased (p<0.05) and Cu tended to decrease (p<0.10), explained by losses during mechanical treatment at harvest. The concentrations of P, K, Na, Cl, S, Mn and Se were constant throughout the whole process. For field-dried hay the Cl content increased (p<0.01), and the Ca, Mg and Zn contents decreased (p<0.001). The authors did not have an apparent explanation of why the Cl increased. During the production and the conservation of silage, the process did not influence the concentration of Ca, K, Cl, S and Cu. The contents of P, Mg, Na, Fe, Mn, Zn, Co and Se, all increased significant during the conservation of silage (Schlegel et al., 2018).
Supplying fertilizers in different forms, to enhance sward growth, is a common practice for farmers. Usually fertilizers containing N, P and K, or slurry from live-stock naturally high in N and K are applied (Whitehead, 2000). While fertilizers might often increase the content of the applied minerals N, P and K, a secondary effect might cause an alteration of the botanical composition in the mixed ley and
thereby, affecting the mineral content of the ley (Whitehead, 2000; Pirhofer-Walzl
et al., 2011).
The mineral concentration can also be influenced by weather conditions such as temperature, sun hours and rainfall (Whitehead, 2000; Roche et al., 2009). Temper-ature, both in soil and air, affects the uptake of the minerals by plants and have therefore a major impact on the total concentration of mineral (Roche et al., 2009). According to Roche et al. (2009), trace minerals, such as Mn was negatively corre-lated with rainfall, while Zn increased with greater rainfall. Copper, together with its antagonist, Mo and S, were all negatively correlated with the number of sunlight hours.
2.1.3 Attributes in the soil
The amount of minerals in the soil are firstly dependant on the parent material in the soil and the rate of weathering (Whitehead, 2000). The rate of weathering has a large impact on the amount of nutrients available for the plants. The rate might be affected by external factors such as: temperature, climate and soil type, or by the traits of the mineral particle itself: composition of mineral, pH in the soil and the content, production and decomposition of organic matter (Whitehead, 2000; Fogel-fors, 2015). Silicon is presents in many mineral particles and has a great effect on the weathering rate (Fogelfors, 2015).
The content of available minerals in the soil can vary depending on the soil tex-ture, clay content and bedrock geology. Based on bedrock geology, Sweden can be divided into three different geological parts: Fennoscandian shield, Caledonides and Sedimentary limestone, where for example the island Gotland is dominated by sed-imentary limestone (Stephens et al., 1997; Eriksson et al., 2017).
Another important attribute of the soil that establish the nutrient content is the organic matter. Decomposition of dead plant material is depended on the amount of microbial activity, pH and the activity of earthworms and insects. In the process of decomposition, both mineralization and immobilization occur. Mineralization means that elements are converted from organic molecules into inorganic form. Im-mobilization implicates that the overbalance of the mineralized elements is immo-bilize to microbial biomass. Organic matter influences the amount of several min-eral elements. The amount of macro minmin-erals such as S is depended upon the amount of organic matter (Whitehead, 2000). When it comes to some of the trace elements, Eriksson et al. (2017) found that Cu and Mo occurred in higher concentration when the content of organic matter in the soil was higher than 20%.
The pH of the soil influences the availability of many mineral elements and can also have a large impact on the plant uptake. For optimal plant uptake, the mineral soils should have a pH of approximately 6.3. Some minerals have, however, better
availability for plant uptake at different pH values. For instance, the availability of Cu and Fe for the plant increases, at a low pH. The availability of Mn increases in more acidic soils, while availability of Mo thrives in more alkaline soils (Frame & Laidlaw, 2011).
The process of cation exchange capacity (CEC) involves positive charged ions to change place with the negative charged ions in the soil, which results in an in-crease of the available minerals (Fogelfors, 2015). The availability of some macro minerals, Ca, Mg, K and Na is dependent on the CEC in the soil (Whitehead, 2000).
2.1.4 Mineral requirement and available minerals in forage-based diets for ruminants
Mineral requirement for the animals is firstly determined by the physiological state of the animal. Besides physiological state, the animal’s age, production level, gender and breed affect the requirements. When formulating a feed ration it is im-portant not only to know the concentration of the mineral elements in the feed, but also their availability. Availability is defined as the proportion of the mineral or nutrient that can effectively be utilized by the animal. The amount of absorbed min-eral is affected by the chemical form present in the feed or its interactions with other minerals or nutrients, which may result in antagonist effects (Suttle, 2010). Antag-onism means that one mineral inhibits or interfere the uptake of another mineral, which can contribute to cause deficiencies or toxicities. There are also some mineral interactions that might have beneficial effects, for instance, small amount of Cu might enhance Fe utilization (Suttle, 2010).
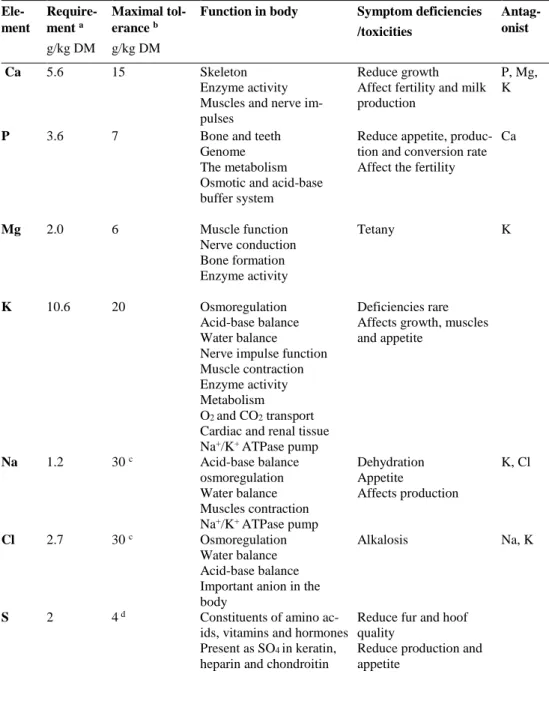
An important aspect to consider regarding mineral requirements in diet formula-tion, is the maximum level of inclusion. The maximal tolerance of a mineral is de-termined by the level of dietary mineral concentration that can be fed without neg-atively affecting animal health or performance (NRC, 2005). Table 3 and 4 shows the requirement, maximal tolerance, function in body, symptom and antagonists of essential minerals for dairy cattle, weighing 600 kg and milking 30 kg ECM.
Forages with high inclusion of legumes are often a good source of Ca for dairy cattle. The physiological state of the animal can, however, alter the requirement and supplementation might be needed, especially for lactating animals with high pro-duction level (Goff, 2018). Due to the high Ca content in clover, a high inclusion of clover in the forage portion of the diet, around parturition, can according to the au-thor Minson (1990), contribute to an increased risk of milk fever for the cows. Re-cent studies have also pointed out that a high Ca intake before parturition can have a negatively effect on Mg metabolism and thereby might indirectly increase the risk of milk fever (Kronqvist et al., 2011). The dietary cation and anion difference (DCAD) is a highly used tool for the prevention of milk fever in dairy production.
The formula most commonly used for the DCAD is: ( Na+ + K+ ) – (Cl- + S--), where
the cations (Na+ and K+ ) affect the Ca metabolism negatively and the anions (Cl-
and S--), affects the Ca metabolism positively. The weeks before parturition, the
DCAD of the feed ration should be aimed to be below 0 and preferably around, – 100 mEq/kg (McDonald et al., 2011). Forage often contains high levels of K (Table 1 and 2), and due to the high proportion of forage in the diets of dairy cows, the DCAD value of the feed ration are often high. A study in Norway, investigated the possibility to decrease the DCAD value in the feed by applying fertilizers high in Cl. The researchers concluded that an application of Cl fertilizers containing 140 kg /ha of Cl, can reduce the DCAD value in the forage (Nesheim et al., 2015)
Forages grown on soils low in P are deficient in P. When forage contain high concentrations of Ca, but low in P, a deficiency in P is most prevalent, due to Ca reducing the resorption of P from the bones and the absorption of P in the intestinal tract (Minson, 1990).
The availability of Mg is influenced by several factors, such as, Mg content of forage, rumen pH or maturity stage of the grass. One of the most important factors is, however, the dietary level of K (NRC, 2001; Suttle, 2010). The Mg levels in forage are often low early in spring, whereas the K concentrations are high. Potas-sium inhibits the uptake of Mg in the rumen and can cause Mg deficiency, also known as tetany (Minson, 1990; Suttle, 2010).
Copper is a mineral with several antagonists, where Mo and S are the two most important ones. Ruminants are more sensitive for these, due to Mo and S forms complex in the rumen with Cu, which inhibits the uptake of Cu and can cause sec-ondary Cu deficiency (Suttle, 1991). The dietary content of Mo and S can affect the absorption of Cu. A higher level of dietary Mo and S decreases the absorption of Cu (NRC, 2001). When, however, the dietary content of Mo and S are low, and the Cu level is high, the risk of Cu toxicity increases (NRC, 2005). Other minerals that can interfere or influence the Cu absorption are Fe, Mn and Zn (Suttle, 2010).
For some of the minerals the interactions with vitamins are essential for the ani-mal health and performance. Ruminants requires Co, among other things, for the synthesis of vitamin B12 by the rumen microbes. An inadequate concentration of Co
may therefore cause deficiency of vitamin B12 (Minson, 1990). Another trace
min-eral that is dependant of a vitamin, is Se with its close interaction with vitamin E. A deficiency of Se might be cured, to some extent, by supplementation of vitamin E, as well as a deficiency in vitamin E could be cured, by a supplementation of Se (Goff, 2018).
For cattle, I toxicities is very rare. The maximal tolerance is therefore firstly set after the tolerance of humans (NRC, 2005).
Table 3. Requirements and maximal tolerance of the total feed ration, function in body, symptoms and antagonists of macro minerals in dairy cattle
a)Requirement is calculated on the minimum amount for a 600 kg LW dairy cow with ≥30 kg ECM (NRC, 2001; Volden, 2011) b)Maximal tolerance is based on (NRC, 2005) c) Based on amount salt (NaCl) d)Diets with at least 40% forage. Ele-ment Require-ment a g/kg DM Maximal tol-erance b g/kg DM
Function in body Symptom deficiencies /toxicities
Antag-onist
Ca 5.6 15 Skeleton
Enzyme activity Muscles and nerve im-pulses
Reduce growth Affect fertility and milk production
P, Mg, K
P 3.6 7 Bone and teeth
Genome The metabolism Osmotic and acid-base buffer system
Reduce appetite, produc-tion and conversion rate Affect the fertility
Ca Mg 2.0 6 Muscle function Nerve conduction Bone formation Enzyme activity Tetany K K 10.6 20 Osmoregulation Acid-base balance Water balance Nerve impulse function Muscle contraction Enzyme activity Metabolism O2 and CO2 transport
Cardiac and renal tissue Na+/K+ ATPase pump
Deficiencies rare Affects growth, muscles and appetite Na 1.2 30 c Acid-base balance osmoregulation Water balance Muscles contraction Na+/K+ ATPase pump Dehydration Appetite Affects production K, Cl Cl 2.7 30 c Osmoregulation Water balance Acid-base balance Important anion in the body
Alkalosis Na, K
S 2 4 d Constituents of amino
ac-ids, vitamins and hormones Present as SO4 in keratin,
heparin and chondroitin
Reduce fur and hoof quality
Reduce production and appetite
Table 4. Requirements and maximal tolerance, based on a DMI, function in body, symptoms and antagonists of micro minerals in dairy cattle
Element Require-ment a mg/kg DM Maximal tolerance b mg/kg DM
Function in the body Symptom of deficien-cies/toxicities Antagonist Fe 50 500 Important component in haemoglobin and transport of oxygen Anemia
Reduce growth and gen-eral state of health Mn 40 2000 Enzyme activation Reduced growth
Skelton abnormalities and ataxia
Ca, P, K
Zn 50 500 Enzyme component and
activator
Parakeratosis, poor growth and reduced ap-petite
Cu, Fe
Cu 10 40 Haemoglobin synthesis,
enzyme systems and pig-ments Anaemia Poor growth Depigmentation of hair and wool Reduced reproduction Ataxia Mo, S, Fe, Mn, Zn Co 0.11 25 Component of vitamin B12
Emaciation, anaemia and listlessness
Se 0.20 0.5 c Component of glutathione
peroxidase, iodine metab-olism, immune function
Myopathy, exudative di-athesis,
White muscle disease S
I 1.0 50 Thyroid hormones Goiter, hairless, weak or dead young
Reduced fertility Mo d - 2.5c Enzyme activation Cu deficiency
a)Requirement is calculated on the minimum amount for a 600 kg LW dairy cow with ≥30 kg ECM (NRC, 2001; Volden, 2011). b)Maximal tolerance is based on (NRC, 2005) c) Maximal content (mg/kg) of total feed-ingstuff as additive (EC No 1831/2003) d) No data available for the requirement of Mo of dairy cattle.
3.1 Data
This study was conducted at the Swedish University of Agriculture Sciences (SLU) in Uppsala.
3.1.1
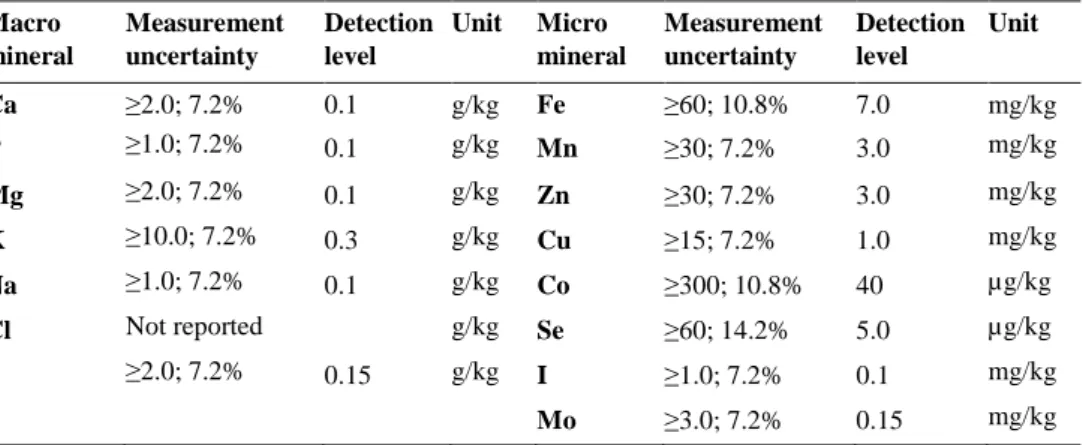
Feed samplesThe data used in this study consisted of analytical results from the NorFor feed analysis system (Växa Sverige, 2017). Samples of cereals and forages were origi-nally, sent by dairy and beef farmers, all over Sweden, to be analysed by commercial laboratories. Macro and micro minerals were analysed, using the method Induc-tively coupled plasma (ICP) or InducInduc-tively coupled plasma mass spectrometry (ICP- MS) (Holst Kjellingbro, 2019, oral source). The measurement uncertainty and de-tection level reported from one of the laboratories is found in Table 5. The meas-urement uncertainty for Ca, for instance was interpreted as the value ≥ 2 g/kg having an uncertainty of ±7.2% (Holst Kjellingbro, 2019, oral source).
Table 5. Measurement uncertainty and detection level of analysed mineral elements Macro mineral Measurement uncertainty Detection level Unit Micro mineral Measurement uncertainty Detection level Unit Ca ≥2.0; 7.2% 0.1 g/kg Fe ≥60; 10.8% 7.0 mg/kg P ≥1.0; 7.2% 0.1 g/kg Mn ≥30; 7.2% 3.0 mg/kg Mg ≥2.0; 7.2% 0.1 g/kg Zn ≥30; 7.2% 3.0 mg/kg K ≥10.0; 7.2% 0.3 g/kg Cu ≥15; 7.2% 1.0 mg/kg Na ≥1.0; 7.2% 0.1 g/kg Co ≥300; 10.8% 40 µg/kg Cl Not reported g/kg Se ≥60; 14.2% 5.0 µg/kg S ≥2.0; 7.2% 0.15 g/kg I ≥1.0; 7.2% 0.1 mg/kg Mo ≥3.0; 7.2% 0.15 mg/kg
At the start, the total amount was 80064 samples, from eight consecutive years (2010-2017).
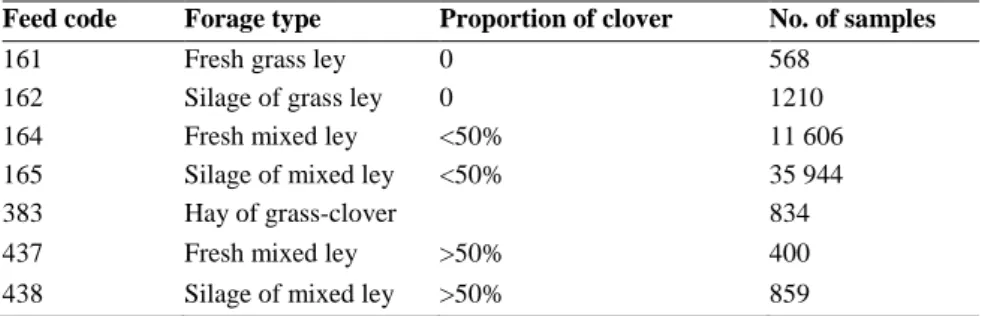
The feed analyses were sorted by feed code and forage type (Table 6), so the remaining samples were mineral analysis of grass and clover forages. The total num-ber of forage analyses were 59148 samples and out of these, 6903 samples were deleted due to lack of mineral analysis.
Table 6. Definition of feed code in NorFor feed analysis system and number of samples for each feed code, used in the study
The forage samples were combined with coordinates for the location of the farms, provided by Växa Sverige, (Eskilstuna, Sweden). Approximately 300 sam-ples lacked coordinates, and a search for coordinates for each farm was done via the websites, hitta.se or eniro.se and the coordinates for WGS84 DD (LAT, LONG) were selected. Due to lack of herd ID, 1030 samples were discarded and therefore, no coordinates for those farms were found. After sorting, the forage samples used for the analysis in this study, were 51449, coming from 4698 different farms, all over Sweden.
3.1.2 Soil samples
The soil samples used in this study were collected from the database Miljödata, SLU (2019a) and were based on a national environmental programme (SLU, 2019b). For more details about the programme see the report by Eriksson et al. (2010).
The soil samples were downloaded during the period of 2018-10-17 to 2018-11-25 (SLU, 2019a). The selected parameters for the soil samples were Ca exchangea-ble, P-AL, Mg exchangeaexchangea-ble, K exchangeaexchangea-ble, Na exchangeaexchangea-ble, S, Fe-AL, Mn, Zn, Cu, Co, Se and Mo. P-AL and Fe-AL is an analytical method used for estimating readily available P and Fe for plant uptake (Eriksson et al., 2010). The mean values of the chosen parameters of the soil, from the years 1988-2018 were selected. Feed code Forage type Proportion of clover No. of samples
161 Fresh grass ley 0 568
162 Silage of grass ley 0 1210
164 Fresh mixed ley <50% 11 606
165 Silage of mixed ley <50% 35 944
383 Hay of grass-clover 834
437 Fresh mixed ley >50% 400
To get a homogenous comparison between soil samples and forage samples, 26 municipalities placed in 21 of the counties in Sweden were chosen. The municipal-ities with the largest number of dairy farms within each county (LRF Mjölk, 2017) were selected. In counties, with high density of dairy farms, several municipalities were selected to get a geographical spread within that county. For each selected municipality, the mean value of the forage samples was calculated.
3.2 QGIS and preparing of maps
Spatial treatment of the forage data set was performed in QGIS, Bonn 3.2.3. The forage samples were divided by each mineral element in different layers and then interpolated within Swedish borders, using inverse distance weighted interpolation (SAGA GIS, 2.3.2 ). The search radius was set to 15 kilometres (km) and the cell size was set to 15 km x 15 km. For each cell the concentration represents an average for the 15 km x 15 km area. For each map five different colours were chosen to represent intervals with different concentrations. The intervals were calculated us-ing equal interval in QGIS. To easier explain the results of the maps, the different colours were defined as:
Red = Low concentration
Orange = Medium low concentration Yellow = Medium concentration Green = Medium high concentration Blue = High concentration
Geographical information of municipalities, counties and borders of Sweden were retrieved from the website of Lantmäteriet (Lantmäteriet, n.d.).
3.3 Statistical analysis
Statistical analyses were performed by using Excel, Microsoft® Office © 2016. The forage samples were, before calculating the mean value, sorted and outliers for each mineral were discarded. A general linear model was fitted to the forage samples mean values with soil samples mean values, of the same municipality, as explana-tory variable. One model was fitted for each mineral.The r-squared (R2) value, also
known as the determination coefficient, was used to judge how much the level of the parameter in the forage could be explained by the level of the parameter in the soil.
Histograms for each mineral in the forage were created in Excel. No outliers were discarded in the histogram.
The mean, standard deviation, median, minimum, percentile 25, percentile 75, maximum and mode values for each mineral, were calculated using the function “statistics” in the program QGIS, Bonn 3.2.3. The most frequent value of each min-eral was defined as the mode value. The value of percentile 25, was defined as the value that 25% of the observations of the samples were below or equal as and per-centile 75 was defined as the value 75% of the observations was below or equal as.
4.1 Macro minerals
The results of the descriptive statistics of macro minerals in the forage are pre-sented in Table 7. The maps of the macro mineral’s concentrations are found in Appendix 1 – 7.
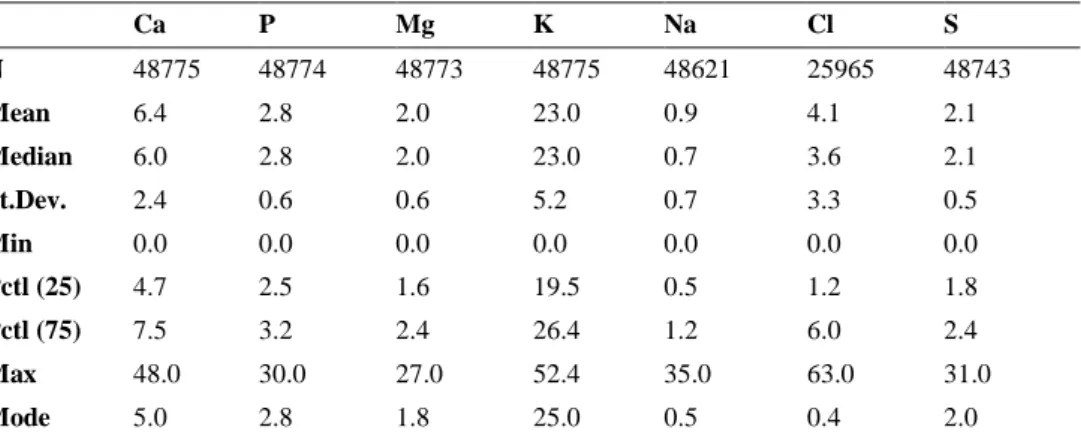
Table 7. Descriptive statistics of macro minerals in samples of forages from all Sweden
Ca P Mg K Na Cl S N 48775 48774 48773 48775 48621 25965 48743 Mean 6.4 2.8 2.0 23.0 0.9 4.1 2.1 Median 6.0 2.8 2.0 23.0 0.7 3.6 2.1 St.Dev. 2.4 0.6 0.6 5.2 0.7 3.3 0.5 Min 0.0 0.0 0.0 0.0 0.0 0.0 0.0 Pctl (25) 4.7 2.5 1.6 19.5 0.5 1.2 1.8 Pctl (75) 7.5 3.2 2.4 26.4 1.2 6.0 2.4 Max 48.0 30.0 27.0 52.4 35.0 63.0 31.0 Mode 5.0 2.8 1.8 25.0 0.5 0.4 2.0 Calcium
The content of Ca in the forage were similar in a large part of Sweden with, 25% of the observations having, a medium concentration of 4.8-7.5 g/kg DM (Table 7 and Appendix 1). Areas around the lakes Storsjön, Vänern, Vättern and Mälaren, the islands Öland and Gotland in east and a small area in southern Skåne, all had medium high to high concentrations of Ca in the forage with approximately 7.5 -13.5 g Ca/kg DM (Appendix 1). The mean value and the mode value were found to be, 6.4 g/kg DM and 5.0 g/kg DM, respectively (Table 7). In areas were the Ca content in the forage was higher, one explanation could be the bedrock geology, where for example, Gotland and Öland have soils naturally high in Ca (Eriksson et
al., 2010; Eriksson et al., 2017). The content of Ca in forage might also be higher
in mixtures with more clover inclusion (Kuusela, 2006), which might be due to the higher content of Ca in the leaves of the plant (Fleming, 1963). Something else that might be good to be aware of is the harvest time. The Ca content in forage increases between first and third cut, according to Schlegel et al. (2016).
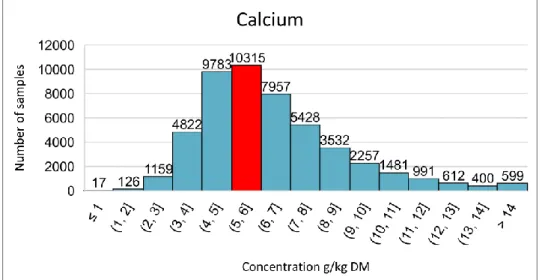
The mean value of the results in this study, correspond to the average value of Ca concentration in whole Sweden, presented by Spörndly (2003) (Table 2). The distribution of the Ca analysis showed a normal distribution of the forage samples (Figure 1). Of the Ca analysis, 75% of the observations had a value of less or equal to 7.5 g/kg DM. High values such as, 48 g/kg DM (Table 7), might indicate a human error either at the time of the sample-taking or at the time of the analysis.
The requirement of Ca for the lactating cow is 5.6 g/kg DM (Table 3) (Volden, 2011). The mean Ca content of forage in Sweden, showed to have an adequate amount of Ca. However, it can be necessary to supplement Ca for high yielding cows, due to an increased requirement of Ca at the peak of lactation (Goff, 2018). The Ca content increases when the inclusion of clover increases (Minson, 1990; Kuusela, 2006; Suttle, 2010), which might negatively affect the metabolism of Mg (Kronqvist et al., 2011). To lower the incidence of milk fever, the DCAD value of the feed ration for the dry cow should be aimed to be below zero. According to Nesheim et al. (2015), this might be achieved, by applying fertilizers with approxi-mately 140 kg/ha of Cl.
The results from the regression analysis indicates a positive linear relation be-tween Ca in the soil and Ca in the forage (Figure 2). The R2 was 57%, which means
Figure 1. Histogram of the Ca content in forage samples. Red column is where the mode value of 5.0 g/kg DM lays.
that approximately 60% of the variation in Ca concentrations in the forage can be explained by Ca content in the soil.
Based on the results from this study, areas with high Ca in the soil might lead to high concentrations of Ca in the forage. However, several factors may influence the Ca content of the forage. Analysing the content of minerals in the forage yearly, is therefore recommended to make sure not to over feed Ca, which might cause P de-ficiency and interfere with the metabolism of Mg. Supplementing the animals with a customized mineral feed might also be a good strategy to ensure that the animals could be provided with right amount of Ca.
Phosphorus
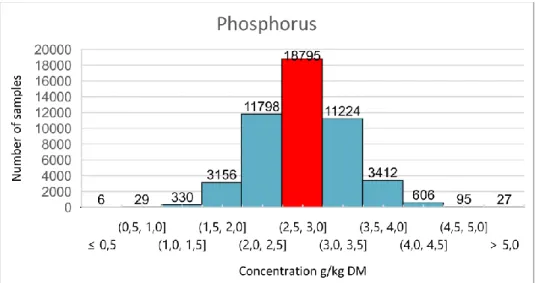
The observed mean and mode values of the content of P in grass and clover for-age in Sweden both were 2.8 g/kg DM (Table 7). A large proportion of the forfor-age samples had similar concentrations of 2.4-2.8 g P/ kg DM, in the whole country. However, concentration of P in the forage showed to be different in different regions of Sweden. Some areas in middle of Sweden had concentrations between 2.0-2.4 g/kg DM, while an area in southern Sweden, concentrations of P, were found to be medium high (2.8-3.2 g/kg DM), with some small areas with high concentrations (3.2-3.6 g/kg DM) (Appendix 2).
Factors that may influence the P content in the forage and might be good to be aware of is the botanical composition of the sward, as grass mixtures, can according to Kuusela (2006), might increase the content of P in the ley.
The mean value of the P concentration, in the forage of whole Sweden in this study, agrees with the mean value of P concentration presented by Spörndly (2003) (Table 2). However, while Spörndly reported similar concentrations of P in northern Figure 2. Regression analysis between Ca in soil and Ca in forage, where each dot represents the mean value of the soil sample and forage sample for each selected municipality.
y = 0,4434x + 5,4451 R² = 0,5692 0 1 2 3 4 5 6 7 8 9 10 0 1 2 3 4 5 6 7 F orage g/k g DM Soil g/kg DM
Calcium
and southern Sweden, results from this study showed a difference in concentration of P, in samples of forage from the north and from the south of Sweden (Table 2). A clear explanation of this cannot be found, but one might speculate that the con-centration of P in the soils varies between the north and south of Sweden and this might therefore contribute to different values in the forage.
The histogram of the P analysis in the forage showed a normal distribution (Fig-ure 3).
Figure 3. Histogram of the P content in forage samples. Red column is where the mode value of 2.8 g/kg DM lays.
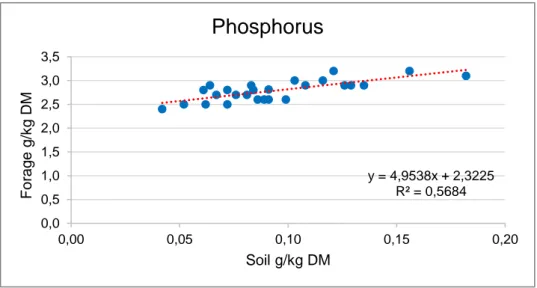
As it was observed for Ca, the linear regression for P in soil and forage showed a R2 of 57% (Figure 4). The content of P is mainly affected by soil properties such
as soil-pH and management factors, like for instance, amount fertilizer applied (Whitehead, 2000; Eriksson et al., 2010). It can also be important to be aware of the content of Ca in the forage, as the P content in the forage might be lower when grown of P deficient soils with high Ca (Minson, 1990).
The requirement of the lactating cow is 3.6 g/kg DM (Table 3) (Volden, 2011). Many of Sweden’s dairy farms may be in risk of P deficiencies disorders, if the animals only were offered forage, as a diet. Due to a large proportion of Swedish livestock is being fed cereals, which contains high P levels, deficiencies might not be a huge problem. But knowledge about the mineral content in the forage might also be of help to prevent environmental pollution and lay out strategies for fertiliz-ers and crop production. As previously mentioned, yearly analysis of the mineral content in the forage should be recommended to be aware of the farm’s mineral status.
Magnesium
The content of Mg in forage was generally the same in whole Sweden with con-centrations of 2.0-2.5 g/kg DM. The most frequent value was 1.8 g/kg DM (Table 7) and was mostly found in areas in middle of Sweden, east around Uppland and in south-east on the islands Öland and Gotland, where the concentrations were 1.5-2.0 g/kg DM (Appendix 3).
The content of Mg in the forage might be influenced by the proportion of clover in the sward, as the Mg content might increase with higher inclusion of clover (Kuu-sela, 2006). The harvest time might also affect the content of Mg, as the content increases from first to third cut (Schlegel et al., 2016).
The mean value of the Mg concentration presented in this study is comparable to the mean value, reported by Spörndly (2003) (Table 2). The distribution of the Mg analysis of the forage samples were found to be normal distributed (Figure 5).
y = 4,9538x + 2,3225 R² = 0,5684 0,0 0,5 1,0 1,5 2,0 2,5 3,0 3,5 0,00 0,05 0,10 0,15 0,20 F orage g/k g DM Soil g/kg DM
Phosphorus
Figure 4. Regression analysis between P in soil and P in forage, where each dot represents the mean value of the soil sample and forage sample for each selected municipality.
, where each dot represents the mean value of the soil sample and forage sample for each selected municipality
The regression of Mg between soil and forage, showed a poor relation, with a R2
of approximately 10% (Figure 6). The content of Mg in the plant increases as the availability for the plant increases, when pH is around 6 (Frame & Laidlaw, 2011).
The requirement of the lactating dairy cows is 2 g/kg DM (Table 3) (Volden, 2011). In areas where the K content in the forage is high, the Mg absorption might be affected negatively and can cause tetany. Farmer’s in these areas should therefore consider giving their animals a mineral feed with extra Mg, which might prevent tetany. It might also be good to not apply slurry right before letting the animals out for pasture or harvest for feed, due to the high content of K in slurry (Whitehead, Figure 5. Histogram of the Mg content in forage samples. Red column is where the mode value of 1.8 g/kg DM lays. y = 0,6483x + 1,9321 R² = 0,095 0,0 0,5 1,0 1,5 2,0 2,5 0,0 0,1 0,1 0,2 0,2 0,3 0,3 0,4 0,4 F orage g/k g DM Soil g/kg DM
Magnesium
Figure 6. Regression analysis between Mg in soil and Mg in forage, where each dot represents the mean value of the soil sample and forage sample for each selected municipality.
2000). Magnesium availability might also be negatively affected by a high Ca intake (Kronqvist et al., 2011) and therefore it is important to yearly analyse the forage.
Potassium
A large part of Sweden showed medium high (20.6-25.6 g/kg DM) to high (25.6-30.7 g/kg DM) concentrations of K in the forage. Some regions in middle of Swe-den, the east coast in north and a small area in south-west, concentrations of 15.6-20.6 g/kg DM, in the forage were found (Appendix 4). The mean value was 23 g/kg DM and the mode value, 25 g/kg DM (Table 7).
The mean value of K in forage presented in this study agrees with the mean value of Sweden, presented by Spörndly (2003) (Table 2).
The content of K in forage can be highly influenced by application of fertilizers and slurry (Whitehead, 2000). You can speculate that, the areas with high concen-tration of K in the forage, might partly be explained by the high proportion of cattle in those areas and thereby a higher application of slurry. As mentioned previously, supplementation of Mg might therefore be necessary in these areas, to prevent tet-any. The distribution of K analysis in the forage was found to be normal distributed (Figure 7).
Figure 7. Histogram of the K content in forage samples. Red column is where the mode value of 25 g/kg DM lays.
The regression of K between the soil and the forage, showed a R2 of
approxi-mately 40% (Figure 8). This might be due to what soil type the selected municipal-ities had and it might also be influenced by the CEC of the soils in the selected municipalities.
Deficiencies of K are rare for the lactating dairy cattle, since the requirement is 10 g/kg DM (Table 3) (Volden, 2011). Due to the relatively high content of K in the forage of Sweden, it might be more important to be aware of the maximal tolerance for the animal. For dairy cattle the maximal tolerance for K is 30 g/kg DM (Table 3) (NRC, 2005). A high K content might also affect the availability of Na, Ca and Cl negatively and the awareness of the respectively content in the feed might there-fore be important to maintain a good animal health and performance.
Sodium
The content of Na in forage were found to be similar in a large part of Sweden with concentrations of 0.08-0.8 g/kg DM. The mean value was 0.9 g/kg DM and the mode 0.5 g/kg DM (Table 7). The exception was southern Sweden in areas near Skåne and Halland, where the concentrations in the forage were approximately 0.8-2.3 g Na/kg DM (Appendix 5). The amount of Na in forage might be affected by factors such as cutting number and selected conservation method (Schlegel et al., 2016; Schlegel et al., 2018).
The mean value presented by Minson (1990) (Table 1), does not agree with the mean value of Na in the forage found in this study (Table 7). It is unclear, why the mean Na concentration of forage in Sweden, is that low, comparing with Minson. You might speculate that, Minson’s values are globally reviewed and that the
y = 39,159x + 17,913 R² = 0,3865 0 5 10 15 20 25 30 0,00 0,05 0,10 0,15 0,20 0,25 Forag e g /k g DM Soil g/kg DM
Potassium
Figure 8. Regression analysis between K in soil and K in forage , where each dot represents the mean value of the soil sample and forage sample for each selected municipality.
climates from the different places, the values are retrieved from, differs a lot from each other.
The distribution of the Na analysis in the forage showed a tendency of normal distribution (Figure 9). The reported detection level was 0.1 g/kg (Table 5). Looking at the histogram a quite high number of samples was equal or less than 0.1 g/kg DM. This might indicate a very low level or due to human error the values might have been presented wrong at the laboratory.
The relation between Na in the soil and Na in the forage, showed a non-linear regression, with a R2 of close to 0 (Figure 10).
Figure 9. Histogram of the Na content in forage samples. Red column is where the mode value of 0.5 g/kg DM lays. y = -0,5492x + 0,8491 R² = 4E-05 0,0 0,2 0,4 0,6 0,8 1,0 1,2 1,4 1,6 1,8 0,000 0,005 0,010 0,015 0,020 0,025 0,030 F orage g/k g DM Soil g/kg DM
Sodium
Figure 10. Regression analysis between Na in soil and Na in forage, where each dot represents the mean value of the soil sample and forage sample for each selected municipality.
The requirement for the lactating dairy cattle is 1.2 g Na/kg DM (Table 3) (Volden, 2011). Sodium has K as an antagonist and it is important to be aware of K content to prevent possible deficiencies. To avoid deficiency in Na, a good practice is to provide the animal with free access of salt.
Chlorine
In south of Sweden the content of Cl in the forage, was found to be medium (3.0-5.5 g/kg DM) to medium high ((3.0-5.5-8.1 g/kg DM). A large part of middle to north of Sweden showed concentrations of Cl in the forage between 0.5-3.0 g/kg DM (Ap-pendix 6). The mean value was 4.0 g/kg DM, while the most frequent value was found to be 0.4 g/kg DM (Table 7). The distribution of the Cl analysis was not nor-mal and a clear explanation of this cannot be found (Figure 11). You could speculate that Cl is the only mineral analysed by a different method, compared to the other minerals. The detection level was not reported, and the lower levels may not have been properly presented by the laboratory. The number of samples were also differ-ent compared to the other macro minerals, and the analyses of Cl started 2011.
The requirement of the lactating cow is 2.7 g Cl/kg DM (Table 3) (Volden, 2011). As for Na, deficiencies of Cl are easier to prevent by proving free access of salt to the animals.
Sulphur
The amount of S in forage was similar in most part of Sweden with a concen-tration range of 1.8-2.2 g/kg DM (Appendix 7) and was represented by 25% of the observations (Table 5). Areas in south-east of Sweden, were found to have medium Figure 11. Histogram of the Cl content in forage samples. Red column is where the mode value of 0.4 g/kg DM lays.
high concentrations in the forage (2.2-2.7 g/kg DM), while parts in the west, around Vänern and middle of Sweden were found to have concentrations of 1.3-1.8 g/kg DM (Appendix 7). According to Roche et al. (2009), the content of S in the forage could be affected negatively by the number of sunlight hours.
Out of the S analysis, 75% had concentrations less than or equal as 2.4 g/kg DM. The maximum value of S (31 g /kg DM) (Table 7), might indicate a human error performed at the laboratory or at the farm, when the samples were taken. The histo-gram of S analysis of the forage showed a normal distribution (Figure 12).
The mean concentration of S found in forage in this study agrees to the mean concentration found in forage in the UK, reported by MAFF (1990) (see Suttle, 2010) (Table 1) and the reference value of S content in forage, previously reported from Sweden (Table 2) (Spörndly, 2003).
Based on the results of the regression analysis between soil S and forage S, about 13% of the S content in the forage, could be explained by content of the S in the soil (Figure 13).
The requirement of S for the lactating cow is 2 g/kg DM (Table 3) (Volden, 2011). Due to the complex formation between S, Mo and Cu, a high content of S and Mo can cause Cu deficiency (Suttle, 1991) and yearly analysis of these minerals in the forage might be necessary.
Figure 12. Histogram of the S content in forage samples. Red column is where the mode value of 2.0 g/kg DM lays.
y = 0,1876x + 2,006 R² = 0,1261 0,0 0,5 1,0 1,5 2,0 2,5 0,0 0,2 0,4 0,6 0,8 1,0 1,2 F orage g/k g DM Soil g/kg DM
Sulphur
Figure 13. Regression analysis between S in soil and S in forage, where each dot represents the mean value of the soil sample and forage sample for each selected municipality
4.2 Micro minerals
In Table 8 the results of descriptive statistics of the micro minerals in the forage are shown. The maps of the micro mineral’s concentrations are found in Appendix 8 – 15.
Table 8. Descriptive statistics of micro minerals in samples of forages from all Sweden
Fe Mn Zn Cu Co Se I Mo N 48348 48347 48341 48347 3631 3767 3631 3748 Mean 190 66 34 7.0 0.09 0.04 0.2 1.9 Median 131 60 30 6.6 0.07 0.02 0.2 1.3 St.Dev. 332 34 45 8.0 0.08 0.06 0.4 2.0 Min 10 1.0 0.0 0.0 0.03 0.0 0.1 0.1 Pctl (25) 93 46 25 5.6 0.04 0.01 0.1 0.9 Pctl (75) 201 80 35 7.8 0.1 0.04 0.3 2.3 Max 50491 1900 4500 1220 1.2 1.9 14.1 38.0 Mode 110 56 28 5.1 0.04 0.02 0.1 0.8 Iron
The concentration of Fe in the forage were found in a large part of Sweden to be approximately 50-300 mg/kg DM (Appendix 8). A small region in northern Sweden had concentration of 300-545 mg/kg DM, in the forage (Appendix 8). The mean value was found to be, 190 mg/kg DM and the mode value, 110 mg/kg DM (Table 8). The distribution of the Fe analysis of the forage did not show a clear normal distribution (Figure 14). The amount of Fe in forage might often be influenced by soil contamination and in some cases, human error at the time of sample-taking.
Figure 14. Histogram of the Fe content in forage samples. Red column is where the mode value of 110 mg/kg DM lays.
The results from the regression analysis between Fe in the soil and Fe in the forage showed a R2 of 3% and had a small negative slope (Figure 15). This might
be due to some of the selected municipalities had observations less than 10 and therefore these values were not included in the regression analysis.
The requirement of Fe for the lactating cow is 50 mg/kg DM (Table 4) (Volden, 2011). The availability can be enhanced by for instance Cu, but the Fe content may also influence the Cu availability of the feed, negatively (Suttle, 2010).
Manganese
The most frequent value of Mn in forage was 56 mg/kg DM and the mean value 66 mg/kg DM (Table 8). The content of Mn in the forage was found to be medium low (21-65 mg/kg DM) to medium (65-109 mg/kg DM) in most parts of Sweden. A small region in the north had a concentration of approximately 109-152 mg/kg DM (Appendix 9). The Mn content can be influenced by a high inclusion of red clover (Lindström et al., 2014a) and the amount of rainfall, might decrease the content of Mn in the forage (Roche et al., 2009).
The mean value of Mn in this study, was quite similar with the mean concentra-tion reported by Minson (1990) (Table 1), but more comparable with the mean Mn concentration compiled by Spörndly (2003) (Table 2). The distribution showed a normal distribution with some high values that might indicate human error at sam-pling or at analyse of forage (Figure 16).
y = 0,0082x + 168,02 R² = 0,0034 0 50 100 150 200 250 0 100 200 300 400 500 F orage m g/k g DM Soil mg/kg DM
Iron
Figure 15. Regression analysis between Fe in soil and Fe in forage, where each dot represents the mean value of the soil sample and forage sample for each selected municipality.
The results of the regression analysis showed a poor linear relation between the Mn soil and Mn forage, having a R2 of 9% (Figure 17). This might be explained by
the selected municipalities and a selection of other municipalities might have shown different results. The concentration of Mn in the forage is highly influenced by the soil properties and the availability of Mn of the plant increases at a pH of 6 (Frame & Laidlaw, 2011).
The requirement of Mn for the lactating cow is 40 mg/kg DM (Table 4) (Volden, 2011). Based on the results from this study, forage produced in Sweden, have ade-quate concentration of Mn. Areas where the content of Mn is high, it might be good Figure 16. Histogram of the Mn content in forage samples. Red column is where the mode value of 56 mg/kg DM lays. y = 0,0132x + 57,38 R² = 0,0936 0 10 20 30 40 50 60 70 80 90 0 200 400 600 800 1000 1200 1400 1600 F orage m g/k g DM Soil mg/kg DM
Manganese
Figure 17. Regression analysis between Mn in soil and Mn in forage, where each dot represents the mean value of the soil sample and forage sample for each selected municipality.